1. Main points
Total production output is estimated to have increased by 1.7% in October 2015 compared with October 2014. There were increases in 3 of the 4 main sectors, with mining & quarrying output being the largest contributor, increasing by 8.5%.
Manufacturing output decreased by 0.1% in October 2015 compared with October 2014. The largest contribution to the decrease came from the manufacture of machinery & equipment not elsewhere classified, which decreased by 15.3%.
Total production output in October 2015 is estimated to have increased by 0.1% compared with September 2015. There were increases in 3 of the 4 main sectors, with the largest positive contribution coming from the water supply, sewerage & waste management output, which increased by 1.7%.
Manufacturing output decreased by 0.4% in October 2015 compared with September 2015. The largest contribution to the decrease came from other manufacturing & repair, which decreased by 5.4%.
In the 3 months to October 2015, production and manufacturing were 8.9% and 6.1% respectively below their figures reached in the pre-downturn GDP peak in Q1 2008.
In this release, periods back to January 2014 are open for revision, in line with the National Accounts revisions policy.
2. Index of Production headline figures
This bulletin presents the monthly estimates of the Index of Production (IoP) for the UK production industries, October 2015. The IoP is one of the earliest indicators of growth and it measures output in the manufacturing (the largest component of production), mining & quarrying, energy supply and water supply & waste management industries. The production industries account for 14.9% of the output approach to the measurement of gross domestic product.
IoP values are referenced to 2012 so that the average for 2012 is equal to 100. Therefore, currently an index value of 110 would indicate that output is 10% higher than the average for 2012. The index estimates are mainly based on a monthly business survey (MBS) of approximately 6,000 businesses, covering all the territory of the UK without geographical breakdown. The total IoP estimate and various breakdowns are widely used in private and public sector institutions. Care should be taken when using the month on month growth rates due to their volatility. All figures contained within this release are seasonally adjusted estimates, unless otherwise stated.
This release presents:
the most recent IoP figures
the economic context to the IoP
GDP impact and components
a supplementary analysis to the IoP
spotlight
background notes section including an assessment of the quality of the IoP, as well as an explanation of the terms used in this bulletin
Table 1 shows the main figures for this release. Figure 1 shows the production and manufacturing series from July 2013 to October 2015.
Table 1: Index of Production main figures, October 2015, UK
| Percentage change | |||||
| Index number 2012=100 | Most recent month on a year earlier | Most recent 3 months on a year earlier | Most recent month on previous month | Most recent 3 months on previous 3 months | |
| Production | 102.4 | 1.7 | 1.7 | 0.1 | 0.6 |
| Manufacturing | 101.4 | -0.1 | -0.5 | -0.4 | 0.4 |
| Source: Primarily Monthly Business Survey (Production and Services) - Office for National Statistics | |||||
Download this table Table 1: Index of Production main figures, October 2015, UK
.xls (23.6 kB)3. Quality of the Index of Production
We have developed guidelines for measuring statistical quality; these are based upon the 5 European Statistical System (ESS) quality dimensions. The IoP in its current form adheres to these requirements. One important dimension for measuring statistical quality is accuracy. That is, the extent to which the estimate measures the underlying "true" value of the output growth (of the production industries) in the UK for a particular period. Although the IoP meets its legal requirements for statistical accuracy, still as in all survey-based estimates, by definition, its estimates are subject to statistical uncertainty or errors. These errors consist of 2 main elements; the sampling error and the non-sampling error.
For many well-established statistics we measure and publish the sampling error associated with the estimate, using this as an indicator of accuracy. The IoP however, is constructed from a variety of data sources, some of which are not based on random samples. As a result, we currently do not publish a measure of the sampling error associated with the IoP underlying data, mainly the monthly business survey (MBS). However, research is currently under way to attempt to measure the standard error and the results of this will be published on completion.
Non-sampling errors are not easy to quantify but can be caused by coverage issues, measurement, processing and non-response. The response rate gives an indication of the likely impact of non-response error on the survey estimates. From January 2015, the MBS response rates for data included in the IoP publication were published in the background methods section of the statistical bulletin. This is to give further information of the percentages of the amount of turnover and questionnaire forms returned. We publish MBS historical response rates back to 2010 (34.5 Kb Excel sheet).
A further dimension of measuring accuracy is reliability, which can be measured using evidence from analyses of revisions to assess the closeness of early estimates to subsequent estimated values. Revisions are an inevitable consequence of the trade-off between timeliness and accuracy.
Figures for the most recent months are provisional and subject to revision in light of:
late responses to surveys and administrative sources
forecasts being replaced by actual data
revisions to seasonal adjustment factors, which are re-estimated every month and reviewed annually
Revisions to the IoP are typically small (around 0.1 to 0.2 percentage points), with the frequency of upward and downward revisions broadly equal.
Further information on the most recent revisions analysis can be found in the revisions to IoP section and in the revision triangles section in the bulletin background note.
It should be noted that care should be taken when using the month-on-month growth rates, due to their volatility. Further information on the latest quality and methodology information (QMI) for the IoP can be found in the QMI paper (247.9 Kb Pdf). Furthermore, the IoP is constantly being reviewed and improved for accuracy and uncertainty as part of the GDP(O) improvement project; further details of improvements are published each year as part of a suite of Blue Book articles. A full list of the GDP(O) improvement project articles can be found on the Improvements page of our website.
Nôl i'r tabl cynnwys4. Economic context
Between January and May 2015, production output increased at a moderate pace. This upward trend was reversed in June and July 2015, although the contraction in output over these 2 months was smaller than the increases observed since the beginning of the year. Following a large rise in August 2015, output has remained relatively stable, with a small fall in September 2015 being offset by a rise in output in October 2015.
In 2015, the performance of the manufacturing industry has been more volatile than that of the Index of Production (IoP) as a whole. Alternating periods of expansion and contraction have led to current manufacturing levels being slightly lower than those experienced at the beginning of the year (for more information and analysis of the latest figures see the production and sectors supplementary analysis section of the bulletin).
Figure 2 shows that between Quarter 1 (Jan to Mar) 1997 and Quarter 3 (July to Sep) 2015 production and its main components followed different trends. Over this period electricity, gas, steam & air conditioning and water & waste management grew at compound average growth rate of 0.2% and 0.5% per quarter while production as a whole contracted at compound average growth rate of -0.1% per quarter. Over the same period manufacturing was relatively flat while mining & quarrying contracted faster than production at compound average growth rate of -1.0% per quarter.
During the economy’s downturn (Quarter 1, Jan to Mar, 2008 and Quarter 2, Apr to June, 2009) production and all of its components contracted. However, the path of mining & quarrying was broadly unaffected by the economy’s downturn with its output contracting only slightly faster than prior to the downturn. Between the economy’s peak in Quarter 1 (Jan to Mar) 2008 and the economy’s trough in Quarter 2 (Apr to June) 2009 manufacturing contracted by the greatest extent (12.3%) followed by total production, water & waste management, mining & quarrying, and electricity, gas, steam & air conditioning (by 10.6%, 8.8%, 7.3% and 3.5% respectively).
Following the economy’s downturn total production and some of its components returned to growth, although mining & quarrying and electricity, gas, steam & air conditioning continued to contract at compound average growth rate of -1.1% and -0.2% per quarter, respectively between Quarter 2 (Apr to June) 2009 and Quarter 3 (July to Sep) 2015.
Despite the growth seen in production and manufacturing since the economy’s downturn, in Quarter 3 (July to Sep) 2015 output remains 9.2% and 6.4% below Quarter 1 (Jan to Mar) 2008 levels. In Quarter 3 (July to Sep) 2015 mining & quarrying and electricity, gas, steam & air conditioning, which continued to decline following the downturn, were 29.4% and 9.1% below their respective values in Quarter 1 (Jan to Mar) 2008. Water & waste management remains the only production component which has surpassed its value in Quarter 1 (Jan to Mar) 2008 (by 8.2% as of Quarter 3 (July to Sep) 2015).
Headline GDP surpassed its pre-downturn peak in Quarter 2 (Apr to June) 2013, and services remains the only headline industry grouping to have achieved this. This is consistent with the historical trend of services growing at a faster rate than production and manufacturing, despite the fact that productivity in the production industries (manufacturing in particular) has on average grown at a faster rate than in the service industries since 1997 (more information can be found in Labour Productivity, Quarter 2 (Apr to June) 2015). The slower output growth and increased productivity, therefore, reflect the falling share of the labour force employed in manufacturing, which fell from 16.5% to 9.8% between 1997 and 2014 (Labour Market Statistics, November 2015, reference table EMP13).
Over the past two years the manufacturing industry has experienced low price inflation as well as a prolonged period of deflation, both in terms of the prices manufacturers pay for materials and fuels used in the production process (input prices) and the prices they charge for the goods they produce (output prices). Input prices paid by UK manufacturers fell by 12.1% in the year to October 2015, slightly up from a fall of 13.4% in the year to September 2015. Output prices have also experienced deflation, falling by 1.3% in the year to October 2015, with crude oil impacting input prices. This feeds through to petroleum products, contributing to the decrease in their output prices (more information can be found in Producer Price Index, October 2015).
Figure 2: Index of production and sub-components, Quarter 1 (Jan to Mar) 1997 to Quarter 3 (July to Sep) 2015, UK

Source: Monthly Business Survey (Production and Services) - Office for National Statistics
Notes:
- Throughout this release Q1 refers to Quarter 1 (January to March), Q2 refers to Quarter 2 (April to June), Q3 refers to Quarter 3 (July to September) and Q4 refers to Quarter 4 (October to December).
Download this image Figure 2: Index of production and sub-components, Quarter 1 (Jan to Mar) 1997 to Quarter 3 (July to Sep) 2015, UK
.png (42.1 kB) .xls (24.6 kB)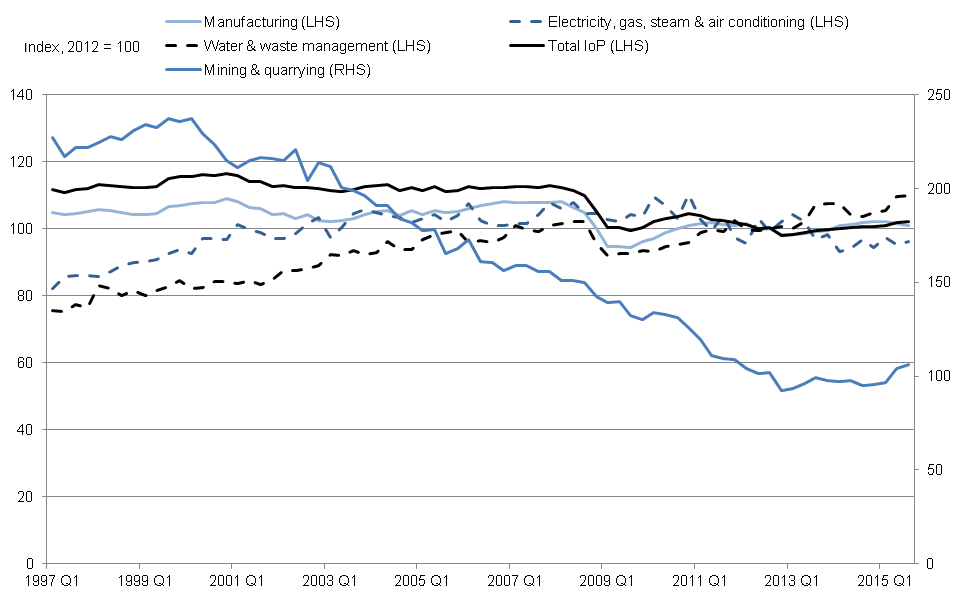
Figure 3 shows the share of nominal gross value added (GVA) accounted for by production in the UK and a selection of other major economies (more information on data for France, Germany, Italy, Japan and the USA can be found on the Organisation for Economic Co-operation and Development (OECD) website). In 1997, the share of nominal GVA accounted for by production in the UK was 23.3%, around the middle of the range relative to the other economies. By 2013, the UK had become relatively less reliant on production, as its share fell to 15.4% of nominal GVA. The same trend was observed in manufacturing, where the share of nominal GVA fell from 18.4% in 1997 to 10.8% in 2013. Moreover, between 1997 and 2013 the composition of production in the UK changed slightly with the share of production attributed to manufacturing decreasing from 78.8% in 1997 to 69.8% in 2013.
Figure 3: Production as a percentage of nominal GVA in comparable economies to the UK, 1997 to 2013
Source: Monthly Business Survey (Production and Services) - Office for National Statistics, Organisation for Economic Co-operation and Development
Notes:
- OECD data correct at 4th December 2015.
Download this chart Figure 3: Production as a percentage of nominal GVA in comparable economies to the UK, 1997 to 2013
Image .csv .xls5. Gross domestic product (GDP) impact and components
In this release, periods back to January 2014 were open for revision, in line with the National Accounts revisions policy (41.6 Kb Pdf).
The estimates for the production industries are generally the first of the main components for the output approach to the measurement of GDP to be published (agriculture, construction and services are the other components). All the components are available for Quarter 3 (July to Sep) 2015. Details of the data already published can be found in Table 2. The Retail Sales Index reported in Table 2 is not a direct component of the output approach to measuring GDP. It does, however, feed into estimates of GDP in two ways. Firstly, it feeds into the services industries when GDP is measured from the output approach. Secondly, it is a data source used to measure household final consumption expenditure which feeds into GDP estimates when measured from the expenditure approach.
Output in the construction industry for October 2015 will be published on 11 December 2015 and services output for the same period on 23 December 2015.
Table 2: Components of GDP, October 2015, UK
| Percentage change | |||||||
| Publication | Percentage of GDP4 | Release date | Month or quarter of GDP2 | Most recent 3 months on a year earlier | Most recent 3 months on 3 months earlier3 | Most recent month on the same month a year ago3 | Most recent month on the previous month |
| Index of | 14.9 | 08 Dec | Oct | 1.7 | 0.6 | 1.7 | 0.1 |
| Production 1 | Sep | 1.4 | 0.2 | 1.5 | 0 | ||
| Construction | 5.9 | 13 Nov | Sep | .. | .. | -1.6 | -0.2 |
| Index of | 78.6 | 27 Nov | Sep | 2.7 | 0.7 | 2.7 | 0.4 |
| services | Aug | 2.8 | 0.9 | 2.7 | 0 | ||
| Retail | 19 Nov | Oct | 4.6 | 0.9 | 3.8 | -0.6 | |
| Sales | Sep | 4.9 | 0.9 | 6.2 | 1.7 | ||
| Agriculture | 0.7 | Q3 2015 | -0.1 | 0.4 | .. | .. | |
| Source: Office for National Statistics Notes: 1. The data for the index of production reflect the latest revisions published as part of this release. 2. Throughout this release Q1 refers to Quarter 1 (January to March), Q2 refers to Quarter 2 (April to June), Q3 refers to Quarter 3 (July to September) and Q4 refers to Quarter 4 (October to December). 3. Any apparent inconsistencies between this table and the latest GDP estimate are due to rounding. 4. 'Percentage of GDP' column may not add up to 100 due to rounding. 5. Q3 refers to Quarter 3 (July to September). | |||||||
Download this table Table 2: Components of GDP, October 2015, UK
.xls (26.6 kB)6. Production and supplementary analysis
Table 3: Headline growth rates for the Index of Production, October 2015, UK
| Description | % of production | Month on same month a year ago growth (%) | Contribution to production (% points) | Month on previous month growth (%) | Contribution to production (% points) | ||
| IoP | 100.0 | 1.7 | 1.7 | 0.1 | 0.1 | ||
| Sector B | 13.5 | 8.5 | 1.1 | 0.9 | 0.1 | ||
| Division 06 | 10.6 | 12.5 | 1.2 | 0.9 | 0.1 | ||
| Sector C | 69.1 | -0.1 | -0.1 | -0.4 | -0.3 | ||
| Sector D | 9.3 | 3.6 | 0.3 | 0.7 | 0.1 | ||
| Sector E | 8.1 | 4.0 | 0.3 | 1.7 | 0.1 | ||
| Source: Office for National Statistics Notes: 1. Headline figures for the Index of Production are: Total Index of Production; Sector B Mining & quarrying; and within this Division 06 Oil & gas extraction; Sector C Manufacturing; Sector D Electricity, gas, steam & air conditioning; and Sector E Water supply, sewerage & waste management. | |||||||
Download this table Table 3: Headline growth rates for the Index of Production, October 2015, UK
.xls (32.8 kB)
Figure 4: Contribution to production percentage growth, between October 2014 and October 2015, UK
Growth rates can be found in the attached IoP 5 tables
Source: Monthly Business Survey (Production and Services) - Office for National Statistics
Notes:
- * denotes headline sectors.
Download this chart Figure 4: Contribution to production percentage growth, between October 2014 and October 2015, UK
Image .csv .xls
Figure 5: Contribution to production percentage growth, between September 2015 and October 2015, UK
Growth rates can be found in the attached IoP 5 tables
Source: Monthly Business Survey (Production and Services) - Office for National Statistics
Notes:
- * denotes headline sectors.
Download this chart Figure 5: Contribution to production percentage growth, between September 2015 and October 2015, UK
Image .csv .xlsTotal production
Total production output increased by 1.7% in October 2015 compared with October 2014 (Table 3). This increase reflected rises in 3 of its 4 main sectors, with mining & quarrying having the largest contribution, increasing by 8.5% and contributing 1.1 percentage points to total production. This was the 7th consecutive increase on a year ago since March 2015. The increase in mining & quarrying was followed by increases in water supply, sewerage & waste management output, which increased by 4.0% and contributed 0.3 percentage points to total production and in electricity, gas, steam & air conditioning output, which increased by 3.6% and contributed 0.3 percentage points to total production. These increases were partially offset by a decrease in manufacturing (the largest component in production), which decreased by 0.1% and contributed 0.1 percentage points to total production (Figure 4).
Between September 2015 and October 2015, total production increased by 0.1% (Table 3). There were increases in 3 of the 4 main sectors. The largest contribution came from water supply, sewerage & waste management output, which increased by 1.7% and contributed 0.1 percentage points to total production. There were also increases in mining & quarrying, which increased by 0.9% and contributed 0.1 percentage points to total production and in electricity, gas, steam & air-conditioning output, which increased by 0.7% and contributed 0.1 percentage points to total production. Largely offsetting the increases was a decrease in manufacturing output, which fell by 0.4% and contributed 0.3 percentage points to total production (Figure 5).
Manufacturing
Manufacturing output decreased by 0.1% between October 2014 and October 2015 and provided a downward contribution of 0.1 percentage points to total production. Output decreased in 7 of the 13 manufacturing subsectors compared with a year ago (Figure 4). The manufacturing sub-sector with the largest downward contribution to total production output was the manufacture of machinery & equipment not elsewhere classified, which decreased by 15.3% and contributed 0.7 percentage points to total production. This was the 11th consecutive decrease since November 2014 and anecdotal evidence suggested that there was a general decrease across the industry compared with a year ago.
In contrast, the manufacturing sub-sector with the largest upward contribution to total production compared with a year ago was the manufacture of transport equipment. This sub-sector increased by 9.3% and contributed 0.8 percentage points to total production, the 14th consecutive increase since August 2014. The main contributor within this sub-sector was the manufacture of motor vehicles, trailers & semi trailers, which increased by 13.5% and contributed 0.6 percentage points to total production.
Manufacturing output decreased by 0.4% between September 2015 and October 2015, having increased in September 2015 by 0.9%. There were decreases in 7 of the 13 manufacturing subsectors (Figure 5). The manufacturing sub-sector with the largest downward contribution to total production was other manufacturing & repair, which decreased by 5.4% and contributed 0.3% percentage points to total production. This fall followed an increase in output of 3.8% in the previous month. The largest contribution to the decrease within this sub-sector was from the repair & maintenance of aircraft & spacecraft, which decreased by 21.5% and contributed 0.2 percentage points to total production, having increased by 7.6% in the previous month.
In contrast to the above decreases, the manufacturing sub-sector with the largest upward contribution to total production was the manufacture of basic pharmaceutical products & pharmaceutical preparations, which increased by 2.7% and contributed 0.2 percentage points to total production.
Mining and quarrying
Mining & quarrying output increased by 8.5% between October 2014 and October 2015 and contributed 1.1 percentage points to total production. The sub-sector with the largest contribution was the extraction of crude petroleum & natural gas, which increased by 12.5% and contributed 1.2 percentage points to total production (Figure 4). This was due to the continued increases in crude oil and gas production. Anecdotal evidence suggested that one of the reasons for the continued increase in outputs for this sector this year, in addition to those reported in previous bulletins, was the limited maintenance to oil and gas facilities this year in comparison with the previous year.
Mining & quarrying output increased by 0.9% in October 2015 compared with September 2015, having decreased by 4.3% the previous month. The sub-sector with the largest contribution was the extraction of crude petroleum & natural gas, which increased by 0.9% and contributed 0.1 percentage points to total production (Figure 5). Evidence suggested that the increase observed within this sub-sector was mainly attributed to increases in outputs in the oil and gas production facilities in the North Sea.
Electricity, gas, steam & air conditioning
Electricity, gas, steam & air conditioning output increased by 3.6% in October 2015 compared with October 2014 and contributed 0.3 percentage points to total production (see Figure 4). This reflected an increase in output in both sub-sectors, with the largest contribution from electric power generation, transmission & distribution, which increased by 2.7% and contributed 0.2 percentage points to total production. Evidence suggested that the increase in output was mainly attributed to the fall in the cost of inputs compared to last year along with an increase in demand.
Electricity, gas, steam & air conditioning output increased by 0.7% in October 2015 compared with September 2015 and contributed 0.1 percentage points to total production (Figure 5). The increase was in 1 of its 2 sub-sectors, the electric power generation, transmission & distribution sector, which increased by 1.1% and contributed 0.1 percentage points to total production.
Water & waste management
Water supply, sewerage & waste management output increased by 4.0% in October 2015 compared with October 2014 and contributed 0.3 percentage points to total production. This increase reflected a rise in all of its four sub-sectors’ output (Figure 4), with the largest contribution coming from sewerage output, which increased by 11.2% and contributed 0.2 percentage points to total production.
Water supply, sewerage & waste management output increased by 1.7% between September 2015 and October 2015 and contributed 0.1 percentage points to total production following a decrease of 1.1% in the previous month. This increase reflected a rise in 3 of its 4 sub-sectors (Figure 5); the largest contribution came from sewerage output, which increased by 3.7% and contributed 0.1 percentage points to total production, having decreased by 5.3% the previous month.
Revisions to IoP
Revisions to the Index of Production follow the National Accounts Revisions policy (41.6 Kb Pdf) . Revisions are caused by a number of factors including, but not limited to revisions to source data due to late responses to the Monthly Business Survey (MBS), actual data replacing forecast data and revisions to seasonal factors that are re-estimated every period. We produce revisions triangles of production and manufacturing growth to provide users with one indication of the reliability of this key indicator. Statistical tests are performed on the average revision to test if it is statistically significantly different from zero. Further information can be found in background note 6.
In this release of data, the earliest period open for revision was January 2014. This is the first time we have been open for revisions earlier than September 2015 since the Index of Production, August 2015 release. This was also consistent with the Quarterly National Accounts and Blue Book 2015, when we were open for revisions back to January 1997. As a result of Blue Book timetable constraints, a number of revisions could not be taken through the system, their incorporation has marginally increased the size of the revisions expected in this release. There were no revisions to IoP month-on-month growth rates greater than 0.2 percentage points.
In September 2015, there was an upward revision of 0.2 percentage points. The month-on-month growth rate was revised from a fall of 0.2% to 0.0%. The largest contributions to the positive revision came from mining & quarrying and manufacturing, which both contributed 0.1 percentage points. These were mainly a result of revisions to source data due to late responses.
Further details on the revisions to IoP components can be found in the IOP5R tables, located within the data section of this release.
Nôl i'r tabl cynnwys7. Industry spotlight: Mining & Quarrying
Mining & quarrying (industry B) is the second largest industry of production, accounting for 13.5% of production output. According to the Standard Industrial Classification (SIC07), industry B includes the extraction of minerals occurring naturally as solids (coal and ores), liquids (petroleum) or gases (natural gas). It also includes supplementary activities aimed at preparing the crude materials for marketing such as crushing and grinding.
Mining & quarrying is divided into three main sub-industries; mining of coal & lignite and extraction of crude petroleum & natural gas are concerned with the mining and quarrying of fossil fuels. Other mining & quarrying plus mining support service activities is concerned with metal ores, various minerals and quarry products and some of the technical operations which may also be carried out for third parties by specialised units as an industrial service. The extraction of crude petroleum & natural gas sub-sector accounts for the majority of the mining & quarrying output (79.1%), with the remaining output being accounted for by sub-industries mining of coal & lignite (1.3%) and other mining & quarrying plus mining support service activities (19.6%).
According to the Annual Business Survey (ABS) the mining & quarrying industry generated £16.5 billion of aGVA in 2014 (72.0% of which was accounted for by the extraction of crude petroleum & natural gas), accounting for 7.6% of the production aGVA in this year. Between 2008 and 2014 the aGVA of industry B fell by 51.7%, while the aGVA of sub-industry 06 fell by 58.8% over the same period. This decline might be associated with the falling estimates of discovered UK oil and gas reserves between 2008 and 2013 (UK Environmental Accounts, 2015).
Prior to the economy’s downturn (Quarter 1 (Jan to Mar) 1997 and Quarter 1 (Jan to Mar) 2008) mining & quarrying followed a broadly downward trend (Figure 6) contracting at compound average growth rate of -0.9% per quarter while production as a whole was relatively flat over the same period. However, during the economy’s downturn (Quarter 1 (Jan to Mar) 2008 to Quarter 2 (Apr to June) 2009) production output contracted by 10.6% while the path of industry B was broadly unaffected (it declined only slightly faster than the pre-downturn).
Following the downturn (Quarter 2 (Apr to June) 2009 to Quarter 3 (July to Sep) 2015) production saw positive growth at compound average growth rate of 0.1% per quarter, however due to its sharp contraction between Quarter 1 (Jan to Mar) 2008 and Quarter 2 (Apr to June) 2009, in Quarter 3 (July to Sep) 2015 it remained 9.2% below its pre-downturn level. In contrast, mining & quarrying experienced a broadly downward trend following the economy’s downturn, and by Quarter 3 (July to Sep) 2015 it was 29.4% below its pre-downturn level. However, between Quarter 4 (Oct to Dec) 2012 and Quarter 3 (July to Sep) 2015 the industry saw a broadly upward trend, growing at compound average growth rate of 1.3% per quarter.
Figure 6: Quarterly output of mining & quarrying and IoP, Oct 2015, UK
Source: Monthly Business Survey (Production and Services) - Office for National Statistics
Notes:
- Throughout this release Q1 refers to Quarter 1 (January to March), Q2 refers to Quarter 2 (April to June), Q3 refers to Quarter 3 (July to September) and Q4 refers to Quarter 4 (October to December).
Download this chart Figure 6: Quarterly output of mining & quarrying and IoP, Oct 2015, UK
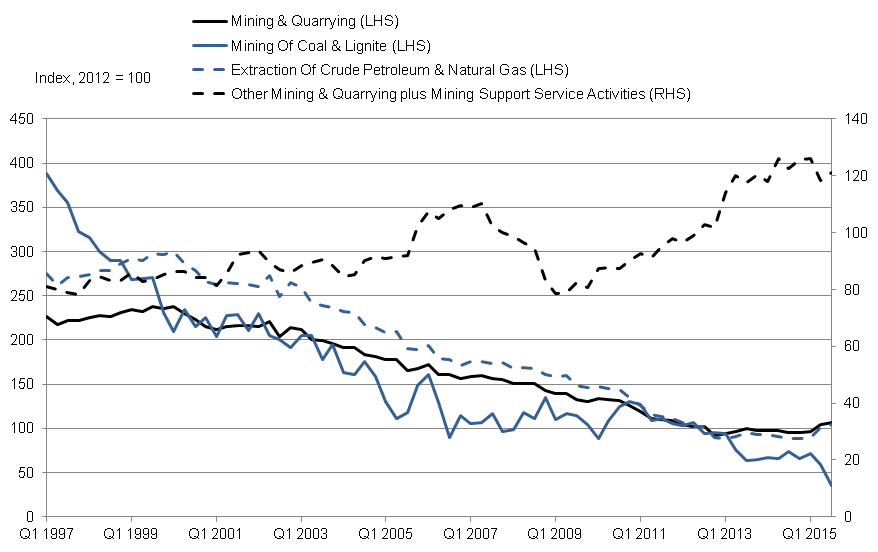
Image .csv .xlsFigure 7 shows that mining & quarrying and most of its sub-industries saw broad based declines. Between Quarter 1 (Jan to Mar) 1997 and Quarter 3 (July to Sep) 2015, sub-industries mining of coal & lignite and extraction of crude petroleum & natural gas contracted at compound average growth rates of -3.2% and -1.3% per quarter, respectively consistent with the trend seen in total mining & quarrying. However, over the same period sub-industry other mining & quarrying plus mining support service activities followed a broadly upward trend growing at compound average growth rate of 0.5% per quarter. As sub-industries mining of coal & lignite and extraction of crude petroleum & natural gas account for 80.4% of mining & quarrying their steep decline explains the generally downward trend observed in the industry.
In Quarter 3 (July to Sep) 2015 mining & quarrying and sub-industries mining of coal & lignite and extraction of crude petroleum & natural gas were 53.1%, 90.8% and 62.2% below their respective values in Quarter 1 (Jan to Mar) 1997 while sub-industry other mining & quarrying plus mining support service activities was 49.4% above its Quarter 1 (Jan to Mar) 1997 level. Between Quarter 4 (Oct to Dec) 2012 and Quarter 3 (July to Sep) 2015 the mining & quarrying followed a broadly upward trend and its output grew by 15.3% which corresponded with growth in sub-industries extraction of crude petroleum & natural gas and other mining & quarrying plus mining support service activities of 15.4% and 19.0%, respectively while sub-industry mining of coal & lignite contracted by 62.6% over the same period.
Figure 7: Quarterly output of mining & quarrying and its sub-components, Oct 2015, UK

Source: Monthly Business Survey (Production and Services) - Office for National Statistics
Notes:
- Throughout this release Q1 refers to Quarter 1 (January to March), Q2 refers to Quarter 2 (April to June), Q3 refers to Quarter 3 (July to September) and Q4 refers to Quarter 4 (October to December).