Cynnwys
- Main points
- Latest indicators at a glance
- Retail footfall
- UK spending on debit and credit cards
- Shelf availability in UK shops
- OpenTable seated diners
- Shipping
- UK flight data
- Road traffic in Great Britain
- Transactions at Pret A Manger
- Data
- Glossary
- Measuring the data
- Strengths and limitations
- Related links
1. Main points
In the week to 22 January 2022, overall retail footfall in the UK increased by 2% and was 80% of the level seen in the equivalent week of 2019; this was in part driven by a 4% increase in high street footfall from the previous week (Springboard). Section 3.
In the week to 20 January 2022, the aggregate CHAPS-based indicator of credit and debit card purchases increased by 2 percentage points from the previous week, to 87% of its February 2020 average (Bank of England CHAPS data). Section 4.
Shelf availability of items between 21 and 24 January 2022 was lowest for "paracetamol", with 24% of these items marked as "none" or "low"; shelf availability was highest for "beer", with 78% of this item recorded as "high" (Kantar Public). Section 5.
The system average price (SAP) of gas decreased by 4% in the week to 23 January 2022 (National Grid). See the accompanying dataset.
The seven-day average estimate of UK seated diners increased by 5 percentage points in the week to 24 January 2022 to 97% of the level in the equivalent week of 2020 (OpenTable). Section 6.
There was an average of 295 daily ship visits in the week to 23 January 2022; this was broadly similar to the previous week (exactEarth). Section 7.
In the week ending 23 January 2022, the seven-day average number of UK daily flights was 52% of the level seen in the equivalent week of 2020 (EUROCONTROL). Section 8.
The volume of motor vehicle traffic on Monday 24 January 2022 was at 90% of its level in the first week of February 2020, broadly unchanged from the level seen the previous week (Department for Transport). Section 9.
In the week ending 23 January 2022, the seasonally adjusted average counts of traffic camera activity for "pedestrians and cyclists", "cars" and "vans" in London all increased from the previous week to 115%, 108% and 99% of the average levels seen in the week before the first UK-wide lockdown, respectively (Transport for London). See the accompanying dataset.
In mid-January 2022, 80% of all businesses were fully trading, this compares with 77% in early January 2022; businesses within the transportation and storage industry and the accommodation and food service activities industry reported the lowest percentage of businesses fully trading, both at 64% (final results from Wave 48 of the Business Insights and Conditions Survey (BICS)).
Transactions at all Pret A Manger store locations increased in the week to 20 January 2022, though they remained below January 2020 levels at most locations; London airport transactions remained the lowest relative to their January 2020 level, at 54% (Pret A Manger). Section 10.
There were 15,468 company incorporations in the week to 21 January 2022, 2% lower than the previous week (15,798) and 3% lower than the equivalent week of 2021 (15,905) (Companies House). See the accompanying dataset.
Results presented in this bulletin are experimental and may be subject to revision.
2. Latest indicators at a glance
Embed code
Notes:
Users should note that Online job advert estimates provided by Adzuna are not available for this week's bulletin. Data will be published as normal for this indicator in next week's publication.
Users should note that the break in the available shipping data (from 14 to 19 June 2021) is when the data collection system changed.
*Comparisons in OpenTable data are made with the equivalent week in 2019 until December 2021. From 1 January 2022 comparisons are made with the equivalent week in 2020. This is likely to change in the coming weeks and revert back to 2019 comparisons across the series.
3. Retail footfall
National retail footfall
National retail footfall figures are supplied by Springboard, a provider of data on customer activity. They measure the following for overall UK retail footfall, as well as by high street, retail park and shopping centre categories:
daily retail footfall as a percentage of its level on the same day of the equivalent week of 2019; for example, Saturday 22 January 2022 is compared with Saturday 19 January 2019
total weekly retail footfall as a percentage of its level in the equivalent week of 2019
the percentage change in weekly footfall compared with the previous week; for example, Week 3 of 2022 is compared with Week 2 of 2022
Springboard's weekly data are defined over a seven-day period running from Sunday to Saturday. Week 3 of 2022 therefore refers to the period Sunday 16 January to Saturday 22 January 2022.
Because of data offsets between 2021 and previous years, footfall data from Springboard for the following days have been omitted: 22 to 23 December 2021, 25 to 26 December 2021, 29 December 2021 and 1 January 2022.
Users should note that all quoted figures have been rounded to the nearest integer.
Figure 1: In the week to 22 January 2022, overall retail footfall in the UK increased by 2% and was 80% of the level seen in the equivalent week of 2019
Volume of daily retail footfall, percentage compared with the equivalent day of the equivalent week of 2019, 1 March 2020 to 22 January 2022, UK

Source: Springboard, Department for Business, Energy and Industrial Strategy
Notes:
- The vertical lines indicate notable events and coronavirus (COVID-19) restriction changes.
- Users should note that week-on-week changes in retail footfall volumes are outlined as percentages, rather than as percentage point changes. Percentage change figures quoted in the commentary will therefore not necessarily match the percentage point changes observed in the chart.
Download this image Figure 1: In the week to 22 January 2022, overall retail footfall in the UK increased by 2% and was 80% of the level seen in the equivalent week of 2019
.png (156.0 kB)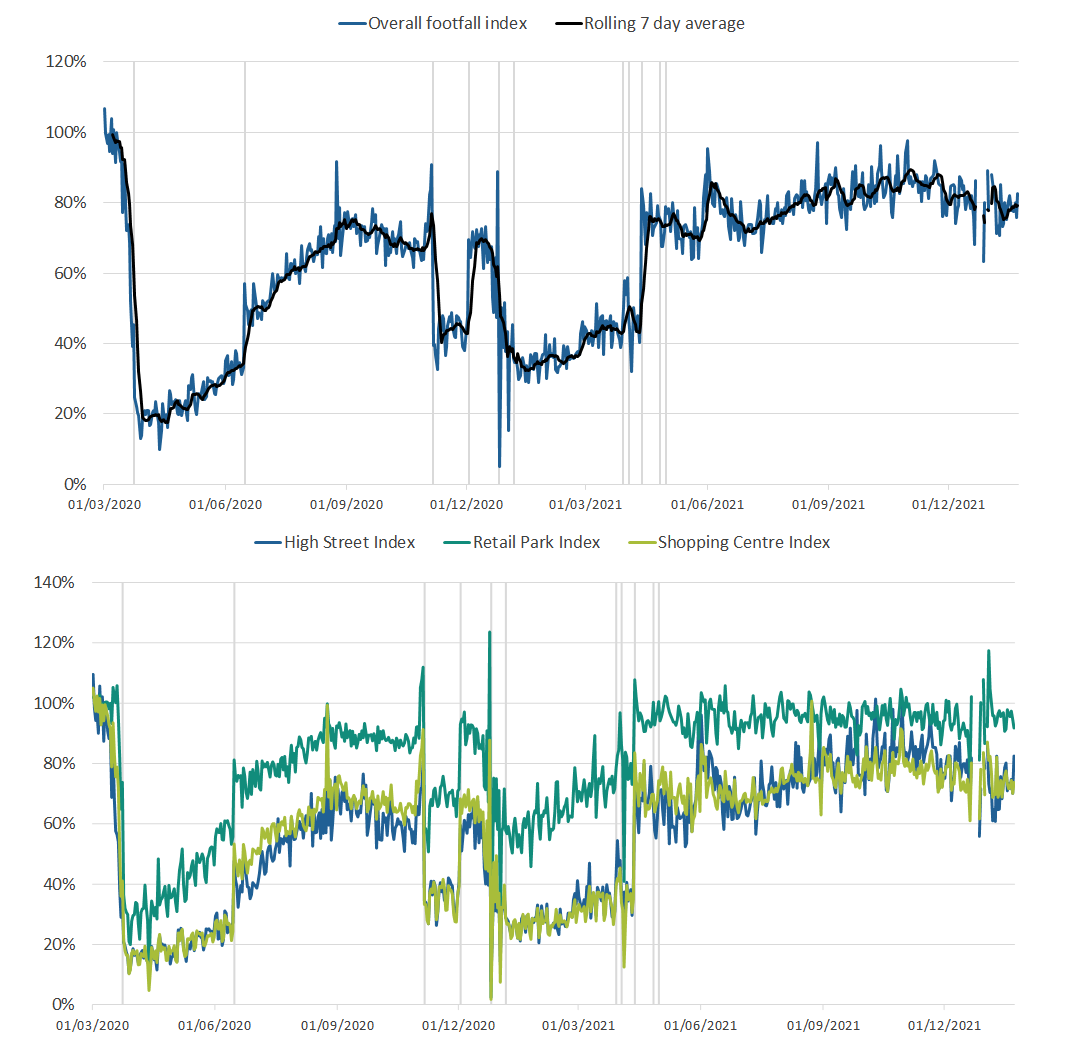
According to Springboard, in the UK in the week to 22 January 2022, the volume of overall retail footfall:
in high streets increased by 4% from the previous week and was 76% of the level seen in the equivalent week of 2019
in retail parks decreased by 1% from the previous week and was 95% of the level seen in the equivalent week of 2019
in shopping centres increased by 1% from the previous week and was 74% of the level seen in the equivalent week of 2019
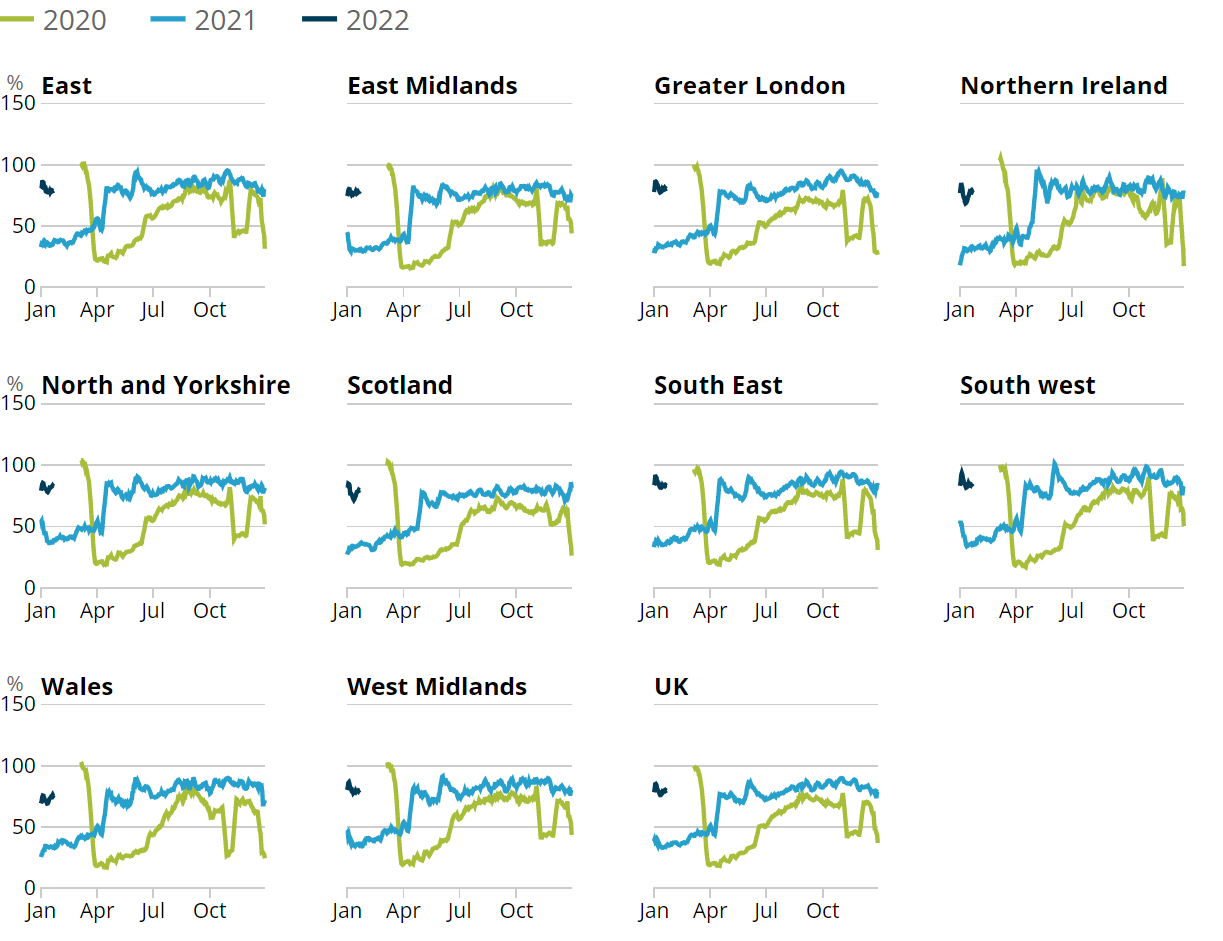
Figure 2: In the week to 22 January 2022, the South West and South East of England had the highest levels of retail footfall compared with the equivalent week of 2019, at 85% and 83%, respectively
Volume of daily retail footfall, percentage of the level recorded on the same day of the equivalent week of 2019, seven-day rolling average, UK countries and English regions, 1 March 2020 to 22 January 2022
Source: Springboard, Department for Business, Energy and Industrial Strategy
Download this image Figure 2: In the week to 22 January 2022, the South West and South East of England had the highest levels of retail footfall compared with the equivalent week of 2019, at 85% and 83%, respectively
.png (98.9 kB)
In the week to 22 January 2022, retail footfall saw week-on-week increases in 9 out of the 10 English regions and UK countries, with the South East remaining unchanged compared with the previous week. The largest weekly increase was in Scotland, which rose by 5%; this was in part driven by an 8% increase in high street footfall.
Nôl i'r tabl cynnwys4. UK spending on debit and credit cards
Daily CHAPS-based indicator
These data series are experimental faster indicators for estimating UK spending on credit and debit cards. They track the daily CHAPS payments made by credit and debit card payment processors to around 100 major UK retail corporates. These payments are the proceeds of recent credit and debit card transactions made by customers at their stores, both via physical and via online platforms. More information on the indicator is provided in the accompanying methodology article.
Companies are allocated to one of four categories based on their primary business:
"staples" refers to companies that sell essential goods that households need to purchase, such as food and utilities
"work-related" refers to companies providing public transport or selling petrol
"delayable" refers to companies selling goods whose purchase could be delayed, such as clothing or furnishings
"social" refers to spending on travel and eating out
Figure 3: The aggregate CHAPS-based indicator of credit and debit card purchases increased by 2 percentage points in the week to 20 January 2022 to 87% of its February 2020 average
Index February 2020 = 100, a backward looking seven-day rolling average, 13 January 2020 to 20 January 2022, non-seasonally adjusted, nominal prices
Source: ONS and Bank of England calculations
Notes:
- Users should note the daily payment data are the sum of card transactions processed up to the previous working day, so there is a slight time lag when compared with real-life events on the chart.
- The vertical lines indicate notable events and coronavirus (COVID-19) restriction changes.
- Percentage point difference is derived from current week and previous week index before rounding.
Download this chart Figure 3: The aggregate CHAPS-based indicator of credit and debit card purchases increased by 2 percentage points in the week to 20 January 2022 to 87% of its February 2020 average
Image .csv .xlsFigure 3 shows changes in the value of CHAPS payments received by large UK corporates from their credit and debit card processors, “merchant acquirers”.
In the week to 20 January 2022, the CHAPS-based indicator of credit and debit card purchases increased by 2 percentage points from the previous week, to 87% of its February 2020 average level.
The spending categories recorded the following changes in the latest week:
“work-related” increased by 9 percentage points
“social” increased by 7 percentage points
“delayable” was unchanged
“staple” was unchanged
The rises in “work-related” and “social” categories appear to be seasonal effects, following weak levels over the post-Christmas period.
“Work-related” and “staple” spending were above their February 2020 average levels at 109% and 103%, respectively. “Social” and “delayable” spending meanwhile, were below their February 2020 average levels at 88% and 69%, respectively.
Nôl i'r tabl cynnwys5. Shelf availability in UK shops
Shelf availability research for shops across the UK has been undertaken by Kantar Public. Collectors gathered information on a range of items from up to three different stores across multiple locations. They recorded availability across four categories: “none”, “low”, “medium” or “high”.
It is important to note these categories are subjective as they are recorded by individual collectors. The data were collected between 21 and 24 January 2022. This series is updated fortnightly.
Figure 4: Shelf availability of items in the latest period was lowest for “paracetamol” and “ibuprofen”, with 24% and 17% of these items’ availability marked as either “none or low”, respectively
Item availability in stores across 132 locations covering UK countries and English regions, between 21 and 24 January 2022
Source: Kantar Public
Notes:
- Shelf availability does not imply stock availability in warehouses or storage units and is simply the level of available products in a selected sample of shops at the time of data collection.
- In this period, 268 shops were visited and 5,616 observations were made.
- Categories in this chart have been rounded for illustrative purposes and may not sum to category total or 100.
Download this chart Figure 4: Shelf availability of items in the latest period was lowest for “paracetamol” and “ibuprofen”, with 24% and 17% of these items’ availability marked as either “none or low”, respectively
Image .csv .xlsIn the most recent period (21 to 24 January 2022), the overall proportion of observations for all categories recorded as "high" was 54%; this was up 6 percentage points from the previous four-day period (7 to 10 January 2022). Observations for all items recorded as "none" or "low" was at 9%, broadly similar to the previous period.
Across the four availability categories, the largest proportion of observations recorded as "high" was "beer" at 78%, followed by "potatoes" at 64%. The items with highest proportion of availability recorded as either "none" or "low" were "paracetamol" and "ibuprofen" at 24% and 17%, respectively.
Data for all categories are available in the accompanying dataset.
Nôl i'r tabl cynnwys6. OpenTable seated diners
Figure 5: The seven-day average estimate of UK seated diners increased by 5 percentage points in the week to 24 January 2022 to 97% of the level in the equivalent week of 2020
Seated diners, seven-day average, percentage compared with the equivalent week of 2019/2020*, week ending 24 February 2020 to week ending 24 January 2022, UK, London and Manchester
Source: OpenTable
Notes:
- Please note that data for Manchester are only available from week ending 16 November 2020.
- *Comparisons in OpenTable data are made with the equivalent week in 2019 until December 2021. From 1 January 2022 comparisons are made to the equivalent week in 2020. This is likely to change in the coming weeks and revert back to 2019 comparisons across the series.
Download this chart Figure 5: The seven-day average estimate of UK seated diners increased by 5 percentage points in the week to 24 January 2022 to 97% of the level in the equivalent week of 2020
Image .csv .xlsIn the latest week, the seven-day average estimate of seated diners in Manchester was broadly similar to the previous week, at 111% of the level seen in the equivalent week of 2020. Meanwhile, in London there was a weekly increase of 5 percentage points, to 67% of the level seen in the equivalent week of 2020.
Nôl i'r tabl cynnwys7. Shipping
A changeover in the systems used to collect these data has introduced a level shift in the data time series from 14 June 2021 onwards. Users should not make comparisons between data before and after this date. The data produced prior to the change, from 1 April 2019 to 13 June 2021, can still be compared within that period.
A full methodological review of our current method of data collection is under way and data may be subject to revision once this is complete. We will continue to update the accompanying dataset using the current method until the review is complete, which is likely to conclude in spring 2022.
Figure 6: There was an average of 295 daily ship visits in the week to 23 January 2022, this is broadly similar to the previous week
Daily movements in shipping visits, UK, seasonally adjusted, 1 April 2019 to 23 January 2022, UK
Source: exactEarth
Download this chart Figure 6: There was an average of 295 daily ship visits in the week to 23 January 2022, this is broadly similar to the previous week
Image .csv .xls
Figure 7: The average number of daily cargo and tanker ship visits decreased by 5% in the week to 23 January 2022 to 94 visits
Daily movements in cargo shipping visits, seasonally adjusted, 1 April 2019 to 23 January 2022, UK
Source: exactEarth
Notes:
- The vertical line indicates the date when the data collection system changed. Users should not compare data before and after this date.
- See the accompanying dataset weekly shipping indicators dataset for notable dates and weather events.
- In the coming weeks, we will continue to review the seasonally adjusted estimates of shipping indicators data following its reintroduction with the discontinuity.
Download this chart Figure 7: The average number of daily cargo and tanker ship visits decreased by 5% in the week to 23 January 2022 to 94 visits
Image .csv .xls8. UK flight data
These data are daily flight figures from the European Organisation for the Safety of Air Navigation (EUROCONTROL). Daily flight numbers for the UK alongside other countries are available in EUROCONTROL's dashboard. EUROCONTROL is a pan-European, civil-military organisation dedicated to supporting European aviation. Its Aviation Intelligence and Performance Review Unit provides independent collection and validation of air navigation services performance-related data and intelligence gathering.
The flights data include international arrivals and departures to and from the UK (including crown dependencies) and domestic UK flights, but exclude overflights (flights that pass over UK territory). They capture all flight movements that operate under Instrument Flight Rules (IFR), where the pilot uses instruments in the flight deck to control, guide and adjust the plane. This includes commercial flights carrying passengers and cargo as well as non-commercial flights such as private and military flights.
Data from EUROCONTROL do not include information on the volume of passengers or cargo carried on UK flights. Especially in the context of the coronavirus (COVID-19) pandemic, flights might not be operating at full capacity and therefore trends in passengers and cargo will differ from trends in flights presented here.
Figure 8: In the latest week, the seven-day average number of UK daily flights was 52% of the level seen in the equivalent week of 2020
Number of daily flights, seven-day moving average, 2 January 2019 to 23 January 2022, UK
Source: European Organisation for the Safety of Air Navigation (EUROCONTROL)
Download this chart Figure 8: In the latest week, the seven-day average number of UK daily flights was 52% of the level seen in the equivalent week of 2020
Image .csv .xls9. Road traffic in Great Britain
According to the Department for Transport (DfT) non-seasonally adjusted road traffic data, the volume of all motor vehicle traffic on Monday 24 January 2022 was broadly unchanged from the previous week (17 January 2022) at 90% of the level seen on the Monday of the first week in February 2020.
Traffic volumes for all types of motor vehicle were broadly unchanged from the previous week (Monday 17 January 2022). Cars continue to have the lowest traffic volumes when compared with their pre-coronavirus (COVID-19) level, at 85% of the level seen in the first week of February 2020, whereas light commercial vehicles and heavy goods vehicles were 106% and 104%, respectively.
Figure 9: The volume of motor vehicle traffic on Monday 24 January 2022 was 90% of its level in the first week of February 2020
Daily road traffic index: 100 = same traffic as the equivalent day of the week in the first week of February 2020, 1 March 2020 to 24 January 2022, non-seasonally adjusted, Great Britain
Embed code
Notes:
- The blue shaded areas refer to periods when restrictions across the UK were in effect.
Download this chart
The daily DfT estimates are indexed to the first week of February 2020 and the comparison is with the same day of the week. The data provided are useful as an indication of traffic change rather than actual traffic volumes. More information on the methods, quality and economic analysis for these indicators can be found in the DfT methodology article.
Nôl i'r tabl cynnwys10. Transactions at Pret A Manger
Pret A Manger is a sandwich and coffee shop franchise chain, operating around 400 stores across the UK. Its transactional data are presented as an index and show total weekly till transactions at Pret A Manger shops as a proportion of the average weekly level in the first four weeks of 2020 (between Friday 3 January and Thursday 30 January 2020). Because of this comparison across the data time series, users should expect an element of seasonality in the data.
More information on the areas featured is available in the Economic activity and social change in the UK, real-time indicators methodology. These data are also made available every Tuesday via Bloomberg.
Figure 10: In the latest week transactions were lowest compared with their January 2020 average in London city stores at 58%, and highest in London suburban stores at 122%
Transactions in stores, index: 100 = January 2020 average, week ending 4 March 2021 to 20 January 2022, non-seasonally adjusted
Source: Pret A Manger
Notes:
- Dine-in services in England were suspended during the third national lockdown, which remained in place until Step 3 (17 May 2021) of England’s roadmap out of lockdown.
- Users should note not all store locations reopened as coronavirus (COVID-19) restrictions were eased.
- The index begins on 4 March 2021 as most stores were closed before this therefore the corresponding indices were mostly zero.
Download this chart Figure 10: In the latest week transactions were lowest compared with their January 2020 average in London city stores at 58%, and highest in London suburban stores at 122%
Image .csv .xlsIn the week to 20 January 2022, transactions at all urban locations increased for the third consecutive week, following declines over the Christmas period. Despite this, only transactions at London suburban, Yorkshire, and regional town stores were above their January 2020 average level at 122%, 120% and 107%, respectively.
Figure 11: Transactions at London and regional stations continued to recover in the week to 20 January 2022, and were at 79% and 63% of their January 2020 average, respectively
Transactions in stores, index: 100 = January 2020 average, week ending 4 March 2021 to 20 January 2022, non-seasonally adjusted
Source: Pret A Manger
Download this chart Figure 11: Transactions at London and regional stations continued to recover in the week to 20 January 2022, and were at 79% and 63% of their January 2020 average, respectively
Image .csv .xlsOf the transport-related locations, transactions at London and regional stations both increased by 8 percentage points in the week to 20 January 2022. In comparison, London airport stores remain broadly unchanged over the same period, following three consecutive weekly declines. Transactions at all transport-related locations remain below their January 2020 level.
Nôl i'r tabl cynnwys11. Data
System Average Price (SAP) of gas
Dataset | Released 27 January 2022
Daily and rolling average System Average Price (SAP) of gas traded in the UK.
UK spending on credit and debit cards
Dataset | Released 27 January 2022
Experimental indicator for monitoring UK retail purchases derived from the Bank of England's CHAPS data.
Company incorporations, voluntary dissolutions and compulsory dissolutions
Dataset | Released 27 January 2022
Weekly dataset showing the number of Companies House incorporations and voluntary dissolutions accepted, and companies placed into compulsory dissolution.
Daily UK flights
Dataset | Released 27 January 2022
Experimental daily UK flight numbers and rolling seven-day average, including flights to, from, and within the UK.
Weekly shipping indicators
Dataset | Released 27 January 2022
Experimental weekly and daily ship visits dataset covering UK ports.
Traffic camera activity
Dataset | Released 27 January 2022
Experimental daily traffic camera counts data for busyness indices covering the UK.
Users should note that this section lists a selection of the data available with this publication. For the full list of available datasets please see the accompanying dataset page.
Nôl i'r tabl cynnwys12. Glossary
Faster indicator
A faster indicator provides insights into economic activity using close-to-real-time big data, administrative data sources, rapid response surveys or Experimental Statistics, which represent useful economic and social concepts.
Company incorporations
Incorporations are when a company is added to the Companies House register of limited companies. This can also include where an existing business applies to become a limited company, where it was not one before.
Voluntary dissolution applications
A voluntary dissolution application is when a company applies to begin dissolution proceedings. As such, they effectively choose to be removed from the Companies House register. For a company to be eligible to voluntarily dissolve, it should not have completed any trading activity for a period of three months.
Compulsory dissolutions
When a company fails to file the required financial accounts and/or confirmation statements, if no contact is received by Companies House following a series of letters to the company and its officers, a first gazette notice is published in the Gazette, a notice of the Registrar's intention to dissolve the company.
Nôl i'r tabl cynnwys13. Measuring the data
UK coronavirus restrictions
A full overview of coronavirus (COVID-19) restrictions for each of the four UK constituent countries can be found:
These restrictions should be considered when interpreting the data featured throughout this bulletin.
Nôl i'r tabl cynnwys14. Strengths and limitations
Information on the strengths and limitations of the indicators in this bulletin is Message available in the Economic activity and social change in the UK, real-time indicators methodology.
Nôl i'r tabl cynnwys