1. Main points
- The labour market remains tight, with total online job adverts at 136% of their February 2020 average level, although the latest online job adverts data show a 6% decrease compared with the previous week, the largest weekly decrease since the week ending 31 December 2020 (12%). Section 3.
- Between early January 2022 and early February 2022, the standardised measure of net turnover from the Business Insights and Conditions Survey (BICS) increased by 2.8% (final results from Wave 51 of the BICS). Section 3.
- Transport indicators showed slight growth this week, which coincided with improved weather across the UK; however, there was a notable fall (30%) in daily ship visits to Dover. Section 4.
- Consumer activity showed a mixed picture with slight decreases in credit and debit card purchases, as well as lower transactions at most Pret a Manger locations and OpenTable seated diners, while overall UK retail footfall increased. Section 5.
- Energy and housing indicators show a notable fall this week after several weeks of growth; the System Average Price (SAP) of gas fell by 39% in the latest week, though it is now 50% higher than it was six months ago on 19 September 2021.
Results presented in this bulletin are experimental and may be subject to revision. Data sources used to compile these indicators are regularly reviewed to ensure representativity and relevance, which may mean indicators change at short notice.
2. Latest indicators at a glance
Embed code
Notes:
- The break in the available shipping data (from 14 to 19 June 2021) is when the data collection system changed.
3. Business and workforce
The labour market remains tight, with total online job adverts at 136% of their February 2020 average level, although the latest online job adverts data show a 6% decrease compared with the previous week, the largest weekly decrease since the week ending 31 December 2020 (12%).
Online job adverts by category
These figures are experimental estimates of online job adverts provided by Adzuna, an online job search engine, by category and by UK country and English region. The number of job adverts over time is an indicator of the demand for labour. The Adzuna categories used do not correspond to Standard Industrial Classification (SIC) categories, so these values are not directly comparable with the Office for National Statistics’ (ONS) Vacancy Survey.
Because of data collection issues, recent comparisons have moved from Friday-to-Friday to Monday-to-Monday comparisons. Please take caution when comparing these data. This will revert back to the usual Friday comparisons as soon as possible.
Figure 1: The total volume of online job adverts in the week to 21 March 2022 decreased by 6% from the previous week, and was 136% of its February 2020 pre-coronavirus (COVID-19) average level
Volume of online job adverts by category, index: 100 = February 2020 average, 4 January 2019 to 21 March 2022, non-seasonally adjusted
Embed code
Notes:
- Further category breakdowns are included in the Online job advert estimates dataset and more details on the methodology can be found in Using Adzuna data to derive an indicator of weekly vacancies.
- Users should note that week-on-week changes in online job advert volumes are outlined as percentages, rather than as percentage point changes. Percentage change figures quoted in the commentary will therefore not necessarily match the percentage point changes observed in the charts and accompanying dataset.
Download this chart
Of the 28 categories, 26 saw a fall in the number of online job adverts, while one increased and the other remained unchanged when compared with the previous week. The largest weekly decreases were in “wholesale and retail” and “marketing, advertising and PR”, which fell by 19% and 15%, respectively. The falls may in part be attributed to seasonal effects and economic uncertainty.
The category with the highest level of online job adverts when compared with its February 2020 pre-coronavirus average level continued to be “transport, logistics and warehouse” at 245%.
The latest three weeks of data for the regional breakdown of Adzuna online job adverts are currently unavailable. We apologise for any inconvenience.
Business impact and insights
Final results from Wave 51 of the Business Insights and Conditions Survey (BICS) cover the reference period 7 to 20 February 2022, with a response rate of 20.6% (7,859 responses). The survey was live for the period 21 February to 6 March 2022.
To ensure comparability between BICS and gross domestic product (GDP) monthly estimates, the GDP estimates presented here only include the same industries as those covered within the BICS. These estimates are then reweighted and termed as GDP*.
Figure 2: The BICS standardised turnover balance estimate increased by 2.8% between early January 2022 and early February 2022
Business Insights and Conditions Survey (BICS) turnover balance standardised and monthly GDP* estimates, UK, 7 June 2020 to 20 February 2022
Source: Office for National Statistics – Business Insights and Conditions Survey (BICS)
Notes:
- Final weighted results, Wave 7 to 51 of the Office for National Statistics' (ONS') Business Insights and Conditions Survey (BICS) and adjusted monthly gross domestic product (termed as GDP*) estimates.
- BICS turnover balances have been standardised and adjusted for magnitude and trading status.
- GDP* is a comparison measure derived to cover the same industries as those covered by BICS, which are then re-weighted. This differs from published monthly GDP.
- BICS data are plotted in the middle of the reference period of each wave and GDP* are plotted in the middle of the reference month. For example, 13 February 2022 is the mid-point of Wave 51 (7 February to 20 February 2022).
Download this chart Figure 2: The BICS standardised turnover balance estimate increased by 2.8% between early January 2022 and early February 2022
Image .csv .xls4. Transport
The transport indicators mostly show slight growth this week following mixed movements in the previous week. However, there was a notable fall (30%) in daily ship visits to Dover, coinciding with major redundancy announcements.
Shipping
A changeover in the systems used to collect shipping data has introduced a level shift in the data time series from 14 June 2021 onwards. Users should not make comparisons between data before and after this date. The data produced before the change, from 1 April 2019 to 13 June 2021, can still be compared within that period.
A full methodological review of our current method of shipping data collection is under way and data may be subject to revision once this is complete. We will continue to update the accompanying weekly shipping dataset using the current method until the review is complete, which is likely to conclude in spring 2022.
Figure 3: There was an average of 274 daily ship visits in the week to 20 March 2022, which was a 2% increase from 268 in the previous week
Daily movements in shipping visits, UK, seasonally adjusted, 1 April 2019 to 20 March 2022, UK
Source: exactEarth
Download this chart Figure 3: There was an average of 274 daily ship visits in the week to 20 March 2022, which was a 2% increase from 268 in the previous week
Image .csv .xlsFigure 4: The average number of daily cargo and tanker ship visits decreased slightly by 2% in the week to 20 March 2022 to 92 visits
Daily movements in cargo shipping visits, seasonally adjusted, 1 April 2019 to 20 March 2022, UK
Source: exactEarth
Notes:
- The vertical line indicates the date when the data collection system changed. Users should not compare data before and after this date.
- See the accompanying dataset for notable dates and weather events.
- In the coming weeks, we will continue to review the seasonally adjusted estimates of shipping indicators data following its reintroduction with the discontinuity.
Download this chart Figure 4: The average number of daily cargo and tanker ship visits decreased slightly by 2% in the week to 20 March 2022 to 92 visits
Image .csv .xls5. Consumer behaviour
Consumer activity showed a mixed picture with slight decreases in credit and debit card purchases, as well as lower transactions at most Pret a Manger locations and OpenTable seated diners, while overall UK retail footfall increased.
UK spending on debit and credit cards: daily CHAPS-based indicator
These data series are experimental faster indicators for estimating UK spending on credit and debit cards. They track the daily CHAPS payments made by credit and debit card payment processors to around 100 major UK retail corporates. These payments are the proceeds of recent credit and debit card transactions made by customers at their stores, both via physical and via online platforms. More information on the indicator is provided in the accompanying methodology article.
Companies are allocated to one of four categories based on their primary business:
- “staples” refers to companies that sell essential goods that households need to purchase, such as food and utilities
- “work-related” refers to companies providing public transport or selling petrol
- “delayable” refers to companies selling goods whose purchase could be delayed, such as clothing or furnishings
- “social” refers to spending on travel and eating out
Figure 5: The aggregate CHAPS-based indicator of credit and debit card purchases decreased by 1 percentage point in the week to 17 March 2022 to 99% of its February 2020 average
A backward looking seven-day rolling average, 13 January 2020 to 17 March 2022, non-seasonally adjusted, nominal prices
Source: Office for National Statistics and Bank of England calculations
Notes:
- Users should note the daily payment data is the sum of card transactions processed up to the previous working day, so there is a slight time lag when compared with real-life events on the chart.
- The vertical lines indicate notable events and coronavirus (COVID-19) restriction changes.
- Percentage point difference is derived from current week and previous week index before rounding.
Download this chart Figure 5: The aggregate CHAPS-based indicator of credit and debit card purchases decreased by 1 percentage point in the week to 17 March 2022 to 99% of its February 2020 average
Image .csv .xlsFigure 5 shows changes in the value of CHAPS payments received by large UK corporates from their credit and debit card processors, “merchant acquirers”.
The CHAPS-based indicator of credit and debit card purchases decreased in the week to 17 March 2022, by 1 percentage point from the previous week, to 99% of its February 2020 average level. The spending categories recorded the following changes in the latest week:
- “social” increased by 1 percentage point
- “delayable” spending was unchanged
- “work-related” decreased by 1 percentage point
- “staple” decreased by 4 percentage points
“Work-related”, “staple” and “social” spending were above their February 2020 average levels at 117%, 109% and 105%, respectively. “Delayable” spending meanwhile was below its February 2020 average level at 82%.
National retail footfall
National retail footfall figures are supplied by Springboard, a provider of data on customer activity. They measure the following for overall UK retail footfall, as well as by high street, retail park and shopping centre categories:
- daily retail footfall as a percentage of its level on the same day of the equivalent week of 2019; for example, Saturday 19 March 2022 is compared with Saturday 16 March 2019
- total weekly retail footfall as a percentage of its level in the equivalent week of 2019
- the percentage change in weekly footfall compared with the previous week; for example, Week 11 of 2022 is compared with Week 10 of 2022
Springboard’s weekly data are defined over a seven-day period running from Sunday to Saturday. Week 11 of 2022 therefore refers to the period Sunday 13 to Saturday 19 March 2022.
Because of data offsets between 2021 and previous years, footfall data from Springboard for the following days have been omitted: 22 to 23 December 2021, 25 to 26 December 2021, 29 December 2021 and 1 January 2022.
Users should note that all quoted figures have been rounded to the nearest integer.
Figure 6: Overall weekly retail footfall in the UK increased in the week to 19 March 2022, by 2% compared with the previous week and was 85% of the level seen in the equivalent week of 2019
Volume of daily retail footfall, percentage compared with the equivalent day of the equivalent week of 2019, 1 March 2020 to 19 March 2022, UK

Source: Springboard, Department for Business, Energy and Industrial Strategy
Notes:
- The vertical lines indicate notable events and coronavirus restriction changes.
- Users should note that week-on-week changes in retail footfall volumes are outlined as percentages, rather than as percentage point changes. Percentage change figures quoted in the commentary will therefore not necessarily match the percentage point changes observed in the chart.
Download this image Figure 6: Overall weekly retail footfall in the UK increased in the week to 19 March 2022, by 2% compared with the previous week and was 85% of the level seen in the equivalent week of 2019
.png (1.1 MB)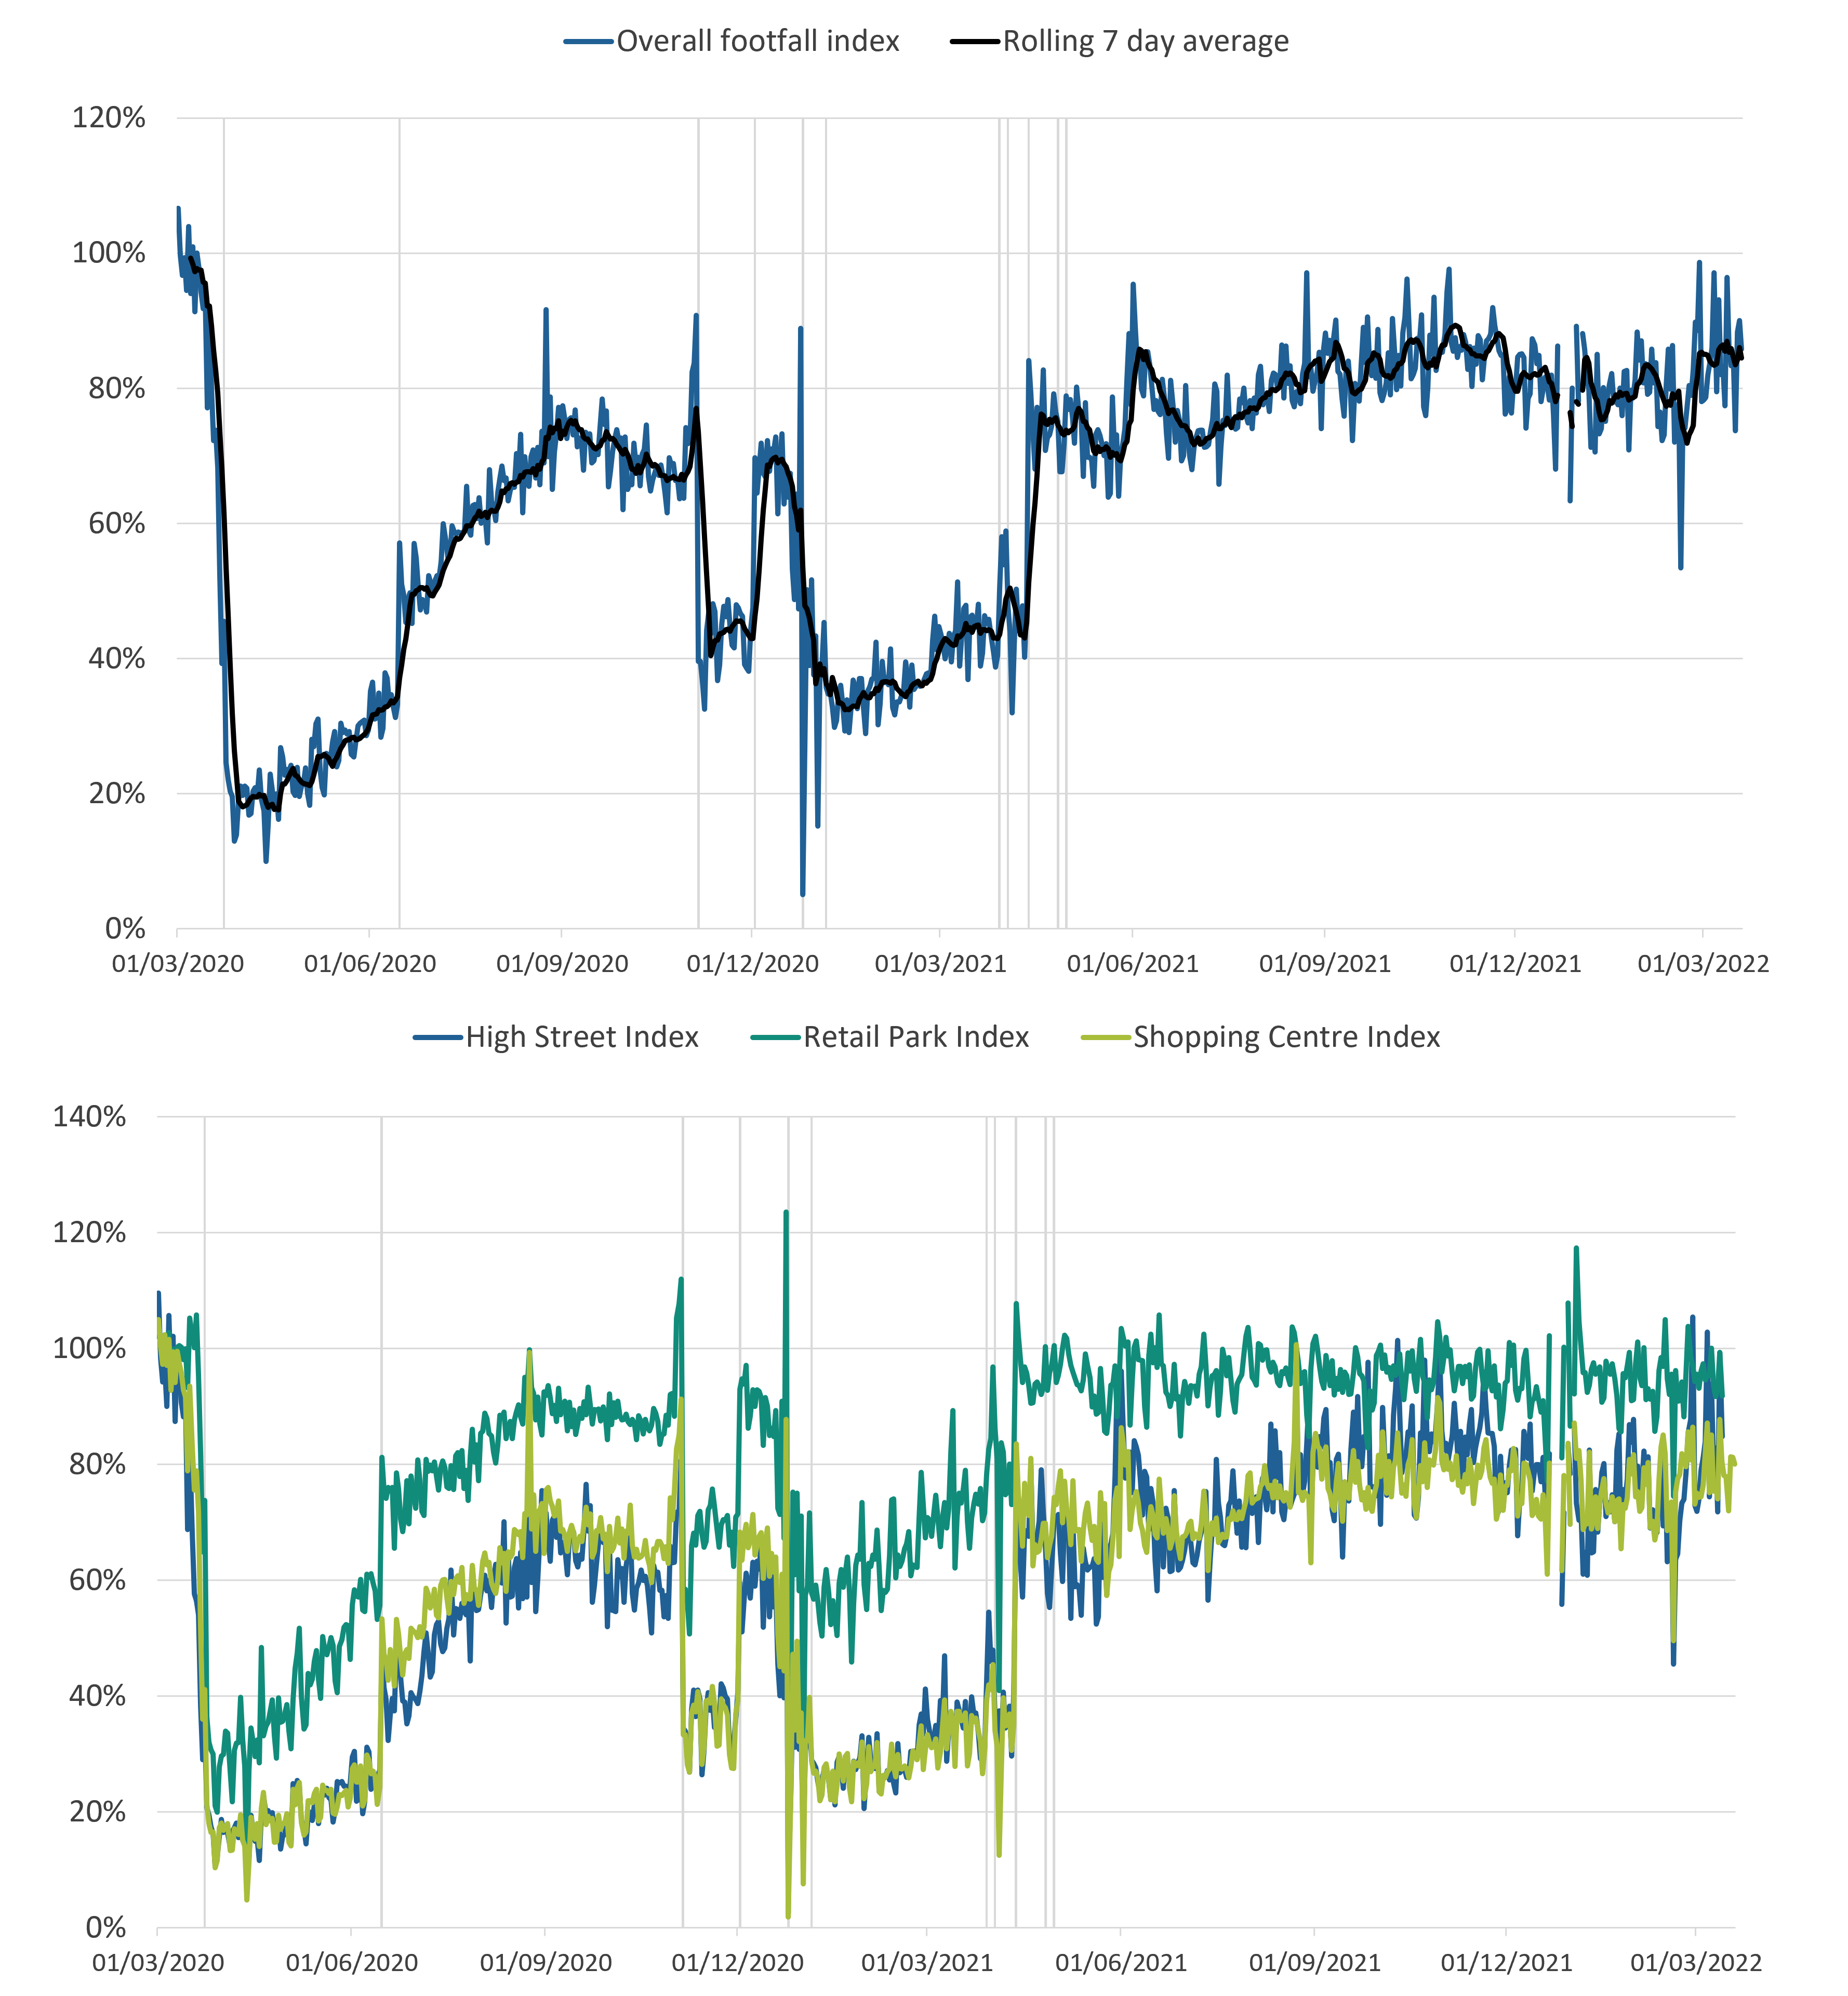
The volume of overall weekly retail footfall in the UK in the week to 19 March 2022:
- in high streets increased by 4% from the previous week and was 83% of the level seen in the equivalent week of 2019
- in retail parks was unchanged from the previous week at 96% of the level seen in the equivalent week of 2019
- in shopping centres increased by 1% from the previous week and was 79% of the level seen in the equivalent week of 2019
Figure 7: The South West had the highest weekly levels of retail footfall in the week to 19 March 2022, compared with the equivalent week of 2019, at 90%
Volume of daily retail footfall, percentage of the level recorded on the same day of the equivalent week of 2019, seven-day rolling average, UK countries and English regions, 1 March 2020 to 19 March 2022

Source: Springboard, Department for Business, Energy and Industrial Strategy
Download this image Figure 7: The South West had the highest weekly levels of retail footfall in the week to 19 March 2022, compared with the equivalent week of 2019, at 90%
.png (90.0 kB)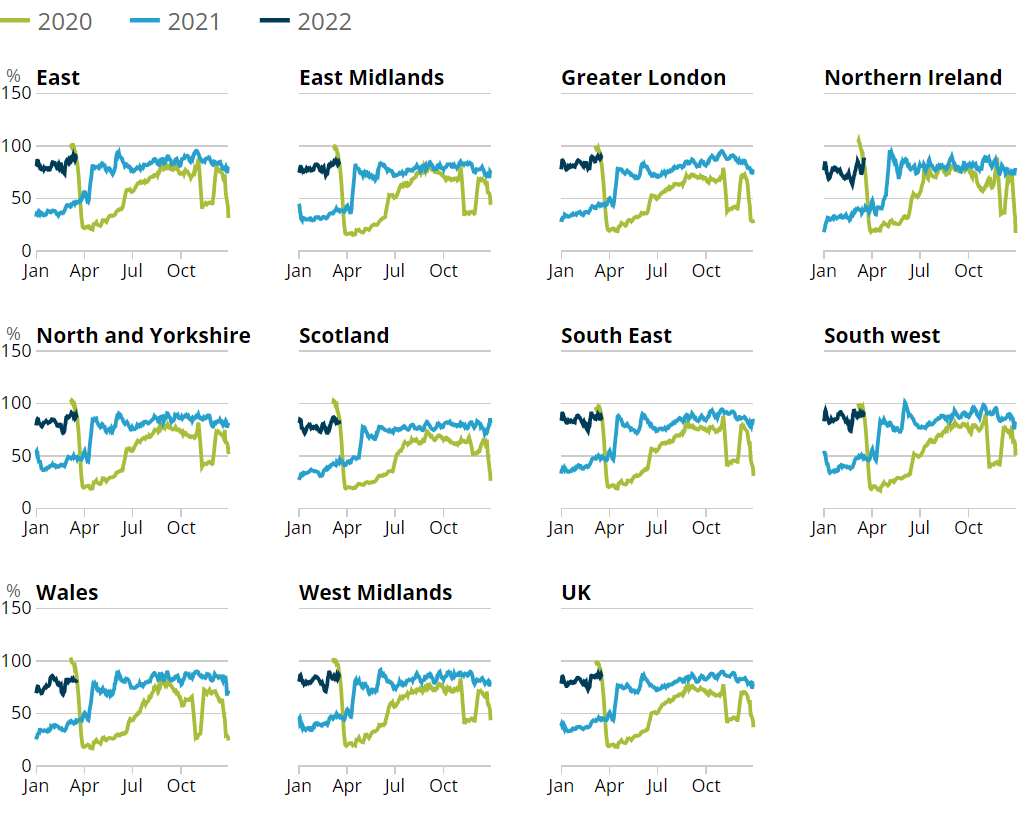
Retail footfall saw week-on-week percentage increases in 7 of the 10 UK countries and English regions in the week to 19 March 2022, the largest of which was in Northern Ireland where it rose by 21% over the week. The East of England and Scotland saw no change in footfall volume over the week, while the South East saw a decrease of 1%.
In the same period, relative to the levels seen in the equivalent week of 2019, retail footfall was strongest in the South West of England, the East of England and Greater London, at 90%, 89% and 88%, respectively. In contrast, retail footfall was weakest in Wales, Scotland and East Midlands, at 79%, 80% and 81% of the levels seen in the equivalent week of 2019, respectively.
Nôl i'r tabl cynnwys6. Data
Advance potential redundancies
Dataset | Released 24 March 2022
Weekly dataset showing the number of potential redundancies and employers proposing redundancies, submitted to Insolvency Service via HR1 forms.
Traffic camera activity
Dataset | Released 24 March 2022
Experimental daily traffic camera counts data for busyness indices covering the UK.
System Average Price (SAP) of gas
Dataset | Released 24 March 2022
Daily and rolling average System Average Price (SAP) of gas traded in the UK.
Weekly shipping indicators
Dataset | Released 24 March 2022
Experimental weekly and daily ship visits dataset covering UK ports.
Transactions at Pret A Manger
Dataset | Released 24 March 2022
Weekly transactional data from approximately 400 Pret A Manger stores around the UK.
Users should note that this section lists a selection of the data available with this publication. For the full list of available datasets please see the accompanying dataset page.
Nôl i'r tabl cynnwys7. Glossary
Faster indicator
A faster indicator provides insights into economic activity using close-to-real-time big data, administrative data sources, rapid response surveys or Experimental Statistics, which represent useful economic and social concepts.
Company incorporations
Incorporations are when a company is added to the Companies House register of limited companies. This can also include where an existing business applies to become a limited company, where it was not one before.
Voluntary dissolution applications
A voluntary dissolution application is when a company applies to begin dissolution proceedings. As such, they effectively choose to be removed from the Companies House register. For a company to be eligible to voluntarily dissolve, it should not have completed any trading activity for a period of three months.
Compulsory dissolutions
When a company fails to file the required financial accounts and/or confirmation statements, if no contact is received by Companies House following a series of letters to the company and its officers, a first gazette notice is published in the Gazette, a notice of the Registrar's intention to dissolve the company.
Nôl i'r tabl cynnwys8. Measuring the data
Information on the methodology used to produce the indicators in this bulletin is available in the Economic activity and social change in the UK, real-time indicators methodology.
Nôl i'r tabl cynnwys9. Strengths and limitations
These statistics have been produced to provide timely indicators of the effect of developing world events on the UK economy and society, using close-to-real-time big data, administrative data sources, rapid response surveys or Experimental Statistics. The data presented in this bulletin are reviewed and refreshed on a regular basis. Indicators are swapped in and out of the publication based on their suitability and availability.
UK coronavirus restrictions
A full overview of coronavirus (COVID-19) restrictions for each of the four UK constituent countries can be found:
These restrictions should be considered when interpreting the data featured throughout this bulletin.
Seasonality
Seasonal fluctuations are likely to be present in many of these indicators so caution must be applied when interpreting changes in series that are not seasonally adjusted.
Nôl i'r tabl cynnwys