Cynnwys
- Main points
- Latest indicators at a glance
- Online job adverts
- System average price (SAP) of gas
- Transactions at Pret A Manger
- Social impact of coronavirus
- UK spending on debit and credit cards
- Business impacts and insights
- Shipping
- Road traffic in Great Britain
- Retail footfall
- OpenTable seated diners
- Data
- Glossary
- Measuring the data
- Strengths and limitations
- Related links
1. Main points
The total volume of online job adverts on 15 October 2021 grew by 2% from the previous week, to 143% of its February 2020 average level; the "transport, logistics and warehouse" category is now more than four times as high as its February 2020 average level (Adzuna). Section 3.
The system average price (SAP) of gas decreased by 6% in the week to 17 October 2021; this was the first weekly fall in 13 weeks (National Grid). Section 4.
Transactions at Pret A Manger stores increased in all regions and transport locations except Manchester and Scotland in the week to 14 October 2021 (Pret A Manger). Section 5.
Of the 96% of adults who left their home in the past seven days, 82% of them reported wearing a face covering; this was a 4 percentage point decrease from the previous period (Opinions and Lifestyle Survey, 6 to 17 October 2021). Section 6.
In the week to 14 October 2021, the aggregate CHAPS-based indicator of credit and debit card purchases decreased by 5 percentage points from the previous week, to 97% of its February 2020 average; this was driven by decreases in "staple", "work related" and "delayable" spending categories (Bank of England CHAPS data). Section 7.
Almost one in six businesses (16%) intend to use increased homeworking as a permanent business model going forward, with the main reasons for this being improved staff well-being, reduced overheads and increased productivity (Business Insights and Conditions Survey (BICS)). Section 8.
There was an average of 290 daily ship visits in the week to 17 October 2021, broadly similar to the previous week at 294; the average number of daily cargo and tanker ship visits was unchanged from the previous week at 94 (exactEarth). Section 9.
The volume of motor vehicle traffic on Monday 18 October 2021 was at 96% of its level in the first week of February 2020, a 2 percentage point decrease from the previous week (Department for Transport). Section 10.
The seasonally adjusted average count of traffic camera activity in London had increased for all vehicle types in the week ending 17 October 2021 (Transport for London). See the accompanying dataset.
In the week to 16 October 2021, overall retail footfall in the UK fell slightly by 1% from the previous week and was at 86% of the level seen in the equivalent week of 2019 (Springboard). Section 11.
The seven-day average estimate of UK seated diners in the week to 18 October 2021 was 119% of the level in the equivalent week of 2019; the corresponding figure for Manchester and London were 121% and 86%, respectively (OpenTable). Section 12.
The seven-day average number of UK daily flights was 3,625 in the week ending 17 October 2021, this was 59% of the level seen in the equivalent week of 2019; the highest this figure has been since the first UK wide lockdown (EUROCONTROL). See the accompanying dataset.
There were 11,568 compulsory dissolution first gazettes (a notice issued by Companies House indicating their intention to remove a company from the register) in the week to 12 October 2021 (Companies House). See the accompanying dataset.
There were 6,678 voluntary dissolution applications (an application from a company to dissolve) in the week to 15 October 2021, an increase of 22% from the previous week and 13% higher than the equivalent week of 2019 (5,898) (Companies House). See the accompanying dataset.
There were 14,144 company incorporations in the week to 15 October 2021, an increase of 4% from the previous week and broadly unchanged from the equivalent week of 2019 (14,107) (Companies House). See the accompanying dataset.
Results presented in this bulletin are experimental and may be subject to revision.
2. Latest indicators at a glance
Embed code
Notes:
- Users should note that the break in the available shipping data (from 14 to 19 June 2021) is when the data collection system changed.
3. Online job adverts
Job adverts by category
These figures are experimental estimates of online job adverts provided by Adzuna, an online job search engine, by category, by UK country and English region. The number of job adverts over time is an indicator of the demand for labour. The Adzuna categories used do not correspond to Standard Industrial Classification (SIC) categories, so these values are not directly comparable with the Office for National Statistics (ONS) Vacancy Survey.
Figure 1: The total volume of online job adverts on 15 October 2021 grew by 2% from the previous week, to 143% of its February 2020 average level
Volume of online job adverts by category, index= February 2020 average, 4 January 2019 to 15 October 2021, non-seasonally adjusted
Embed code
Notes:
Further category breakdowns are included in the online job advert estimates dataset and more details on the methodology can be found in Using Adzuna data to derive an indicator of weekly vacancies.
Users should note that week-on-week changes in online job advert volumes are outlined as percentages, rather than as percentage point changes. Percentage change figures quoted in the commentary will therefore not necessarily match the percentage point changes observed in the charts and accompanying dataset.
Download the data
Of the 28 categories, 19 saw a weekly increase in the number of online job adverts, 3 were unchanged and 6 decreased when compared with the previous week. The largest weekly increase was in “sales”, which rose by 34%; this figure should be treated with caution because of a large number of adverts from a single employer. The largest week-on-week decreases were in “construction and trades” and “domestic help”, which fell by 15% and 12%, respectively. Of the 28 categories, only “energy, oil and gas” and “legal” are below their February 2020 average level.
Figure 2: The volume of job adverts in “transport, logistics and warehouse” are over four times as high as the February 2020 average level, having increased by 6% from the previous week
Volume of online job adverts by category, index: 100 = February 2020 average, 3 January 2020 to 15 October 2021, non-seasonally adjusted
Source: Adzuna
Download this chart Figure 2: The volume of job adverts in “transport, logistics and warehouse” are over four times as high as the February 2020 average level, having increased by 6% from the previous week
Image .csv .xlsJob adverts by region
Figure 3: North East England was the region with the highest volume of online job adverts relative to its February 2020 average level
Volume of online job adverts by UK countries and English regions, index: 100 = February 2020 average, 4 January 2019 to 15 October 2021, non-seasonally adjusted
Embed code
Download the data
Despite some week-on-week falls in the volume of job adverts in some parts of the UK, notably in Northern Ireland, which fell by 4%, the volume of online job adverts continued to trend gradually upwards in 8 of the 12 UK countries and English regions and all 12 remain substantially above their February 2020 average level.
Nôl i'r tabl cynnwys4. System average price (SAP) of gas
System average price (SAP) of gas are available in the Data Item Explorer from the National Grid.
The system average price (SAP) is the average price of all gas traded through the balancing market. Market participants post bids or offers for volumes of gas as day-ahead and within-day trades. The SAP aggregates the trades conducted on the On-the-Day Commodity Market (OCM). This is the market that National Grid use in their role as residual balancer. Other markets exist for wholesale gas trading in Great Britain.
These data can be used to understand the general trend of gas prices within Great Britain. However, they should be treated with caution as these can be subject to extreme within-day trading prices and may skew actual traded prices. It must also be noted that while these prices reflect spot prices on the day, traders can opt for futures contracts where the buyer and the seller agree the market-determined price for gas for a future date. The daily SAP is used to determine the futures price and is therefore a useful indicator of supply constraints and demand pressures.
These data and the accompanying dataset are updated weekly in this bulletin.
Figure 4: The preceding seven-day rolling average gas price decreased by 6% in the week to 17 October 2021
System average price, pence per kilowatt hour, 1 January 2019 to 17 October 2021, Great Britain, non-seasonally adjusted
Source: National Grid
Notes:
- The price trends observed above will differ from that of the monthly Producer Price Inflation (PPI) series published by the ONS because of the differences in data sources and methods.
Download this chart Figure 4: The preceding seven-day rolling average gas price decreased by 6% in the week to 17 October 2021
Image .csv .xlsSince the start of 2021, the seven-day rolling average SAP has been steadily increasing. The price has almost tripled since the start of the year, with an increase of 293% since 1 January 2021, and it has increased by 115% since 1 August 2021. However, in the latest week the SAP preceding seven-day average decreased by 6% to 7.262 pence per kilowatt hour. This is the largest weekly fall since 28 February 2021 but follows 13 consecutive weeks of price increases.
The full time series of actual day SAP and the preceding seven-day average, encompassing data from 2018 to the present, can be found in the accompanying dataset.
Nôl i'r tabl cynnwys5. Transactions at Pret A Manger
Pret A Manger are a sandwich and coffee shop franchise chain, operating around 400 stores across the UK. Their transactional data are presented as an index and show total weekly till transactions at Pret shops as a proportion of their average weekly level in the first four weeks of 2020 (between Friday 3 January and Thursday 30 January 2020). Because of this comparison across the time series, users should expect an element of seasonality in the data.
More information on the areas featured is available in the Measuring the data section. These data are also made available every Tuesday via Bloomberg.
Figure 5: Transactions at Pret A Manger stores in the week ending 14 October 2021 rose in all regions except Manchester and Scotland, relative to the previous week
Transactions in stores, index: 100 = January 2020 average, week ending 4 March 2021 to 14 October 2021, non-seasonally adjusted
Source: Pret A Manger
Notes:
- Dine in services in England were suspended during the third national lockdown remaining in place until Step 3 (17 May 2021) of England’s roadmap out of lockdown.
- Users should note not all store locations reopened as COVID-19 restrictions were eased.
- The index begins on 4 March 2021 as most stores were closed prior to this therefore the corresponding indices were mostly 0.
Download this chart Figure 5: Transactions at Pret A Manger stores in the week ending 14 October 2021 rose in all regions except Manchester and Scotland, relative to the previous week
Image .csv .xlsIn the week ending 14 October 2021, transactions at Pret stores in Scotland experienced a negative 3 percentage point change, compared with the previous week. In the same period, the largest positive changes occurred in Yorkshire and Regional towns, which saw increases of 8 and 6 percentage points, respectively.
In the week ending 14 October, the level of transactions at Pret stores was lowest in London city, at 84% of the weekly average level in January 2020. This is one of only two regions below 100% of their January 2020 level along with Scotland, which was at 90% of its January 2020 level.
Figure 6: Transactions at Pret A Manger stores in both London and regional stations rose 2 percentage points in the week to 14 October, to 90% and 92% of average January 2020 levels, respectively
Transactions in stores, index: 100 = January 2020 average, week ending 4 March 2021 to 14 October 2021, non-seasonally adjusted
Source: Pret A Manger
Download this chart Figure 6: Transactions at Pret A Manger stores in both London and regional stations rose 2 percentage points in the week to 14 October, to 90% and 92% of average January 2020 levels, respectively
Image .csv .xlsThe week ending 14 October 2021 saw the highest levels of transactions in both London airports and regional stations since the index began. Transactions in London stations in the same period matched the highest levels previously set in the week ending 30 September 2021.
Nôl i'r tabl cynnwys7. UK spending on debit and credit cards
Daily CHAPS-based indicator
These data series are experimental faster indicators for estimating UK spending on credit and debit cards. They track the daily CHAPS payments made by credit and debit card payment processors to around 100 major UK retail corporates. These payments are the proceeds of recent credit and debit card transactions made by customers at their stores, both via physical and via online platforms. More information on the indicator is provided in the accompanying methodology article.
Companies are allocated to one of four categories based on their primary business:
"staples" refers to companies that sell essential goods that households need to purchase, such as food and utilities
"work-related" refers to companies providing public transport or selling petrol
"delayable" refers to companies selling goods whose purchase could be delayed, such as clothing or furnishings
"social" refers to spending on travel and eating out
Figure 7: The aggregate CHAPS-based indicator of credit and debit card purchases decreased by 5 percentage points in the week to 14 October 2021 to 97% of its February 2020 average
Index February 2020 = 100, a backward looking seven-day rolling average, 13 January 2020 to 14 October 2021, non-seasonally adjusted, nominal prices
Source: Office for National Statistics, Bank of England
Notes:
- Users should note the daily payment data is the sum of card transactions processed up to the previous working day, so there is a slight time lag when compared with real-life events on the chart.
- The vertical lines indicate notable events and COVID-19 restriction changes.
- Percentage point difference is derived from current week and previous week index before rounding.
- Data for one sub-sector with 15% weight in the “social” spending category was imputed for the period of 12 August to 30 September 2021 because of data availability issues. These have now been resolved.
Download this chart Figure 7: The aggregate CHAPS-based indicator of credit and debit card purchases decreased by 5 percentage points in the week to 14 October 2021 to 97% of its February 2020 average
Image .csv .xlsFigure 7 shows changes in the value of CHAPS payments received by large UK corporates from their credit and debit card processors, "merchant acquirers".
In the week to 14 October 2021, the CHAPS-based indicator of credit and debit card purchases in aggregate decreased by 5 percentage points from the previous week to 97% of its February 2020 average level. All spending categories, excluding "social", which was broadly unchanged, decreased in this latest week:
- "delayable" decreased by 4 percentage points
- "staple" decreased by 10 percentage points
- "work related" decreased by 9 percentage points
In the latest week, "delayable'', and ''social spending" were below their February 2020 average level at 92% and 97% respectively. Conversely, "staple" and "work related" spending were above their February 2020 average level at 101% and 105% respectively.
Nôl i'r tabl cynnwys8. Business impacts and insights
Final data for Wave 41 (reference period 20 September to 3 October 2021) of the Business Insights and Conditions Survey (BICS) can be found in Business insights and impacts on the UK economy: 21 October 2021.
Almost one in six businesses (16%) intend to use increased homeworking as a permanent business model going forward, with the main reasons for this being improved staff wellbeing, reduced overheads and increased productivity.
Further information can also be found in the Business insights and impact on the UK economy dataset.
Nôl i'r tabl cynnwys9. Shipping
A changeover in the systems used to collect these data has introduced a level shift in the data time series from 14 June 2021 onwards. Users should not make comparisons between data before and after this date. The data produced prior to the change, for 1 April 2019 to 13 June 2021, can still be compared within that period.
A full methodological review of our current method of data collection is under way and data may be subject to revision once this is complete. We will continue to update the accompanying dataset using the current method until the review is complete.
Figure 8: There was an average of 290 daily ship visits in the week to 17 October 2021, broadly similar to the previous week at 294
Daily movements in shipping visits, UK, seasonally adjusted, 1 April 2019 to 17 October 2021
Source: exactEarth
Download this chart Figure 8: There was an average of 290 daily ship visits in the week to 17 October 2021, broadly similar to the previous week at 294
Image .csv .xls
Figure 9: There was an average of 94 daily cargo ship visits in the week to 17 October 2021, which was unchanged the previous week
Daily movements in cargo shipping visits, UK, seasonally adjusted, 1 April 2019 to 17 October 2021
Source: exactEarth
Notes:
- The vertical line indicates the date when the data collection system changed. Users should not compare data before and after this date.
- See the accompanying dataset for notable dates and weather events.
- In the coming weeks, we will continue to review the seasonally adjusted estimates of shipping indicators data following its reintroduction with the discontinuity.
Download this chart Figure 9: There was an average of 94 daily cargo ship visits in the week to 17 October 2021, which was unchanged the previous week
Image .csv .xls10. Road traffic in Great Britain
According to Department for Transport (DfT) non-seasonally adjusted road traffic data, the volume of all motor vehicle traffic on Monday 18 October 2021 decreased by 2 percentage points from the previous week to 96% of the level seen on the Monday of the first week in February 2020.
Compared with the previous week (Monday 11 October 2021), traffic volume for cars decreased by 3 percentage points to 91% of the level seen in the first week of February 2020. Light commercial vehicles and heavy goods vehicles traffic remained broadly unchanged when compared with the previous week, at 110% and 109%, respectively.
Figure 10: The volume of motor vehicle traffic on Monday 18 October 2021 was at 96% of its level in the first week of February 2020
Daily road traffic index: 100 = same traffic as the equivalent day of the week in the first week of February 2020, 1 March 2020 to 18 October, non-seasonally adjusted
Embed code
Download the data
The daily DfT estimates are indexed to the first week of February 2020 and the comparison is with the same day of the week. The data provided are useful as an indication of traffic change rather than actual traffic volumes. More information on the methods, quality and economic analysis for these indicators can be found in the DfT methodology article.
Nôl i'r tabl cynnwys11. Retail footfall
National footfall figures are supplied by Springboard, a provider of data on customer activity. They measure the following for overall UK retail footfall, as well as by high street, retail park, and shopping centre categories:
daily retail footfall as a percentage of its level on the same day of the equivalent week of 2019; for example, Saturday 16 October 2021 is compared with Saturday 19 October 2019
total weekly retail footfall as a percentage of its level in the equivalent week of 2019
the percentage change in weekly footfall compared with the previous week; for example, Week 41 of 2021 is compared with Week 40 of 2021
Springboard's weekly data are defined over a seven-day period running from Sunday to Saturday. Week 41 of 2021 therefore refers to the period Sunday 10 October to Saturday 16 October 2021.
Users should note that all quoted figures have been rounded to the nearest integer.
Figure 11: Overall retail footfall in the UK fell slightly by 1% in the week to 16 October 2021, and was 86% of the level seen in the equivalent week of 2019
Volume of overall daily retail footfall, percentage compared with the equivalent day of the equivalent week of 2019, 1 March 2020 to 16 October 2021

Source: Springboard, The Department for Business, Energy and Industrial Strategy
Notes:
- The vertical lines indicate notable events and coronavirus (COVID-19) restriction changes.
- Users should note that week-on-week changes in retail footfall volumes are outlined as percentages, rather than as percentage point changes. Percentage change figures quoted in the commentary will therefore not necessarily match the percentage point changes observed in the chart.
Download this image Figure 11: Overall retail footfall in the UK fell slightly by 1% in the week to 16 October 2021, and was 86% of the level seen in the equivalent week of 2019
.png (133.6 kB)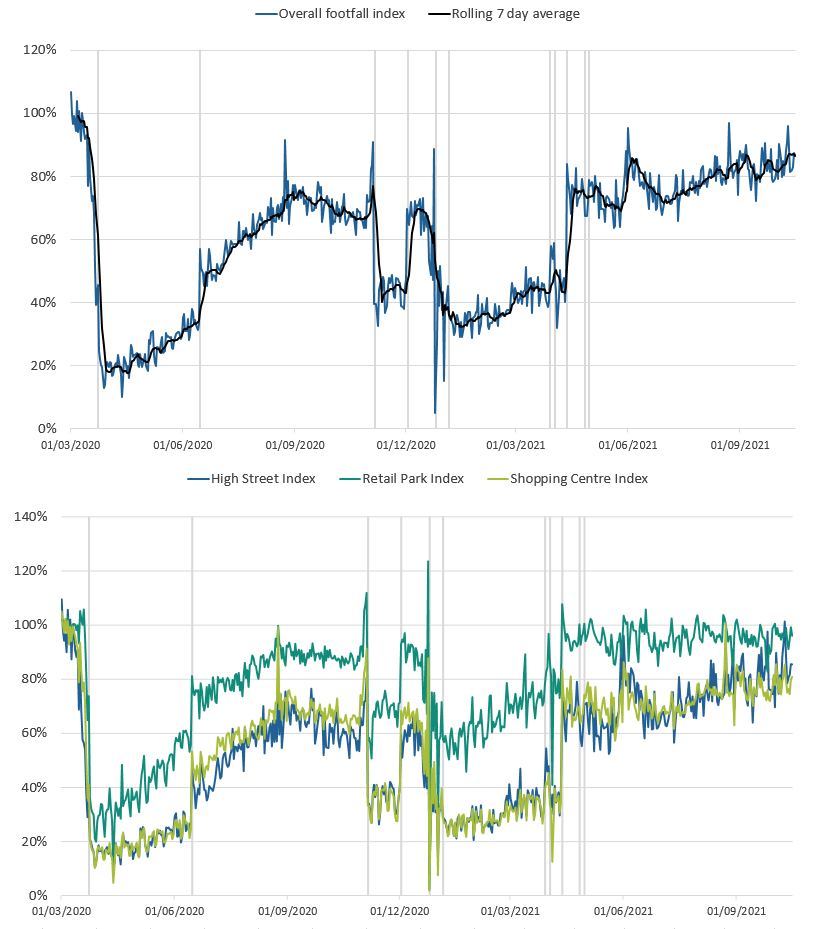
According to Springboard, in the week to 16 October 2021, the volume of overall retail footfall in the UK:
for high streets remained unchanged from the previous week and was 85% of the level seen in the equivalent week of 2019
for retail parks fell slightly by 1% from the previous week and was 97% of the level seen in the equivalent week of 2019
for shopping centres decreased by 2% from the previous week and was 79% of the level seen in the equivalent week of 2019
Regional retail footfall
Figure 12: The South West of England had the highest retail footfall relative to pre-pandemic levels in the week to 16 October 2021, at 93% of the level in the same week of 2019
Volume of daily retail footfall, percentage of the level recorded on the same day of the equivalent week of 2019, seven-day rolling average, UK countries and English regions, 1 March 2020 to 16 October 2021
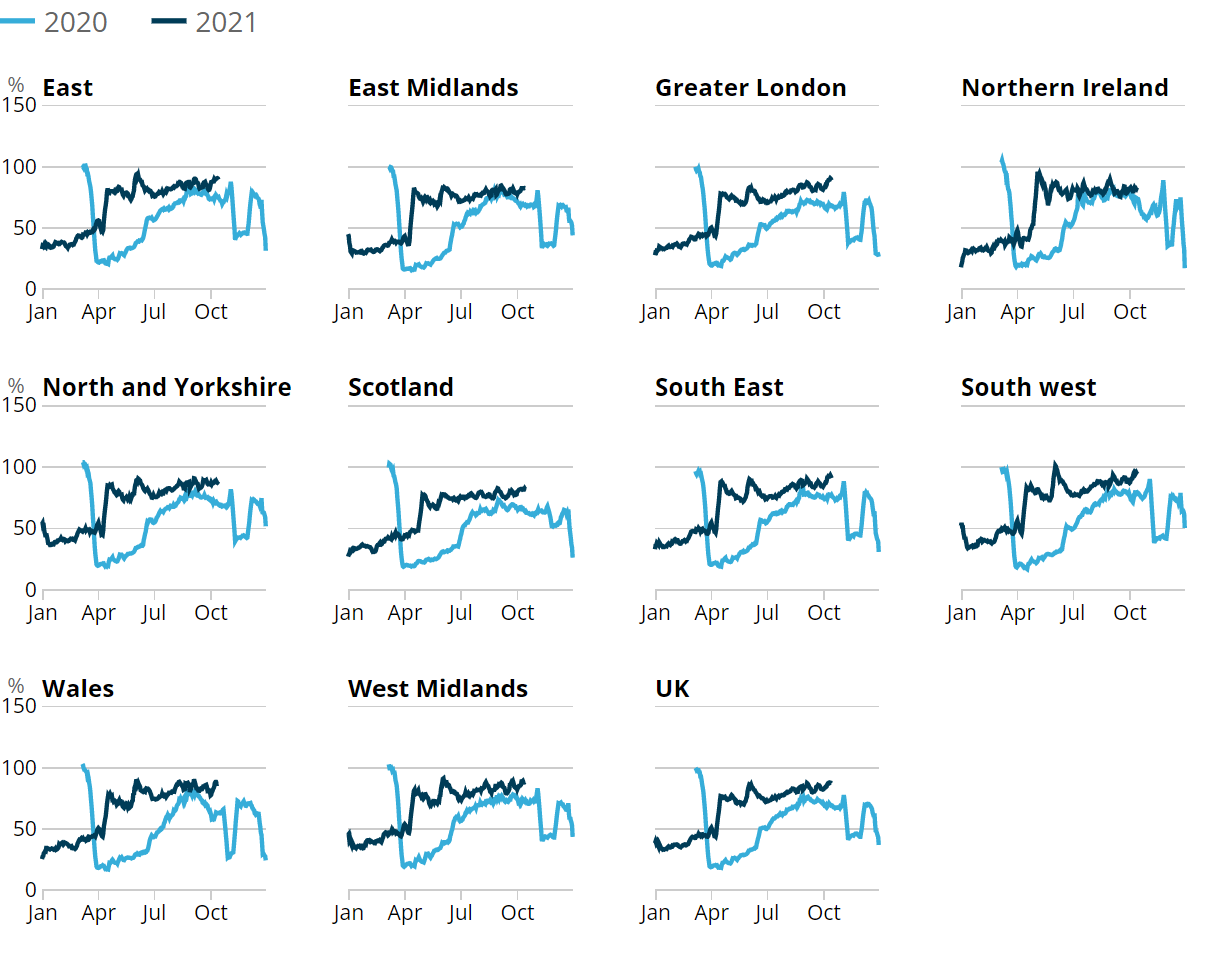
Source: Springboard, The Department for Business, Energy and Industrial Strategy
Download this image Figure 12: The South West of England had the highest retail footfall relative to pre-pandemic levels in the week to 16 October 2021, at 93% of the level in the same week of 2019
.png (92.0 kB)
In the week to 16 October 2021, retail footfall saw a week-on-week fall in 7 out of the 10 UK countries and English regions, the largest occurring in the East, the East Midlands and the South East, which all fell by 2%, when compared with the previous week. The largest week-on-week increase was in Scotland where footfall rose by 4%, partially driven by a 7% increase in high street footfall.
In the same week, relative to the levels seen in the equivalent week of 2019, retail footfall was strongest in the South West at 93% followed by the South East at 90%. In contrast, retail footfall was weakest in Northern Ireland, the East Midlands and Scotland at 81%, 82% and 82%, respectively.
Nôl i'r tabl cynnwys12. OpenTable seated diners
Figure 13: The seven-day average estimate of UK seated diners in the week to 18 October 2021 was broadly unchanged from the previous week, at 119% of the level in the equivalent week of 2019
Seated diners, seven-day average, percentage compared with the equivalent week of 2019, week ending 24 February 2020 to week ending 18 October 2021, UK, London and Manchester
Source: OpenTable
Notes:
- Please note that data for Manchester are only available from week ending 16 November 2020.
Download this chart Figure 13: The seven-day average estimate of UK seated diners in the week to 18 October 2021 was broadly unchanged from the previous week, at 119% of the level in the equivalent week of 2019
Image .csv .xls13. Data
UK spending on credit and debit cards
Dataset | Released 21 October 2021
Experimental indicator for monitoring UK retail purchases derived from the Bank of England's CHAPS data.
Weekly shipping indicators
Dataset | Released 21 October 2021
Experimental weekly and daily ship visits dataset covering UK ports.
Traffic camera activity
Dataset | Released 21 October 2021
Experimental daily traffic camera counts data for busyness indices covering the UK.
Online job advert estimates
Dataset | Released 21 October 2021
Experimental job advert indices covering the UK online job market.
Company incorporations, voluntary dissolutions and compulsory dissolutions
Dataset | Released 21 October 2021
The number of weekly Companies House incorporations, compulsory dissolutions and voluntary dissolution applications accepted.
Daily UK flights
Dataset | Released 21 October 2021
Experimental daily UK flight numbers and rolling seven-day average, including flights to, from, and within the UK.
System Average Price (SAP) of gas
Dataset | Released 21 October 2021
Daily and rolling average System Average Price (SAP) of gas traded in the UK.
14. Glossary
Faster indicator
A faster indicator provides insights into economic activity using close-to-real-time big data, administrative data sources, rapid response surveys or Experimental Statistics, which represent useful economic and social concepts.
Company incorporations
Incorporations are when a company is added to the Companies House register of limited companies. This can also include where an existing business applies to become a limited company, where it was not one before.
Voluntary dissolution applications
A voluntary dissolution application is when a company applies to begin dissolution proceedings. As such, they effectively choose to be removed from the Companies House register. For a company to be eligible to voluntarily dissolve, it should not have completed any trading activity for a period of three months.
Compulsory dissolutions
When a company fails to file the required financial accounts and/or confirmation statements, if no contact is received by Companies House following a series of letters to the company and its officers, a first gazette notice is published in the Gazette, a notice of the Registrar's intention to dissolve the company.
Nôl i'r tabl cynnwys15. Measuring the data
UK coronavirus restrictions
A full overview of coronavirus (COVID-19) restrictions for each of the four UK constituent countries can be found here:
These restrictions should be considered when interpreting the data featured throughout this bulletin.
Pret A Manger index
The index shows total weekly till transactions at Pret A Manger stores as a proportion of the company's average weekly level in the first four weeks of 2020 (between 3 January 2020 and 30 January 2020).
These data are delivered weekly from Friday to Thursday in a week-ending format.
The index is broken down by region:
Yorkshire
London: Suburban (stores within Greater London but outside zones 1 and 2)
London: City (Key Office Areas)
London: West End (Key Retail Areas)
London: Airports (4 Major Airports in London)
London: Stations (3 Large Train Stations in London)
Manchester
Scotland
Regional towns (stores in towns not included in this index)
Regional stations (stores in stations in towns not included in this index)
These regions have been selected as in some areas of the UK, there are limited numbers of Pret A Manger stores. For example, at the time of index creation, there were two stores open in Leeds and two in York, leading to these being grouped together as "Yorkshire".
Wales is omitted from the index as it has only one store, and regional towns includes shops in towns other than those listed.
Nôl i'r tabl cynnwys16. Strengths and limitations
Information on the strengths and limitations of the indicators in this bulletin is available in the Coronavirus and the latest indicators of the UK economy and society methodology.
Nôl i'r tabl cynnwys
6. Social impact of coronavirus
This section includes some provisional results from the Opinions and Lifestyle Survey (OPN) covering the period 6 to 17 October 2021. The survey went out to 5,901 adults in Great Britain and had a response rate of 68% (4,004 responses). Further information to help understand the impact of the coronavirus (COVID-19) pandemic on people, households and communities in Great Britain will be available in Coronavirus and the social impacts on Great Britain, due to be published on 22 October 2021.
Travelling to work
In the period 6 to 17 October 2021, the proportion of working adults in Great Britain who in the past seven days:
travelled to work (both exclusively and in combination with working from home) increased by 3 percentage points from the previous period (22 September to 3 October 2021) to 70%
worked exclusively from home remained broadly similar (15% in the latest period, 16% in the previous period)
neither travelled to work nor worked from home decreased by 2 percentage points (15% in this period, 17% in the previous period)
Shopping
Of the 96% of adults in Great Britain who reported leaving home in the past seven days, the proportion that did so to shop for food and medicine was broadly similar to the previous period at 81%.
The proportion of these adults who shopped for things other than food and medicine in the past seven days decreased by 2 percentage points from the previous period to 42%.
Face coverings
Of the 96% of adults in Great Britain who reported leaving home in the past seven days, the proportion that did so and reported wearing a face covering decreased by 4 percentage points from the previous period to 82%.
Further breakdowns such as the situation when a face covering was worn (for example, while shopping) and by country, will be available in Coronavirus and the social impacts on Great Britain, due to be published on 22 October 2021.
Nôl i'r tabl cynnwys