Cynnwys
- Main Points
- Latest indicators at a glance
- Shipping
- UK spending on debit and credit cards
- Business impacts and insights
- Online job adverts
- UK flight data
- Retail footfall
- OpenTable seated diners
- Social impact of coronavirus
- Road traffic in Great Britain
- Data
- Glossary
- Measuring the data
- Strengths and limitations
- Related links
1. Main Points
There was an average of 307 daily ship visits in the week to 15 August 2021, an increase from 291 in the previous week (exactEarth). Section 3.
In the week to 12 August 2021, the aggregate CHAPS-based indicator of credit and debit card purchases decreased by 5 percentage points from the previous week, to 94% of its February 2020 average (Bank of England CHAPS data). Section 4.
In early August 2021, 84% of all UK businesses reported that they do not expect redundancies in the next three months, up from a series low of 73% in early February 2021 (initial results from Wave 37 of the Business Insights and Conditions Survey (BICS)). Section 5.
On 13 August 2021, numbers of online job adverts remained higher than their February 2020 average levels across all UK countries and English regions (Adzuna). Section 6.
In the week ending 15 August 2021, the seven-day average number of UK daily flights was 3,142, broadly similar to the previous week (3,111) (EUROCONTROL). Section 7.
In the week to 14 August 2021, overall retail footfall in the UK increased by 2% and was at 82% of the level seen in the equivalent week of 2019 (Springboard). Section 8.
In the week to 16 August 2021, the seven-day average estimate of UK seated diners increased by 5 percentage points from the previous week to 133% of the level in the equivalent week of 2019 (OpenTable). Section 9.
89% of adults who left their home wore a face covering in the latest week, which was broadly similar to the previous week (Opinions and Lifestyle Survey, 11 to 15 August 2021). Section 10.
The volume of all motor vehicle traffic on Monday 16 August 2021 was again at the level seen in the first week of February 2020; this is broadly similar to the previous five weeks (Department for Transport). Section 11.
There were 13,173 company incorporations in the week to 13 August 2021; this was broadly unchanged for the third consecutive week but was 6% higher than the equivalent week of 2019 (12,375) (Companies House). See the accompanying dataset.
- There were 5,865 voluntary dissolution applications in the week to 13 August 2021; this is a 7% increase from the previous week (5,480) and 25% higher than the equivalent week of 2019 (4,707) (Companies House). See the accompanying dataset.
In the week to 15 August 2021, the seasonally adjusted average count of traffic camera activity for "cars" in Greater Manchester saw a 15% increase in comparison to the previous week. (Transport for Greater Manchester). See the accompanying dataset.
Results presented in this bulletin are experimental and may be subject to revision.
2. Latest indicators at a glance
Embed code
3. Shipping
We are re-introducing the shipping data last released in the bulletin published on 17 June 2021. A changeover in the systems used to collect these data has introduced a level shift in the time series from 14 June 2021 onwards and users should not make comparisons between data before and after this date. However, we feel that re-introducing the publication of these data will assist users in understanding the latest shipping movements. The data produced prior to the change, for 1 April 2019 to 13 June 2021, can still be compared within that period.
A full methodological review of our current method of data collection is underway and data may be subject to revision once this is complete. The accompanying dataset has been updated back to 14 June 2021 and will continue to be updated using the current method until the review is complete.
Figure 1: There was an average of 307 daily ship visits in the week to 15 August 2021, an increase from 291 in the previous week
Daily movements in shipping visits, UK, seasonally adjusted, 1 December 2019 to 15 August 2021
Source: exactEarth
Notes:
The vertical line indicates the date when the data collection system changed. Users should not compare data before and after this date.
See the accompanying dataset for notable dates and weather events.
In the coming weeks, we will continue to review the seasonal adjusted estimates of shipping indicators data following its reintroduction with the discontinuity.
Download this chart Figure 1: There was an average of 307 daily ship visits in the week to 15 August 2021, an increase from 291 in the previous week
Image .csv .xlsThe seasonally adjusted average number of daily ships visits has remained relatively stable throughout late June and July and into August 2021, at around 300 visits per day.
Figure 2: The average number of daily cargo ships visits increased by 11 in the week to 15 August 2021, to 94 visits
Daily movements in cargo shipping visits, UK, seasonally adjusted, 1 December 2019 to 15 August 2021
Source: exactEarth
Notes:
The vertical line indicates the date when the data collection system changed. Users should not compare data before and after this date.
See the accompanying dataset for notable dates and weather events.
In the coming weeks, we will continue to review the seasonal adjusted estimates of shipping indicators data following its reintroduction with the discontinuity.
Download this chart Figure 2: The average number of daily cargo ships visits increased by 11 in the week to 15 August 2021, to 94 visits
Image .csv .xlsSimilar to total ships visits, seasonally adjusted daily cargo ship visits showed little change throughout late June and July and into August 2021, at around 90 visits per day.
More about economy, business and jobs
- All ONS analysis, summarised in our economy, business and jobs roundup.
- Explore the latest trends in employment, prices and trade in our economic dashboard.
- View all economic data.
4. UK spending on debit and credit cards
Daily CHAPS-based indicator
These data series are experimental faster indicators for estimating UK spending on credit and debit cards. They track the daily CHAPS payments made by credit and debit card payment processors to around 100 major UK retail corporates. These payments are the proceeds of recent credit and debit card transactions made by customers at their stores, both via physical and via online platforms. More information on the indicator is provided in the accompanying methodology article.
Companies are allocated to one of four categories based on their primary business:
"staples" refers to companies that sell essential goods that households need to purchase, such as food and utilities
"work-related" refers to companies providing public transport or selling petrol
"delayable" refers to companies selling goods whose purchase could be delayed, such as clothing or furnishings
"social" refers to spending on travel and eating out
Figure 3: In the week to 12 August 2021, the aggregate CHAPS-based indicator of credit and debit card purchases fell by 5 percentage points from the previous week to 94% of its February 2020 average
A backward looking seven-day rolling average, 13 January 2020 to 12 August 2021, non-seasonally adjusted, nominal prices
Source: Office for National Statistics and Bank of England calculations
Notes:
Users should note the daily payment data is the sum of card transactions processed up to the previous working day, so there is a slight time lag when compared with real-life events on the chart.
The vertical lines indicate key events. In order, the events are: first national lockdown begins; some non-essential shops allowed to reopen; regional restrictions begin in England; Christmas period; lockdowns announced in England and Scotland; reopening of non-essential shops, and outdoor pubs and restaurants in England; further easing of lockdown restrictions, including re-opening of indoor pubs and restaurants in England; most legal restrictions to control COVID-19 lifted in England.
Percentage point difference is derived from current week and previous week index before rounding.
Download this chart Figure 3: In the week to 12 August 2021, the aggregate CHAPS-based indicator of credit and debit card purchases fell by 5 percentage points from the previous week to 94% of its February 2020 average
Image .csv .xlsFigure 3 shows changes in the value of CHAPS payments received by large UK corporates from their credit and debit card processors, "merchant acquirers".
In the week to 12 August 2021, the CHAPS-based indicator of credit and debit card purchases in aggregate decreased by 5 percentage points from the previous week to 94% of its February 2020 average level. This was driven by decreases in all spending categories; "social" and "staple" both fell by 7 percentage points, "work-related" fell by 4 percentage points and "delayable" fell by 3 percentage points.
In the latest week, "work-related" and "staple" spending remained above their February 2020 average levels, at 112% and 101%, respectively. Conversely, "social" and "delayable" spending were at 88% and 89% of their February 2020 average levels.
Nôl i'r tabl cynnwys5. Business impacts and insights
Initial results from Wave 37 of the Business Insights and Conditions Survey (BICS) cover the reference period 26 July to 8 August 2021, with a response rate of 19.9% (7,645 responses). The survey was live for the period 9 to 17 August 2021.
Please note, as part of our regular and ongoing quality assessment of our methods, we will be introducing improved methods used to weight smaller businesses within the BICS sample where we use employment and turnover to do so. We plan to introduce these new methods in the publication of 26 August 2021. This may lead to some revisions in estimates.
Figure 4: In the latest wave, 84% of all UK businesses reported they do not expect redundancies in the next three months, up from a low of 73% in Wave 23 (25 January to 7 February 2021)
Percentage of businesses not permanently stopped trading, weighted by count, UK, 14 December 2020 to 17 August 2021
Source: Office for National Statistics – Business Insights and Conditions Survey (BICS)
Notes:
Initial weighted results, Wave 37 of Office for National Statistics' (ONS') Business Insights and Conditions Survey (BICS).
A detailed description of the weighting methodology and the weights used for each variable is available in Business Insights and Conditions Survey (BICS).
Data are plotted in the middle of the two-week period of each wave.
Download this chart Figure 4: In the latest wave, 84% of all UK businesses reported they do not expect redundancies in the next three months, up from a low of 73% in Wave 23 (25 January to 7 February 2021)
Image .csv .xls
| All Industries | |
|---|---|
| Turnover has increased by more than 50% | <1% |
| Turnover has increased between 20% and 50% | 3% |
| Turnover has increased by up to 20% | 9% |
| Turnover has not been affected | 50% |
| Turnover has decreased by up to 20% | 15% |
| Turnover has decreased between 20% and 50% | 9% |
| Turnover has decreased by more than 50% | 4% |
| Not sure | 10% |
Download this table Table 1: In Wave 37 a net 15% of businesses reported a decrease in turnover, compared with normal expectations for this time of year
.xls .csv6. Online job adverts
Job adverts by category
These figures are experimental estimates of online job adverts provided by Adzuna, an online job search engine, by category, by UK country and English region. The number of job adverts over time is an indicator of the demand for labour. The Adzuna categories used do not correspond to Standard Industrial Classification (SIC) categories, so these values are not directly comparable with the Office for National Statistics' (ONS) Vacancy Survey.
Figure 5: On 13 August 2021, the total volume of online job adverts was broadly similar to the previous week at 128% of its February 2020 average level
Volume of online job adverts by category, index: 100 = February 2020 average, 4 January 2019 to 13 August 2021, non-seasonally adjusted
Embed code
Notes:
Further category breakdowns are included in the online job advert estimates dataset and more details on the methodology can be found in Using Adzuna data to derive an indicator of weekly vacancies.
Users should note that week-on-week changes in online job advert volumes are outlined as percentages, rather than as percentage point changes. Percentage change figures quoted in the commentary will therefore not necessarily match the percentage point changes observed in the charts and accompanying dataset.
Download this chart
According to Adzuna, on 13 August 2021, the total volume of online job adverts in the UK was broadly similar to the previous week (6 August 2021).
Of the 28 categories, 14 saw a weekly decrease in the number of online job adverts, 7 were unchanged, while the remaining 7 increased when compared with the previous week. The largest weekly decreases were in "charity/voluntary" and "education" which both fell by 7%. The total volume of online job adverts has fallen by 12% in the "education" category since the week ending 23 July 2021. The largest weekly increase was in "domestic help" which rose by 4%.
The total volume of online job adverts remained substantially above pre-coronavirus (COVID-19) pandemic volume, at 128% of its February 2020 average level. The "transport/logistics/warehouse" category remains the category with the highest level of job adverts relative to its pre-pandemic level, at 335% of its February 2020 average level.
There are only six categories that are below pre-pandemic levels. The lowest of these are "legal" and "energy/oil and gas" which are 73% and 82% of their February 2020 average level, respectively.
Job adverts by region
Figure 6: On 13 August 2021, numbers of online job adverts remained higher than their February 2020 average levels across all UK countries and English regions
Volume of online job adverts by UK countries and English regions, index: 100 = February 2020 average, 7 February 2020 to 13 August 2021, non-seasonally adjusted
Embed code
Download this chart
On 13 August 2021, the volume of online job adverts had decreased or remained the same across nearly all UK countries and English regions when compared with the previous week (6 August 2021). The exceptions being in Northern Ireland and North East England where they rose by 4% and 2% respectively.
In the latest week, volumes of online job adverts remained above their February 2020 average levels in all UK countries and English regions. The highest of these were in North East England, Northern Ireland and East Midlands at 181%, 161% and 160% of their February 2020 average levels, respectively. The North East has been the region with the highest number of online job adverts relative to its pre-pandemic levels since 9 April 2021.
Meanwhile, relative to February 2020 average levels, the volume of online job adverts on 13 August 2021 remained lowest in London, where the corresponding figure was 104%, unchanged from last week.
Nôl i'r tabl cynnwys7. UK flight data
These data are daily flight figures from the European Organisation for the Safety of Air Navigation (EUROCONTROL). Daily flight numbers for the UK alongside other countries are available in EUROCONTROL's dashboard. EUROCONTROL is a pan-European, civil-military organisation dedicated to supporting European aviation. Its Aviation Intelligence and Performance Review Unit provides independent collection and validation of air navigation services performance-related data and intelligence gathering.
These flights data include international arrivals and departures to and from the UK (including Crown Dependencies) and domestic UK flights, but exclude overflights (flights that pass over UK territory). They capture all flight movements that operate under Instrumental Flight Rules (IFR), where the pilot uses instruments in the flight deck to control, guide and adjust the plane. This includes commercial flights carrying passengers and cargo as well as non-commercial flights such as private and military flights.
Data from EUROCONTROL do not include information on the volume of passengers or cargo carried on UK flights. Especially in the context of the coronavirus (COVID-19) pandemic, flights might not be operating at full capacity and therefore trends in passengers and cargo will differ from trends in flights presented here.
Figure 7: In the week ending 15 August 2021, the seven-day average number of UK daily flights was 3,142, broadly similar to the previous week (3,111)
Number of daily flights, non-seasonally adjusted, and seven-day moving average, 2 January 2019 to 15 August 2021, UK
Source: European Organisation for the Safety of Air Navigation (EUROCONTROL)
Notes:
The fall in February 2020 coincides with Storm Ciara.
The falls in December and January coincide with Christmas Eve, Christmas Day, New Year’s Eve and New Year’s Day.
Download this chart Figure 7: In the week ending 15 August 2021, the seven-day average number of UK daily flights was 3,142, broadly similar to the previous week (3,111)
Image .csv .xlsIn the week ending 15 August 2021, the seven-day average number of UK daily flights was 3,142, broadly similar to the previous week (3,111). It is, however, the highest weekly average number of UK flights seen since the week ending 22 March 2020 (the day before the first national lockdown was implemented in the UK).
The seven-day average number of UK daily flights has now increased by 120% from the week ending 23 May 2021, the week that international travel was allowed to restart and the UK government implemented the travel traffic light system (17 May 2021).
The average number of UK daily flights in the latest week was at 48% of the level seen in the equivalent week of 2019, broadly unchanged from the previous week. In the latest week, compared with the equivalent week of 2020 (when UK travel corridors were still in place), the seven-day average number of daily flights was at 115% of its 2020 level.
The full data time series available for UK flights can be found in the accompanying dataset, which contains daily flight numbers and the rolling seven-day averages.
Nôl i'r tabl cynnwys8. Retail footfall
National retail footfall
National footfall figures are supplied by Springboard, a provider of data on customer activity. They measure the following for overall UK retail footfall, as well as by high street, retail park, and shopping centre categories:
- daily retail footfall as a percentage of its level on the same day of the equivalent week of 2019; for example, Saturday 14 August 2021 is compared with Saturday 10 August 2019
- total weekly retail footfall as a percentage of its level in the equivalent week of 2019
- the percentage change in weekly footfall compared with the previous week; for example, Week 32 of 2021 is compared with Week 31 of 2021
- Springboard's weekly data are defined over a seven-day period running from Sunday to Saturday; Week 32 of 2021 therefore refers to the period Sunday 8 August to Saturday 14 August 2021
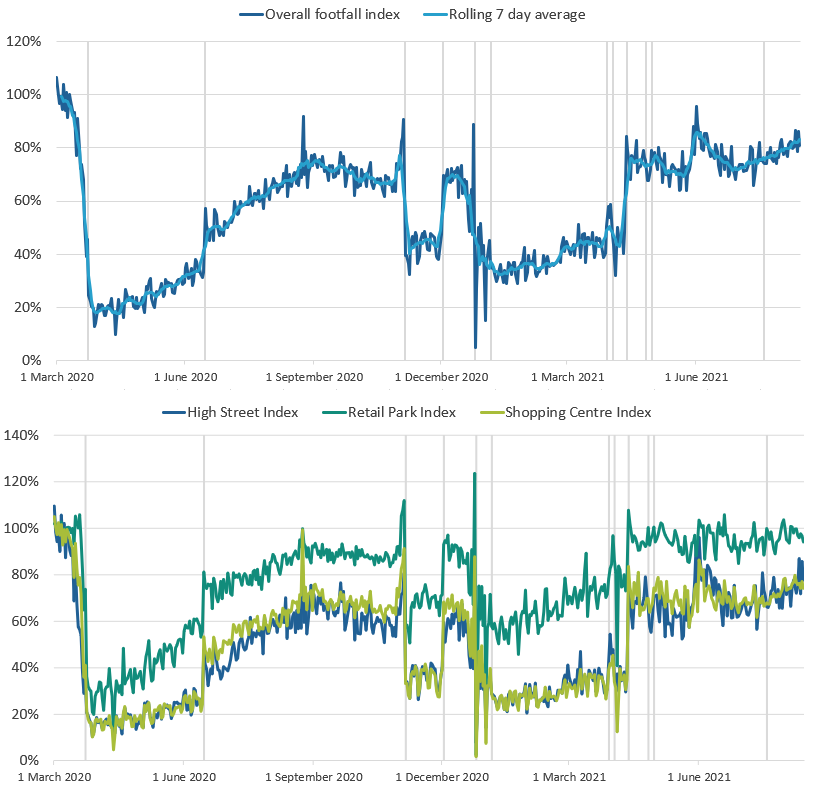
Figure 8: UK retail footfall levels were at 82% of the equivalent week of 2019 in the week to 14 August 2021; the highest comparable level since the week to 12 June 2021
Volume of overall daily retail footfall, percentage compared with the equivalent day of the equivalent week of 2019, 1 March 2020 to 14 August 2021
Source: Springboard and the Department for Business, Energy and Industrial Strategy
Notes:
The vertical lines indicate notable events. In order, the events are: first national lockdowns begin; restrictions begin to ease across the UK; circuit-breaker lockdown in England; circuit breaker replaced with regional restrictions; Christmas; lockdown begins in England; "stay at home" rule ends in England; Easter; reopening of non-essential retail in England and Wales; reopening of non-essential retail in Scotland; reopening of non-essential retail in Northern Ireland; most legal restrictions to control COVID-19 lifted in England.
Users should note that week-on-week changes in retail footfall volumes are outlined as percentages, rather than as percentage point changes. Percentage change figures quoted in the commentary will therefore not necessarily match the percentage point changes observed in the chart.
Download this image Figure 8: UK retail footfall levels were at 82% of the equivalent week of 2019 in the week to 14 August 2021; the highest comparable level since the week to 12 June 2021
.png (136.3 kB)
According to Springboard, in the week to 14 August 2021, the volume of overall retail footfall in the UK increased slightly by 2% from the previous week (week to 7 August 2021). This continues the gradual upward trend since the lifting of most legal restrictions in England on 19 July 2021 and is the sixth consecutive weekly rise in overall retail.
The latest week's increase was driven by a week-on-week rise of 3% in footfall on high streets. In comparison, footfall at both shopping centres and retail parks was broadly unchanged compared with the previous week.
In the latest week to 14 August 2021, overall retail footfall was at 82% of the level seen in the equivalent week of 2019. Comparing retail locations, footfall at retail parks remained the strongest relative to pre-coronavirus (COVID-19) pandemic levels, at 98% of its equivalent 2019 level. Meanwhile, the corresponding figures for high streets and shopping centres were 78% and 76%, respectively. Throughout most of the pandemic, footfall at retail parks has consistently been strongest when compared with other retail locations, relative to their 2019 levels.
Regional retail footfall
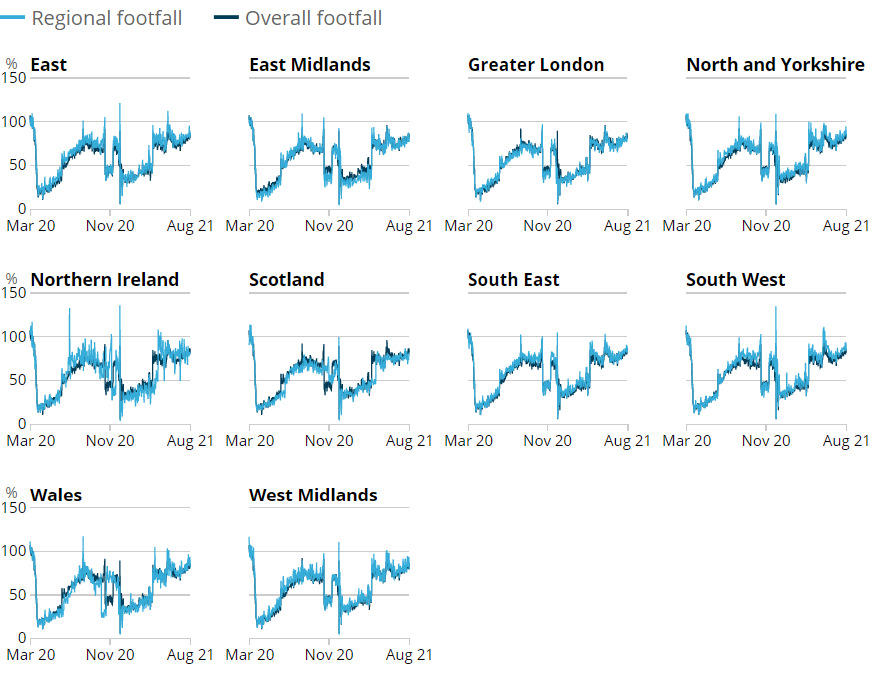
Figure 9: The South West continued to be the region with the highest retail footfall relative to pre-pandemic levels in the week to 14 August 2021, 88% of the level in the same week of 2019
Volume of daily retail footfall, percentage of the level recorded on the same day of the equivalent week of 2019, UK countries and English regions, 1 March 2020 to 14 August 2021
Source: Springboard and the Department for Business, Energy and Industrial Strategy
Download this image Figure 9: The South West continued to be the region with the highest retail footfall relative to pre-pandemic levels in the week to 14 August 2021, 88% of the level in the same week of 2019
.png (78.6 kB)
According to Springboard, in the week to 14 August 2021, retail footfall saw week-on-week percentage increases in 4 of the 10 UK countries and English regions, the largest of which were in Northern Ireland and Wales, which saw rises of 4% and 3% respectively over the week. The remaining 6 of the 10 countries and English regions remained broadly unchanged from the previous week.
In the same week, relative to the levels seen in the equivalent week of 2019, retail footfall continued to be strongest in the South West of England at 88%, followed by the North and Yorkshire, and Wales both at 87%. In contrast, retail footfall was weakest in Scotland at 77% of the level seen in the equivalent week of 2019, followed by Greater London and Northern Ireland, both of which were at 80%.
Nôl i'r tabl cynnwys9. OpenTable seated diners
OpenTable is a provider of data for online restaurant reservations, with daily data for the UK, London and Manchester being publicly available in its The state of the industry dashboard. These data show the impact of recent events and restrictions on the hospitality industry using a sample of restaurants on the OpenTable network across all channels, that is, online reservations, phone reservations and walk-ins.
Figure 10: The seven-day average estimate of UK seated diners increased by 5 percentage points in the week to 16 August 2021, to 133% of the level in the equivalent week of 2019
Seated diners, seven-day average, percentage compared with the equivalent week of 2019, week ending 24 February 2020 to week ending 16 August 2021, UK, London and Manchester
Source: OpenTable
Notes:
Data show the percentage of seated diners when compared with the same week in 2019. For example, Week 32 2021 is compared with Week 32 2019 .
Please note that data for Manchester are only available from week ending 16 November 2020.
Download this chart Figure 10: The seven-day average estimate of UK seated diners increased by 5 percentage points in the week to 16 August 2021, to 133% of the level in the equivalent week of 2019
Image .csv .xlsAccording to OpenTable, in the week to 16 August 2021, the seven-day average estimate of UK seated diners increased by 5 percentage points, when compared with the previous week, to 133% of its level in the equivalent week of 2019. This continues the broadly upward trend in recent weeks following the lifting of most legal restrictions in England on 19 July 2021, after which the seven-day average estimate of UK seated diners has increased by 17 percentage points.
In the latest week, the seven-day average estimate of seated diners in Manchester substantially increased by 11 percentage points to 143% of the level seen in the equivalent week of 2019. During the same period, the equivalent figure for London was 81%, an increase of 5 percentage points from the previous week. Both of these areas have seen notable increases since the 19 July 2021, after the easing of most lockdown restrictions in England. Over this period, Manchester has seen a substantial increase of 41 percentage points, whereas London has seen an increase of 12 percentage points.
The UK seven-day average estimate of seated diners has remained above the level seen in the equivalent week of 2019 since the week ending 17 May 2021 (following the reopening of indoor hospitality in England on 17 May 2021). Since the week ending 26 April 2021 to the latest week, seated diner estimates in Manchester have consistently remained above the level seen in the equivalent week of 2019. Over the same period in London, however, this has only occurred on one occasion, which was during the week to 31 May 2021, a week that included the second May bank holiday.
Nôl i'r tabl cynnwys11. Road traffic in Great Britain
According to Department for Transport (DfT) non-seasonally adjusted road traffic data, the volume of all motor vehicle traffic on Monday 16 August 2021 was at 99% of the level seen on the Monday of the first week in February 2020, broadly similar to the previous five weeks.
Compared with the previous week (Monday 9 August 2021), traffic volume was broadly similar for light commercial vehicle, heavy goods vehicle and car vehicle traffic, at 109%, 104% and 96% of the level seen in the first week of February 2020, respectively.
Figure 11: The volume of motor vehicle traffic on Monday 16 August 2021 was at 99% of its level in the first week of February 2020
Daily road traffic index: 100 = same traffic as the equivalent day of the week in the first week of February 2020, 1 March 2020 to 16 August 2021, non-seasonally adjusted
Embed code
Notes:
The blue shaded areas refer to periods when restrictions across the UK were in effect. In order, these were: first national lockdown in the UK (23 March 2020) to easing of restrictions with non-essential shops reopening in England (15 June 2020); second lockdown in England (5 November 2020) to lockdown being replaced with three-tier system in England (2 December 2020); third lockdown announced in Scotland and England (4 January 2021) to "stay at home" restrictions ending in England (29 March 2021).
Road traffic data for Thursday 12 August are not available at time of publishing, because of missing data in the underlying dataset.
Download this chart
The daily DfT estimates are indexed to the first week of February 2020 and the comparison is with the same day of the week. The data provided are useful as an indication of traffic change rather than actual traffic volumes. More information on the methods, quality and economic analysis for these indicators can be found in the DfT methodology article.
Nôl i'r tabl cynnwys12. Data
UK spending on credit and debit cards
Dataset | Released 19 August 2021
Experimental indicator for monitoring UK retail purchases derived from the Bank of England's CHAPS data.
Shipping indicators
Dataset | Released 19 August 2021
Experimental weekly and daily ship visits dataset covering UK ports.
Traffic camera activity
Dataset | Released 19 August 2021
Experimental daily traffic camera counts data for busyness indices covering the UK.
Online job advert estimates
Dataset | Released 19 August 2021
Experimental job advert indices covering the UK online job market.
Company Incorporations and Voluntary Dissolutions
Dataset | Released 19 August 2021
The number of weekly Companies House Incorporations and Voluntary Dissolution applications accepted.
Daily UK flights
Dataset | Released 19 August 2021
Experimental daily UK flight numbers and rolling seven-day average, including flights to, from, and within the UK.
Online weekly price changes
Dataset | Released 1 July 2021
Experimental estimates of online price changes for a selection of food and drink products from several large UK retailers.
13. Glossary
Faster indicator
A faster indicator provides insights into economic activity using close-to-real-time big data, administrative data sources, rapid response surveys or Experimental Statistics, which represent useful economic and social concepts.
Company incorporations
Incorporations are when a company is added to the Companies House register of limited companies. This can also include where an existing business applies to become a limited company, where it was not one before.
Voluntary dissolution applications
A voluntary dissolution application is when a company applies to begin dissolution proceedings. As such, they effectively chose to be removed from the Companies House register. For a company to be eligible to voluntarily dissolve, it should not have completed any trading activity for a period of three months.
Nôl i'r tabl cynnwys14. Measuring the data
UK Coronavirus Restrictions
A full overview of coronavirus (COVID-19) restrictions for each of the four UK constituent countries can be found here:
These restrictions should be considered when interpreting the data featured throughout this bulletin.
Nôl i'r tabl cynnwys15. Strengths and limitations
Information on the strengths and limitations of the indicators in this bulletin is available in the Coronavirus and the latest indicators of the UK economy and society methodology.
Nôl i'r tabl cynnwys
10. Social impact of coronavirus
This section includes some provisional results from the Opinions and Lifestyle Survey (OPN) covering the period 11 to 15 August 2021. The survey went out to 4,989 adults in Great Britain and had a response rate of 63% (3,130 responses). Further information to help understand the impact of the coronavirus (COVID-19) pandemic on people, households and communities in Great Britain will be available in Coronavirus and the social impacts on Great Britain, due to be published on 20 August 2021.
Travelling to work
In the period 11 to 15 August 2021, the proportion of working adults in Great Britain who in the past seven days:
travelled to work (either exclusively or in combination with working from home) was broadly similar to the previous week at 60%
worked exclusively from home was broadly similar to the previous week at 18%
neither travelled to work nor worked from home was unchanged from the previous week at 22%
Shopping
Of the 96% of adults in Great Britain who reported leaving home in the past seven days, the proportion that did so to shop for food and medicine increased slightly by 2 percentage points from the previous week to 84%.
The proportion of these adults who shopped for things other than food and medicine in the last seven days increased by 3 percentage points from the previous week to 47%.
Face coverings
Of the 96% of adults in Great Britain who reported leaving home in the past seven days, the proportion that did so and wore a face covering was broadly similar to the previous week at 89%. Further breakdowns such as the situation when a face covering was worn (for example, while shopping) and by country, will be available in Coronavirus and the social impacts on Great Britain to be published on 20 August 2021.
Nôl i'r tabl cynnwys