Cynnwys
- Main points
- Latest indicators at a glance
- Restaurant seated diners
- Retail footfall
- Business impacts and insights
- Spending on debit and credit cards
- Online job adverts
- Shipping
- Social impact of the coronavirus
- Road traffic in Great Britain
- Data
- Glossary
- Measuring the data
- Strengths and limitations
- Related links
1. Main points
In the week to 14 June 2021, the seven-day average estimate of UK seated diners was at 119% of its level in the equivalent week of 2019; this is a 28 percentage point decrease from the previous week but 62 percentage points higher than the level seen in the week to 19 April 2021, just after the easing of hospitality restrictions in the UK (OpenTable). See Section 3.
In the week to 12 June 2021, overall retail footfall in the UK saw a weekly decrease of 7% but was still at 82% of the level seen in the equivalent week of 2019; this is the second highest volume of retail footfall as a proportion of its 2019 level seen so far this year (Springboard). See Section 4.
The proportion of UK businesses' workforce who are reported to be on furlough leave has fallen from around 20% in late January 2021 to 7% in late May 2021, the lowest proportion since the furlough scheme began; this corresponds with the highest proportion (since June 2020 when comparable estimates began) of the workforce working at their normal place of work, at 62% in late May 2021 (Business Insights and Conditions Survey (BICS)). See Section 5.
In the week to 10 June 2021, the aggregate CHAPS-based indicator of credit and debit card purchases decreased by 7 percentage points from the previous week to 95% of its February 2020 average level; this decrease coincides with the May pay day, Spring Bank Holiday, and May half-term school holidays in the previous week (week to 3 June 2021) (Bank of England CHAPS data). See Section 6.
In May 2021, the monthly CHAPS-based indicator of aggregate credit and debit card spending increased by 6 percentage points compared with April 2021 to 99% of its February 2020 average level; this is the highest the monthly CHAPS index has been since December 2020 (Bank of England CHAPS data). See Section 6.
On 11 June 2021, the volume of online job adverts had decreased by 2% when compared with a week ago, the first time it has fallen since 15 January 2021; despite this, the volume of online job adverts remains substantially above the level before the coronavirus (COVID-19) pandemic, at 127% of its February 2020 average (Adzuna). See Section 7.
There was an average of 421 daily ship visits in the week ending 13 June 2021, an increase of 2% from last week (411) and the highest average number seen since February 2020, before the coronavirus pandemic (exactEarth). See Section 8.
The proportion of working adults in Great Britain who in the last seven days travelled to work (either exclusively or in combination with working from home) increased slightly by 4 percentage points from the previous week to 64% (Opinions and Lifestyle Survey (OPN) 9 to 13 June 2021). See Section 9.
The volume of motor vehicle traffic on Monday 14 June 2021 was at 99% of the level seen in the first week of February 2020, unchanged from the previous week (Department for Transport (DfT)). See Section 10.
In the week ending 13 June 2021, average counts of traffic camera activity for all vehicle types in the North East and London were above their pre-pandemic levels (week ending 22 March 2020) (North East Traffic Cameras, Transport for London). See the accompanying dataset.
There were 13,955 company incorporations in the week to 11 June 2021, a 15% increase from the previous week (12,134), and 2% higher than the equivalent week in 2019 (13,618) (Companies House). See the accompanying dataset.
There were 6,424 voluntary dissolution applications in the week to 11 June 2021, a 46% increase from the previous week (4,414) and 18% higher than the equivalent week of 2019 (5,430); this notable weekly increase follows a substantial fall in the previous week, which came after the Spring Bank Holiday (Companies House). See the accompanying dataset.
The overall price of items in the online food and drink basket decreased by 0.1% in the week ending 13 June 2021, to a level last seen in the week ending 11 April 2021; the main downward contributions came from "fruit", "mineral waters, soft drinks and juices" and "vegetables including potatoes and tubers" (Online price collection). See the accompanying dataset.
Results presented in this bulletin are experimental and may be subject to revision.
2. Latest indicators at a glance
Embed code
3. Restaurant seated diners
OpenTable is a provider of data for online restaurant reservations, with daily data for the UK, London and Manchester being publicly available in its The state of the industry dashboard. These data show the impact of recent events and restrictions on the hospitality industry using a sample of restaurants on the OpenTable network across all channels, that is, online reservations, phone reservations, and walk-ins.
Figure 1: In the week to Monday 14 June 2021, the seven-day average estimate of UK seated diners was at 119% of its level in the equivalent week of 2019
Seated diners, seven-day average, percentage compared with the equivalent week of 2019, week ending 24 February 2020 to week ending 14 June 2021, UK, London and Manchester
Source: OpenTable
Notes:
- Data show the percentage of seated diners when compared with the same week in 2019. For example, Week 24 2021 is compared with Week 24 2019.
- Please note that data for Manchester are only available from week ending 16 November 2020.
Download this chart Figure 1: In the week to Monday 14 June 2021, the seven-day average estimate of UK seated diners was at 119% of its level in the equivalent week of 2019
Image .csv .xlsIn the week to Monday 14 June 2021, the seven-day average estimate of UK seated diners was at 119% of the level seen in the equivalent week of 2019. This is a 28-percentage point decrease when compared with the previous week's index and continues a fall back from the significantly increased activity seen in recent weeks, which coincided with the easing of hospitality restrictions across the UK and the Spring Bank Holiday. Despite this week's fall, the seven-day average estimate of UK seated diners for the week to 14 June 2021 has grown by 62 percentage points when compared with the week to Monday 19 April 2021, just after hospitality restrictions first eased.
In the same week, the seven-day average estimate of seated diners in London was at 71% of its level in the equivalent week of 2019, a 9 percentage point decrease when compared with the previous week's index. The equivalent figure in Manchester was 137%, having decreased by 54 percentage points from the previous week.
Nôl i'r tabl cynnwys4. Retail footfall
National retail footfall
National footfall figures are supplied by Springboard, a provider of data on customer activity. It measures the following for overall UK retail footfall, as well as by high street, retail park, and shopping centre categories:
daily retail footfall as a percentage of its level on the same day of the equivalent week of 2019; for example, Saturday 12 June 2021 is compared with Saturday 8 June 2019
total weekly retail footfall as a percentage of its level in the equivalent week of 2019
the percentage change in weekly footfall compared with the previous week; for example, Week 23 of 2021 is compared with Week 22 of 2021
Springboard's weekly data are defined over a seven-day period running from Sunday to Saturday; Week 23 of 2021 therefore refers to the period Sunday 6 June 2021 to Saturday 12 June 2021
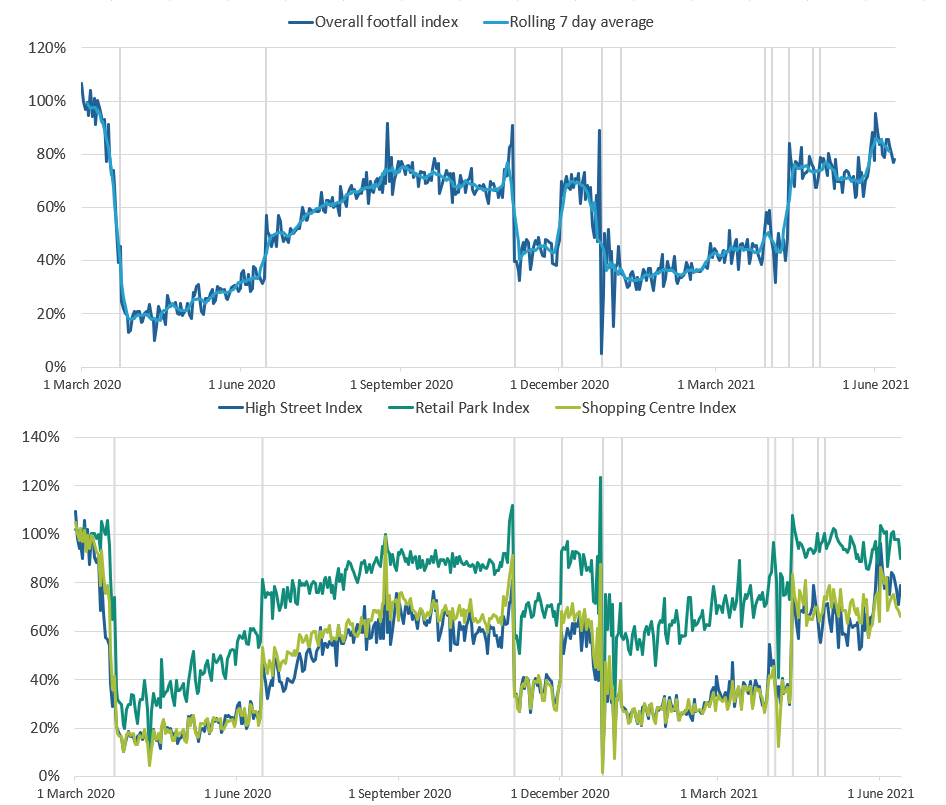
Figure 2: In the week to 12 June 2021, UK retail footfall was at 82% of its level in the equivalent week of 2019
Volume of overall daily retail footfall, percentage compared with the equivalent day of the equivalent week of 2019, 1 March 2020 to 12 June 2021
Source: Springboard and the Department for Business, Energy and Industrial Strategy
Notes:
- The vertical lines indicate notable events. In order, the events are: first national lockdowns begin; restrictions begin to ease across the UK; circuit-breaker lockdown in England; circuit breaker replaced with regional restrictions; Christmas; lockdown begins in England; "stay at home" rule ends in England; Easter; reopening of non-essential retail in England and Wales; reopening of non-essential retail in Scotland; reopening of non-essential retail in Northern Ireland.
- Prior to 3 January 2021, overall and regional daily footfall indices were generated by comparing footfall against its level on the same day of the equivalent week the year before. From this date onwards they were generated by comparing footfall against its level on the same day of the equivalent week in 2019. For a two-day period, from 1 January 2021 to 2 January 2021 daily indices were therefore generated using a 2021 versus 2020 comparison.
Download this image Figure 2: In the week to 12 June 2021, UK retail footfall was at 82% of its level in the equivalent week of 2019
.png (145.4 kB)
According to Springboard, overall retail footfall in the week to 12 June 2021 decreased by 7% compared with the previous week (week to 5 June 2021). Despite this weekly decrease, footfall was at 82% of its level in the equivalent week of 2019, which remains generally higher than that seen in recent weeks and is the second highest volume of retail footfall as a proportion of its 2019 level seen so far this year.
The strongest weekly decreases in retail footfall were at high streets and shopping centres where levels decreased by 9% and 8% compared with the week before, respectively. Footfall at retail parks remained broadly unchanged in the latest week, reducing by 1%, but still remains strongest of all retail locations relative to their levels before the coronavirus (COVID-19) pandemic, at 98% of its level in the equivalent week of 2019. The equivalent figures for high streets and shopping centres were 79% and 73%, respectively.
Regional retail footfall
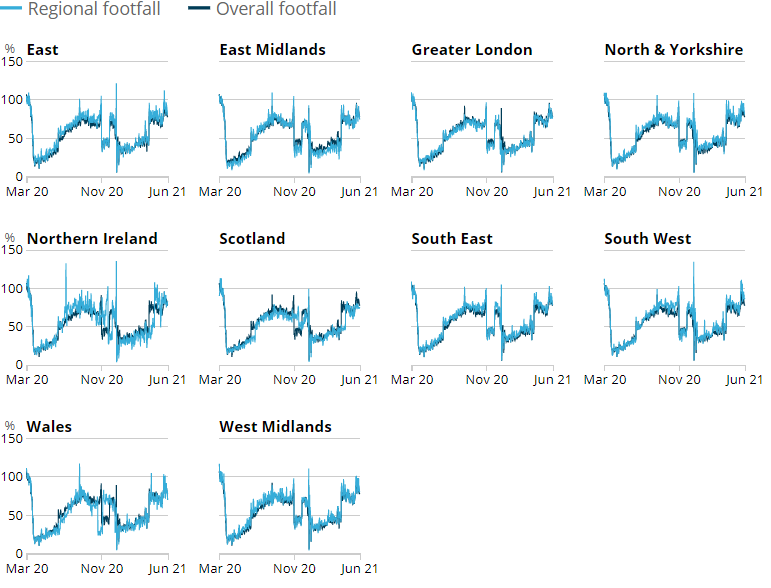
Figure 3: In the week to 12 June 2021, retail footfall was strongest in South West England compared with other UK countries and English regions for a second consecutive week, at 89% of its level in the equivalent week of 2019
Volume of daily retail footfall, percentage of the level recorded on the same day of the equivalent week of 2019, UK countries and English regions, 1 March 2020 to 12 June 2021
Source: Springboard and the Department for Business, Energy and Industrial Strategy
Download this image Figure 3: In the week to 12 June 2021, retail footfall was strongest in South West England compared with other UK countries and English regions for a second consecutive week, at 89% of its level in the equivalent week of 2019
.png (64.2 kB)
According to Springboard, in the week to 12 June 2021, retail footfall saw week-on-week percentage decreases across all UK countries and English regions. The largest weekly percentage decrease in retail footfall was in South West England, where it fell by 11%. Northern Ireland saw the smallest fall, decreasing by 3% in the week to 12 June 2021.
In the same week, retail footfall relative to its level in the equivalent period of 2019 was strongest in South West England, the East of England, North and Yorkshire, and the West Midlands. Their retail footfall levels in the latest week to 12 June 2021 were at 89%, 87%, 86% and 86% of the levels seen in the equivalent week of 2019, respectively.
Nôl i'r tabl cynnwys5. Business impacts and insights
The proportion of businesses' workforce who are reported to be on furlough leave has fallen from around 20% in late January 2021 to 7% in late May 2021, the lowest proportion since the furlough scheme began. This return from furlough also corresponds with the highest proportion (since June 2020 when comparable estimates began) of the workforce working at their normal place of work, at 62% in late May 2021.
Final data for Wave 32 (reference period 17 to 30 May 2021) of the Business Insights and Conditions Survey (BICS) can be found at Business insights and impacts on the UK economy: 17 June 2021.
Further information can also be found in the Business insights and impact on the UK economy dataset.
Nôl i'r tabl cynnwys6. Spending on debit and credit cards
Daily CHAPS-based indicator
These data series are experimental faster indicators for estimating UK spending on credit and debit cards. They track the daily CHAPS payments made by credit and debit card payment processors to around 100 major UK retail corporates. These payments are the proceeds of recent credit and debit card transactions made by customers at their stores, both via physical and online platforms. More information on the indicator is provided in the accompanying methodology article.
Companies are allocated to one of four categories based on their primary business:
"staples" refers to companies that sell essential goods that households need to purchase, such as food and utilities
"work-related" refers to companies providing public transport or selling petrol
"delayable" refers to companies selling goods whose purchase could be delayed, such as clothing or furnishings
"social" refers to spending on travel and eating out
Figure 4: In the week to 10 June 2021, the aggregate CHAPS-based indicator of credit and debit card purchases fell by 7 percentage points from the previous week, to 95% of its February 2020 average
Index February 2020 = 100, a backward looking seven-day rolling average, 13 January 2020 to 10 June 2021, non-seasonally adjusted, nominal prices
Source: Office for National Statistics and Bank of England calculations
Notes:
- Users should note the daily payment data are the sum of card transactions processed up to the previous working day, so there is slight time lag when compared with real-life events on the chart.
- The vertical lines indicate notable events. In order, the events are: first national lockdown begins; some non-essential shops allowed to reopen; regional restrictions begin in England; Christmas period; lockdowns announced in England and Scotland; reopening of non-essential shops, and outdoor pubs and restaurants in England.
- Percentage point difference is derived from current week and previous week index before rounding.
- Users should note that indices for the period 8 June 2021 to 10 June 2021 are provisional and subject to change.
Download this chart Figure 4: In the week to 10 June 2021, the aggregate CHAPS-based indicator of credit and debit card purchases fell by 7 percentage points from the previous week, to 95% of its February 2020 average
Image .csv .xlsFigure 4 shows changes in the value of CHAPS payments received by large UK corporates from their credit and debit card processors, "merchant acquirers".
In the week to 10 June 2021, the CHAPS-based indicator of credit and debit card purchases in aggregate decreased by 7 percentage points from the previous week to 95% of its February 2020 average level. All spending categories decreased in this latest week:
"work-related" spending decreased by 7 percentage points
"staple" by 7 percentage points
"delayable" by 8 percentage points
"social" by 6 percentage points
The week to 3 June 2021 overlapped with the May pay day, Spring Bank Holiday, and May half-term school holidays. Users should note this when comparing aggregate spending and spending by category in the week to 3 June 2021 with the week to 10 June 2021.
In the latest week, "staple" and "work-related" spending were above their February 2020 average levels, both at 111%. Conversely, "delayable" and "social" spending were at 88% and 83% of their average levels in February 2020, respectively.
The full data time series available for data on UK spending on debit and credit cards can be found in the accompanying dataset.
Monthly CHAPS-based indicator
From 17 June 2021 onwards, we will include a monthly version of the aggregate CHAPS-based indicator within this bulletin, which will be updated on a monthly basis. The monthly time series is available in the accompanying dataset and includes methodological notes that users should bear in mind. The monthly CHAPS index is calculated by the Office for National Statistics (ONS), rather than being an additional series that is produced and validated by the Bank of England (BoE).
In May 2021 the monthly CHAPS-based indicator of aggregate credit and debit card spending increased by 6 percentage points compared with April 2021 to 99% of its February 2020 average level. This is the highest value of the monthly index since December 2020, before the re-introduction of national lockdowns across the UK.
Nôl i'r tabl cynnwys7. Online job adverts
Job adverts by category
These figures are experimental estimates of online job adverts provided by Adzuna, an online job search engine, by category and by UK country and English region. The number of job adverts over time is an indicator of the demand for labour. The Adzuna categories used do not correspond to Standard Industrial Classification (SIC) categories, so these values are not directly comparable with the Office for National Statistics (ONS) Vacancy Survey.
Users should note that from 17 June 2021 onwards, week-on-week changes in online job advert volumes will be outlined as percentages, rather than as percentage point changes. Percentage change figures quoted in the commentary will therefore not necessarily match the percentage point changes observed in the charts and accompanying dataset.
Figure 5: On 11 June 2021, the total volume of online job adverts had fallen by 2% compared with a week ago, but was still substantially above its pre-pandemic level at 127% of its February 2020 average
Volume of online job adverts by category, index: 100 = February 2020 average, 4 January 2019 to 11 June 2021, non-seasonally adjusted
Embed code
Notes
- Further category breakdowns are included in the Online job advert estimates dataset and more details on the methodology can be found in Using Adzuna data to derive an indicator of weekly vacancies.
On 11 June 2021, the total volume of online job adverts for the UK had decreased slightly by 2% from a week earlier (4 June 2021). After a period of continued growth, this is the first time that the volume of online job adverts has fallen since 15 January 2021, shortly after the re-introduction of national lockdowns across the UK. Total job adverts decreased by 0.14% on 16 April 2021, but this change was not deemed significant because of rounding.
Compared with last week, excluding the “unknown” category, the volume of online job adverts had decreased in 22 out of the 28 categories, remained unchanged in two categories, and increased in four categories.
There were notable weekly decreases in online job advert numbers in the “management, executive and consulting”, “facilities and maintenance” and “charity and voluntary” categories, which all fell by 6% compared with seven days earlier. The “energy, oil and gas”, “graduate”, “part-time and weekend”, and “healthcare and nursing” categories all saw slight week-on-week increases in online job advert numbers of 1%.
Despite the overall week-on-week decrease, on 11 June 2021, the total volume of online job adverts remained substantially higher than pre-pandemic levels at 127% of its February 2020 average level. The number of online job adverts was below pre-pandemic levels for a handful of categories: “energy, oil and gas”, “legal”, “graduate” and “healthcare and social care”, which were at 92%, 92%, 86% and 99% of their February 2020 average levels, respectively.
Job adverts by region
Figure 6: On 11 June 2021, the volume of online job adverts had fallen in all UK countries and English regions compared with a week ago
Volume of online job adverts by UK countries and English regions, index: 100 = February 2020 average, 4 January 2019 to 11 June 2021, non-seasonally adjusted
Embed code
On 11 June 2021, the volume of online job adverts had fallen in all UK countries and English regions compared with 4 June 2021. This is the first time that the volume of adverts has fallen week-on-week in all UK countries and English regions since 31 December 2020, shortly before the introduction of national lockdowns across the UK. The largest week-on-week decrease was in Northern Ireland where, compared with 4 June 2021, the number of online job adverts had fallen by 8%. This is followed by the South West, which fell 5%, and the North West, Scotland, Wales, and Yorkshire and The Humber, all of which fell by 3%.
Despite the decrease over the last week, the volume of online job adverts remained above pre-pandemic levels in all UK countries and English regions on 11 June 2021. They were strongest compared with pre-pandemic levels in the North East, where online job adverts stood at 168% of their February 2020 average level. The number of online job adverts was relatively weakest in London, where the corresponding figure was 104%.
Nôl i'r tabl cynnwys8. Shipping
These shipping indicators are based on counts of all vessels, and cargo and tanker vessels. As discussed in Faster indicators of UK economic activity: shipping, we expect the shipping indicators to be related to the import and export of goods.
The coronavirus (COVID-19) pandemic first began to affect the level of shipping visits from the week ending 29 March 2020. For this reason, average ship visits in the latest week are compared with the equivalent week in 2019 rather than 2020.
Figure 7: There was an average of 421 daily ship visits in the week ending 13 June 2021, a slight increase of 2% from last week (411) and 11% higher than the number seen in the same week of 2019 (376)
Daily movements in shipping visits, UK, seasonally adjusted, 1 December 2019 to 13 June 2021
Source: exactEarth
Notes:
- See the accompanying dataset for notable dates and weather events.
- Users should note that the daily shipping data for Monday 31 May 2021 were collected at an earlier point than the rest of that week's daily data (week ending 6 June 2021).
Download this chart Figure 7: There was an average of 421 daily ship visits in the week ending 13 June 2021, a slight increase of 2% from last week (411) and 11% higher than the number seen in the same week of 2019 (376)
Image .csv .xlsIn the week to 13 June 2021, there was an average of 421 daily ships visits. This is 11% higher than the number seen in the equivalent week of 2019 (376) and is the highest volume seen since the week to 8 February 2020 (423), before the coronavirus pandemic began.
Figure 8: There was an average of 109 cargo and tanker ship visits in the week ending 13 June 2021, an increase of 4% from the previous week (105) and 10% higher than the equivalent week in 2019 (98)
Daily movements in shipping visits, UK, seasonally adjusted, 1 December 2019 to 13 June 2021
Source: exactEarth
Notes:
- See the accompanying dataset for notable dates and weather events.
- Users should note that the daily shipping data for Monday 31 May 2021 were collected at an earlier point than the rest of that week's daily data (week ending 6 June 2021).
Download this chart Figure 8: There was an average of 109 cargo and tanker ship visits in the week ending 13 June 2021, an increase of 4% from the previous week (105) and 10% higher than the equivalent week in 2019 (98)
Image .csv .xls10. Road traffic in Great Britain
According to Department for Transport (DfT) non-seasonally adjusted road traffic data, the volume of all motor vehicle traffic on Monday 14 June 2021 was at 99% of the level seen on Monday of the first week of February 2020. This is unchanged from Monday 7 June 2021, but a 15 percentage point increase since 29 March 2021, when the "stay at home" restrictions ended in England.
Compared with last week, the volume of road traffic on Monday 14 June 2021 for light commercial vehicles, heavy goods vehicles and cars all remained broadly unchanged at 111%, 109% and 95% of their levels seen on the same day of the first week of February 2020, respectively.
Figure 9: The volume of motor vehicle traffic on Monday 14 June 2021 was at 99% of the level seen in the first week of February 2020, unchanged from the previous week
Daily road traffic index: 100 = same traffic as the equivalent day of the week in the first week of February 2020, 1 March 2020 to 14 June 2021, non-seasonally adjusted
Embed code
Notes
- The blue shaded areas refer to periods when restrictions across the UK were in effect. In order, these were: first national lockdown in the UK (23 March 2020) to easing of restrictions with non-essential shops reopening in England (15 June 2020); second lockdown in England (5 November 2020) to lockdown being replaced with three-tier system in England (2 December 2020); third lockdown announced in Scotland and England (4 January 2021) to “stay at home” restrictions ending in England 29 March 2021.
The daily DfT estimates are indexed to the first week of February 2020 and the comparison is with the same day of the week. The data provided are useful as an indication of traffic change rather than actual traffic volumes. More information on the methods, quality and economic analysis for these indicators can be found in the DfT methodology article.
Nôl i'r tabl cynnwys11. Data
UK spending on credit and debit cards
Dataset | Released 17 June 2021
Experimental indicator for monitoring UK retail purchases derived from the Bank of England's CHAPS data.
Shipping indicators
Dataset | Released 17 June 2021
Experimental weekly and daily ship visits dataset covering UK ports.
Traffic camera activity
Dataset | Released 17 June 2021
Experimental daily traffic camera counts data for busyness indices covering the UK.
Online job advert estimates
Dataset | Released 17 June 2021
Experimental job advert indices covering the UK online job market.
Company Incorporations and Voluntary Dissolutions
Dataset | Released 17 June 2021
The number of weekly Companies House Incorporations and Voluntary Dissolution applications accepted.
Online weekly price changes
Dataset | Released 17 June 2021
Experimental estimates of online price changes for a selection of food and drink products from several large UK retailers.
Business insights and impact on the UK economy
Dataset | Released 17 June 2021
Responses from the Business Insights and Conditions Survey (BICS).
12. Glossary
Faster indicator
A faster indicator provides insights into economic activity using close-to-real-time big data, administrative data sources, rapid response surveys or Experimental Statistics, which represent useful economic and social concepts.
Company incorporations
Incorporations are when a company is added to the Companies House register of limited companies. This can also include where an existing business applies to become a limited company, where it was not one before.
Voluntary dissolution applications
A voluntary dissolution application is when a company applies to begin dissolution proceedings. As such, they effectively choose to be removed from the Companies House register. For a company to be eligible to voluntarily dissolve, it should not have completed any trading activity for a period of three months.
Nôl i'r tabl cynnwys13. Measuring the data
Office for Statistics Regulation (OSR) publishing review
The Office for Statistics Regulation (OSR) is undertaking a review into whether the 9:30am release time stated in the Code of Practice for Statistics meets the needs of users. During the pandemic, exemptions were granted to allow the release of market sensitive statistics at 7:00am. OSR welcomes views about the release time of official statistics by Friday 25 June 2021, please send comments to: regulation@statistics.gov.uk.
UK coronavirus restrictions
A full overview of coronavirus (COVID-19) restrictions for each of the four UK constituent countries can be found here:
These restrictions should be considered when interpreting the data featured throughout this bulletin.
Nôl i'r tabl cynnwys14. Strengths and limitations
Information on the strengths and limitations of the indicators in this bulletin is available in the Coronavirus and the latest indicators of the UK economy and society methodology.
Nôl i'r tabl cynnwys
9. Social impact of the coronavirus
This section includes some provisional results from the Opinions and Lifestyle Survey (OPN) covering the period 9 to 13 June 2021. The survey went out to 6,018 adults in Great Britain and had a response rate of 63%.
Further information to help understand the impact of the coronavirus (COVID-19) pandemic on people, households, and communities in Great Britain will be available in Coronavirus and the social impacts on Great Britain due to be published on 18 June 2021.
Travelling to work
In the period 9 to 13 June 2021, the proportion of working adults in Great Britain who in the last seven days:
travelled to work (either exclusively or in combination with working from home) increased slightly by 4 percentage points from the previous week to 64%
worked exclusively from home remained unchanged to the previous week at 23%
neither travelled to work nor worked from home decreased slightly by 3 percentage points from the previous week to 14%
Shopping
Of the 96% of adults that reported they had left home in the last seven days, the proportion that did so to shop for food and medicine was 84%.
The proportion of these adults who shopped for things other than food and medicine in the last seven days was 44% (period 9 to 13 June 2021).
From 9 June 2021, there has been a change to how the question regarding people's reasons for leaving home is asked to try to reduce burden on survey respondents. Although the same response options to those provided in previous weeks of the survey remain, we advise caution in comparing estimates collected on or after 9 June 2021 with those published prior to 9 June 2021.
Nôl i'r tabl cynnwys