Cynnwys
- Main points
- Latest indicators at a glance
- Company compulsory dissolution first gazettes
- OpenTable seated diners
- UK flight data
- Business impacts and insights
- Online job adverts
- UK spending on debit and credit cards
- Retail footfall
- Shipping
- Road traffic in Great Britain
- Data
- Glossary
- Measuring the data
- Strengths and limitations
- Related links
1. Main points
There were 20,503 compulsory dissolution first gazettes (a notice issued by Companies House indicating their intention to remove a company from the register) in the week to 7 September 2021 (Companies House). Section 3.
There were 5,762 voluntary dissolution applications (another type of company closure) in the week to 10 September 2021, an increase of 18% from the previous week and a 14% increase from the equivalent week of 2019 (5,061); the main reason for this increase is the previous four-day working week caused by the summer bank holiday (Companies House). See the accompanying dataset.
There were 14,027 company incorporations in the week to 10 September 2021, an increase of 13% from the previous week and a 6% increase from the equivalent week of 2019 (13,200) (see previous main point) (Companies House). See the accompanying dataset.
In the week to 13 September 2021, the seven-day average estimate of UK seated diners fell by 4 percentage points from the previous week to 124% of the level in the equivalent week of 2019 (OpenTable). Section 4.
The seven-day average number of UK daily flights was 3,579 in the week ending 12 September 2021, this is broadly unchanged from the previous week (EUROCONTROL). Section 5.
In the last two weeks, a quarter of all UK currently trading businesses reported decreased profits compared with normal expectations for this time of year; the lowest number reporting this since the Business Insights and Conditions Survey (BICS) began (initial results from Wave 39 of BICS). Section 6.
On 10 September 2021, the total volume of online job adverts was unchanged from the previous week at 128% of its February 2020 average level (Adzuna). Section 7.
In the week to 9 September 2021, the aggregate CHAPS-based indicator of credit and debit card purchases decreased by 5 percentage points from the previous week, to 95% of its February 2020 average (Bank of England CHAPS data). Section 8.
In the week to 11 September 2021, overall retail footfall in the UK decreased by 4% from the previous week and was at 83% of the level seen in the equivalent week of 2019 (Springboard). Section 9.
There was an average of 316 daily ship visits in the week to 12 September 2021, a 9% increase from the previous week; the average number of daily cargo ship visits was broadly unchanged (exactEarth). Section 10.
The volume of motor vehicle traffic on Monday 13 September 2021 was at the same level as the first week of February 2020 (Department for Transport). Section 11.
In the week ending 12 September 2021, the seasonally adjusted average count of traffic camera activity for cars in the North East of England and London were both above their pre-pandemic levels (North East Traffic Cameras, Transport for London). See the accompanying dataset.
Results presented in this bulletin are experimental and may be subject to revision.
2. Latest indicators at a glance
Embed code
3. Company compulsory dissolution first gazettes
In collaboration with Companies House, from 16 September 2021 we are introducing a weekly indicator of the number of company compulsory dissolution first gazettes issued in the UK. Compulsory dissolution first gazette statistics are a complementary indicator of potential company closure to voluntary dissolution applications and help provide a fuller picture of business demography in the UK.
Companies House paused the issuing of compulsory dissolution first gazettes between 16 March and 10 October 2020, and between 21 January and 8 March 2021. The deadline for companies to supply them with statutory documents for all filing deadlines falling between 27 June 2020 and 5 April 2021 was also extended. To ensure comparability we will present weekly compulsory dissolution first gazette figures as annual cumulative counts in the real-time indicators bulletin. Users should bear this in mind when comparing cumulative company dissolution figures between years.
More information on compulsory dissolution first gazettes, voluntary dissolution applications and incorporations can be found in the Companies House methodology document.
Figure 1: There were 20,503 company compulsory dissolution first gazettes issued in the UK in the week ending 7 September 2021
Cumulative company compulsory dissolution first gazettes, UK, week ending 2 January 2018 to week ending 7 September 2021, non-seasonally adjusted
Source: Companies House
Notes:
- Companies House publish weekly compulsory dissolution first gazette figures on Tuesdays, covering the period Wednesday to Tuesday. Week 36 of 2021 therefore covers the week ending 7 September 2021.
- More methodological information on company incorporations, voluntary dissolution applications, and compulsory dissolution first gazettes can be found in the Companies House methodology document.
Download this chart Figure 1: There were 20,503 company compulsory dissolution first gazettes issued in the UK in the week ending 7 September 2021
Image .csv .xlsThere were 20,503 compulsory dissolution first gazettes issued in the UK in the week to 7 September 2021, bringing the cumulative total since the start of the year to 343,787. This cumulative annual figure is 30% and 26% higher than the pre-pandemic years of 2018 and 2019, respectively. The recent increases have likely been caused by the ending of legislative easements, whereby companies were granted extensions to filing deadlines.
The weekly and cumulative data are available in the accompanying dataset, along with data on voluntary dissolutions (another type of company closure) and company incorporations.
Nôl i'r tabl cynnwys4. OpenTable seated diners
OpenTable is a provider of data for online restaurant reservations, with daily data for the UK, London and Manchester being publicly available in its The state of the industry dashboard. These data show the impact of recent events and restrictions on the hospitality industry using a sample of restaurants on the OpenTable network across all channels, that is, online reservations, phone reservations, and walk-ins.
Figure 2: The seven-day average estimate of UK seated diners fell by 4 percentage points in the week ending 13 September 2021, to 124% of the level in the equivalent week of 2019
Seated diners, seven-day average, percentage compared with the equivalent week of 2019, week ending 24 February 2020 to week ending 13 September 2021, UK, London and Manchester
Source: OpenTable
Notes:
- Data show the percentage of seated diners when compared with the same week in 2019. For example, Week 36 2021 is compared with Week 36 2019.
- Please note that data for Manchester are only available from week ending 16 November 2020.
Download this chart Figure 2: The seven-day average estimate of UK seated diners fell by 4 percentage points in the week ending 13 September 2021, to 124% of the level in the equivalent week of 2019
Image .csv .xlsIn the latest week, the seven-day average estimate of seated diners in Manchester was 128% of the level seen in the equivalent week of 2019. During the same period, the equivalent figure for London was 81%.
Impact of Eat Out to Help Out
Last year’s Eat Out to Help Out scheme provided 50% off the cost of food and/or non-alcoholic drinks eaten-in at participating businesses UK-wide. It aimed to help protect jobs in the hospitality sector by encouraging consumers to eat out. The scheme applied all-day Monday to Wednesday from 3 to 31 August 2020.
Figure 3: The average daily estimate of UK seated diners for August 2020 was 122% of the equivalent period of 2019; 16 percentage points lower than the average for the corresponding period in 2021
Seated diners, daily average, percentage compared with the equivalent day of 2019, 1 to 31 August 2020 and 30 July to 30 August 2021, UK
Source: OpenTable
Notes:
- Data show the percentage of seated diners when compared with the same day in 2019. For example, Saturday 3 August 2019 is compared with Saturday 1 August 2020 and Saturday 30 July 2021.
- The 31 August 2021 was a bank holiday and as such this data point should be viewed with caution.
Download this chart Figure 3: The average daily estimate of UK seated diners for August 2020 was 122% of the equivalent period of 2019; 16 percentage points lower than the average for the corresponding period in 2021
Image .csv .xlsThe average daily estimate of UK seated diners for the month of August 2020 (when the Eat Out to Help Out scheme was in place) was 122% of the equivalent period of 2019. This is 69 percentage points higher than the proceeding 28 days (4 to 31 July 2020), the period from which pubs and restaurants in England were able to reopen. This shows a marked uptick in UK seated diners during the period the Eat Out to Help Out scheme was in place, when compared with the proceeding period with restrictions relaxed.
The average daily estimate of UK seated diners for August 2020 (122%) was 16 percentage points lower than the corresponding period in 2021 (137%). Meanwhile, the August 2020 average daily estimate of seated diners in London was 61% of the equivalent period of 2019; 24 percentage points lower than the same period in 2021 (85%).
The lower number of seated diners across the whole of August 2020, when compared with 2021, is not surprising given increased restrictions, the level of uncertainty surrounding the coronavirus (COVID-19) pandemic and the subsequent vaccination rollout in 2021.
As the scheme applied all-day Monday to Wednesday throughout August 2020 it is useful to compare these days in isolation across 2021 and 2020. The average daily estimate of UK seated diners from Monday to Wednesday in August 2020 was 165% of the equivalent dates of 2019. This was 31 percentage points higher than the corresponding figure for August 2021 (134%) and indicates a notable impact on seated diners for the days that the scheme applied.
In London meanwhile, when we compare seated diner estimates on Monday to Wednesday in August in 2021 and 2020, the impact of the Eat Out to Help Out scheme is much less obvious. The average daily estimate of London seated diners for Monday to Wednesday in 2021 was 77% of its level in the equivalent period of 2019, while the corresponding figure for August 2020 was only 1 percentage point higher at 78%.
The Office for National Statistics (ONS) analysis from October 2020, Prices Economic Analysis Quarterly, noted that there was an indication of a displacement effect during the Eat Out to Help Out scheme, whereby diners shifted their dining habits slightly towards the beginning of the week, to the days that the scheme applied to. This is reflected in the analysis with a marked increase in UK seated diner estimates on the days that the scheme applied, when comparing 2020 with 2021. However, when contrasting August 2020 to the equivalent period in 2021, estimates for UK seated diners for 2021 were notably higher.
Users should note that comparison to seated diner estimates for Manchester does not feature in this section as the Manchester data is only available from November 2020.
For analysis on the impact of the Eat Out to Help Out scheme on consumer prices, please see the October 2020 Prices Economic Analysis Quarterly and the September 2021 Consumer price inflation, UK.
Nôl i'r tabl cynnwys5. UK flight data
These data are daily flight figures from the European Organisation for the Safety of Air Navigation (EUROCONTROL). Daily flight numbers for the UK alongside other countries are available in EUROCONTROL's dashboard. EUROCONTROL is a pan-European, civil-military organisation dedicated to supporting European aviation. Its Aviation Intelligence and Performance Review Unit provides independent collection and validation of air navigation services performance-related data and intelligence gathering.
The flights data include international arrivals and departures to and from the UK (including crown dependencies) and domestic UK flights, but exclude overflights (flights that pass over UK territory). They capture all flight movements that operate under Instrument Flight Rules (IFR), where the pilot uses instruments in the flight deck to control, guide and adjust the plane. This includes commercial flights carrying passengers and cargo as well as non-commercial flights such as private and military flights.
Data from EUROCONTROL do not include information on the volume of passengers or cargo carried on UK flights. Especially in the context of the coronavirus (COVID-19) pandemic, flights might not be operating at full capacity and therefore trends in passengers and cargo will differ from trends in flights presented here.
Figure 4: The seven-day average number of UK daily flights was 3,579 in the week ending 12 September 2021, broadly unchanged from the previous week
Number of daily flights, non-seasonally adjusted, and seven-day moving average, 2 January 2019 to 12 September 2021, UK
Source: European Organisation for the Safety of Air Navigation (EUROCONTROL)
Notes:
- The fall in February 2020 coincides with Storm Ciara.
- The falls in December and January coincide with Christmas Eve, Christmas Day, New Year’s Eve and New Year’s Day.
Download this chart Figure 4: The seven-day average number of UK daily flights was 3,579 in the week ending 12 September 2021, broadly unchanged from the previous week
Image .csv .xlsIn the week ending 12 September 2021, the seven-day average number of UK daily flights was 3,579, broadly unchanged from the previous week (3,589). The average number of UK daily flights in the latest week was at 54% and 128% of the level seen in the equivalent week of 2019 and 2020, respectively.
The seven-day average number of UK daily flights has increased by 151% from the week ending 23 May 2021, the week that international travel was allowed to resume and the UK government implemented the travel traffic light system (17 May 2021).
The full data time series available for UK flights can be found in the accompanying dataset, which contains daily flight numbers and the rolling seven-day averages.
Nôl i'r tabl cynnwys6. Business impacts and insights
Initial results from Wave 39 of the Business Insights and Conditions Survey (BICS) cover the reference period 23 August to 5 September 2021, with a response rate of 19.6% (7,525 responses). The survey was live for the period 6 to 14 September 2021.
Figure 5: A quarter of all UK currently trading businesses reported decreased profits compared with normal expectations for this time of year, the lowest number reported since the start of BICS
Impact on profits, businesses currently trading, weighted by count, UK, 7 September 2020 to 5 September 2021
Source: Office for National Statistics – Business Insights and Conditions Survey (BICS)
Notes:
- Initial weighted results, Wave 39 of Office for National Statistics' (ONS') Business Insights and Conditions Survey (BICS).
- A detailed description of the weighting methodology and the weights used for each variable is available in Business Insights and Conditions Survey (BICS): preliminary weighted results.
- Businesses were asked for their experiences for the reference period 23 August to 5 September 2021. However, for questions regarding the last two weeks, businesses may respond from the point of completion of the questionnaire (6 September to 14 September 2021).
- Data are plotted in the middle of the two-week period of each wave.
Download this chart Figure 5: A quarter of all UK currently trading businesses reported decreased profits compared with normal expectations for this time of year, the lowest number reported since the start of BICS
Image .csv .xls
| All Industries | |
|---|---|
| Turnover has increased by more than 50% | Less than 1% |
| Turnover has increased between 20% and 50% | 2% |
| Turnover has increased by up to 20% | 4% |
| Turnover has not been affected | 53% |
| Turnover has decreased by up to 20% | 12% |
| Turnover has decreased between 20% and 50% | 8% |
| Turnover has decreased by more than 50% | 6% |
| Not sure | 16% |
Download this table Table 1: In Wave 39 a net 20% of businesses reported a decrease in turnover, compared with normal expectations for this time of year
.xls .csv7. Online job adverts
These figures are experimental estimates of online job adverts provided by Adzuna, an online job search engine, by category, by UK country and English region. The number of job adverts over time is an indicator of the demand for labour. The Adzuna categories used do not correspond to Standard Industrial Classification (SIC) categories, so these values are not directly comparable with the Office for National Statistics (ONS) Vacancy Survey.
Figure 6: The total volume of online job adverts on 10 September remains at 128% of its February 2020 average level
Volume of online job adverts by category, index: 100 = February 2020 average, 4 January 2019 to 10 September 2021, non-seasonally adjusted
Embed code
Notes:
Further category breakdowns are included in the online job advert estimates dataset and more details on the methodology can be found in Using Adzuna data to derive an indicator of weekly vacancies.
Users should note that week-on-week changes in online job advert volumes are outlined as percentages, rather than as percentage point changes. Percentage change figures quoted in the commentary will therefore not necessarily match the percentage point changes observed in the charts and accompanying dataset.
Download the data
According to Adzuna, on 10 September 2021, the total volume of online job adverts in the UK was unchanged from the previous week (3 September 2021).
Of the 28 categories, 17 saw a weekly increase in the number of online job adverts, 3 were unchanged, while the remaining 8 decreased when compared with the previous week. The largest weekly increase was in “education”, which rose by 10% and follows six consecutive weeks of decline. This was the largest weekly increase in this category since 12 March 2021, although the “education” category remains below its pre-pandemic February 2020 average level. The largest weekly fall was in “part-time/weekend”, which fell by 12%, and follows two weeks where this category saw a 17% weekly decline followed by growth of 18%.
The total volume of online job adverts remained substantially above pre-coronavirus (COVID-19) pandemic volume, at 128% of its February 2020 average level. The “transport, logistics and warehouse” category remained that with the highest amount of job adverts relative to its February 2020 average pre-pandemic level, at 325%.
There were five categories which were below their pre-pandemic levels, the lowest of which were "education”, “graduate” and “travel/tourism”, all at 92% of their February 2020 average level.
Job adverts by region
Figure 7: The volume of online job adverts remained higher than their February 2020 average levels across all UK countries and English regions in the week to 10 September 2021
Volume of online job adverts by category, index: 100 = February 2020 average, 4 January 2019 to 10 September 2021, non-seasonally adjusted
Embed code
Download the data
On 10 September 2021, the volume of online job adverts increased in 5 of the 12 UK countries and English regions when compared with the previous week (3 September 2021), the largest of which was Northern Ireland where it increased by 5%. The volume of online job adverts was unchanged in 4 and fell in 3 UK countries and English regions, the largest of which was Wales where it fell by 2%.
In the latest week, volumes of online job adverts remained above their February 2020 average levels in all UK countries and English regions. The highest of these were in Northern Ireland, the North East and the East Midlands, at 174%, 172% and 154% of their February 2020 average levels, respectively. This is the first week since 9 April 2021 where the North East does not have the highest number of job adverts relative to its pre-pandemic level.
In London, the volume of online job adverts relative to its pre-pandemic (February 2020) average level has increased by 12 percentage points in the last two weeks, although it remains the region with the lowest volume of adverts compared with its pre-pandemic level.
Nôl i'r tabl cynnwys8. UK spending on debit and credit cards
Daily CHAPS-based indicator
These data series are experimental faster indicators for estimating UK spending on credit and debit cards. They track the daily CHAPS payments made by credit and debit card payment processors to around 100 major UK retail corporates. These payments are the proceeds of recent credit and debit card transactions made by customers at their stores, both via physical and via online platforms. More information on the indicator is provided in the accompanying methodology article.
Companies are allocated to one of four categories based on their primary business:
"staples" refers to companies that sell essential goods that households need to purchase, such as food and utilities
"work-related" refers to companies providing public transport or selling petrol
"delayable" refers to companies selling goods whose purchase could be delayed, such as clothing or furnishings
"social" refers to spending on travel and eating out
Figure 8: The aggregate CHAPS-based indicator of credit and debit card purchases decreased by 5 percentage points in the week to 9 September 2021 to 95% of its February 2020 average
Index February 2020 = 100, a backward looking seven-day rolling average, 13 January 2020 to 9 September 2021, non-seasonally adjusted, nominal prices
Source: Office for National Statistics and Bank of England calculations
Notes:
- Users should note the daily payment data is the sum of card transactions processed up to the previous working day, so there is a slight time lag when compared with real-life events on the chart.
- The vertical lines indicate key events. In order, the events are: first national lockdown begins; some non-essential shops allowed to reopen; regional restrictions begin in England; Christmas period; lockdowns announced in England and Scotland; reopening of non-essential shops, and outdoor pubs and restaurants in England; further easing of lockdown restrictions, including re-opening of indoor pubs and restaurants in England; most legal restrictions to control COVID-19 lifted in England.
- Percentage point difference is derived from current week and previous week index before rounding.
- Data for one sub-sector with 15% weight in the “social” spending category has been imputed for the period of 12 August to 9 September 2021 due to data availability issues.
Download this chart Figure 8: The aggregate CHAPS-based indicator of credit and debit card purchases decreased by 5 percentage points in the week to 9 September 2021 to 95% of its February 2020 average
Image .csv .xlsFigure 8 shows changes in the value of CHAPS payments received by large UK corporates from their credit and debit card processors, "merchant acquirers".
In the week to 9 September 2021, the CHAPS-based indicator of credit and debit card purchases in aggregate decreased by 5 percentage points from the previous week to 95% of its February 2020 average level. All spending categories decreased in this latest week:
- “delayable” decreased by 7 percentage points
- “staple” decreased by 5 percentage points
- “work-related” decreased by 1 percentage point
- “social” decreased by 1 percentage point
This week to 9 September 2021 compares with the week to 2 September 2021 which contained the August pay day and the Summer Bank Holiday. Users should note this when comparing aggregate spending and spending by category.
Since 17 May 2021, when the hospitality industry was allowed to serve customers indoors in England, spending on “social” has increased by 9 percentage points. Over the same period spending on “staples” has decreased by 8 percentage points.
In the latest week (week to 9 September 2021), only “work-related” and “staple” spending were above their February 2020 average level, at 117% and 102%, respectively. Conversely, “delayable” and “social” spending were at 86% and 91% of their February 2020 average levels, respectively.
Nôl i'r tabl cynnwys9. Retail footfall
National footfall figures are supplied by Springboard, a provider of data on customer activity. They measure the following for overall UK retail footfall, as well as by high street, retail park, and shopping centre categories:
- daily retail footfall as a percentage of its level on the same day of the equivalent week of 2019; for example, Saturday 11 September 2021 is compared with Saturday 7 September 2019
- total weekly retail footfall as a percentage of its level in the equivalent week of 2019
- the percentage change in weekly footfall compared with the previous week; for example, Week 36 of 2021 is compared with Week 35 of 2021
- Springboard's weekly data are defined over a seven-day period running from Sunday to Saturday; Week 36 of 2021 therefore refers to the period Sunday 5 September to Saturday 11 September 2021
Users should note that all quoted figures have been rounded to the nearest integer.
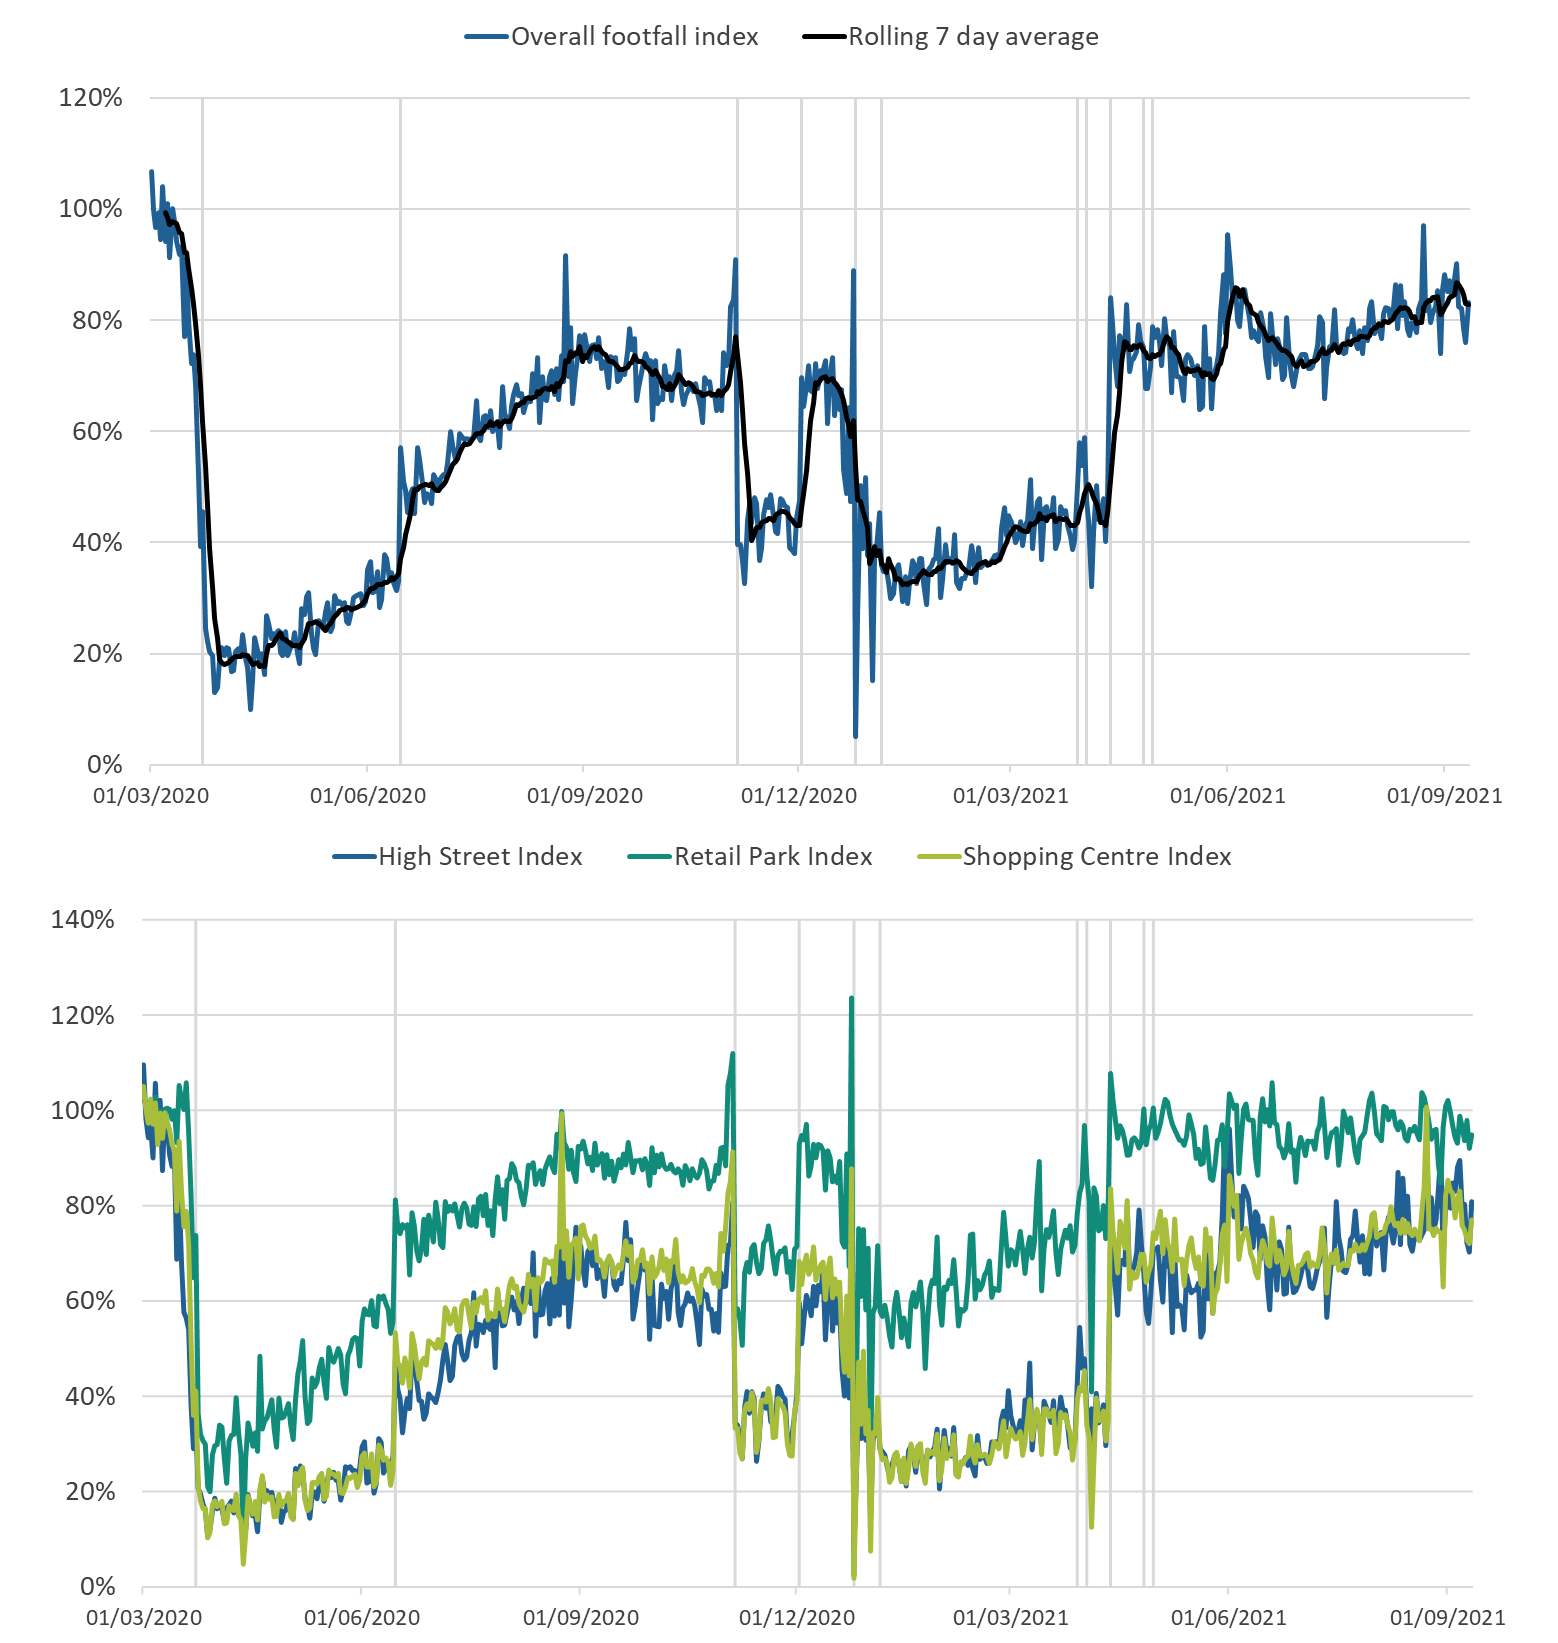
Figure 9: Overall retail footfall in the UK decreased by 4% in the week to 11 September 2021, and was at 83% of the level seen in the equivalent week of 2019
Volume of overall daily retail footfall, percentage compared with the equivalent day of the equivalent week of 2019, 1 March 2020 to 11 September 2021
Source: Springboard and the Department for Business, Energy and Industrial Strategy
Notes:
- The vertical lines indicate notable events. In order, the events are: first national lockdowns begin; restrictions begin to ease across the UK; circuit-breaker lockdown in England; circuit breaker replaced with regional restrictions; Christmas; lockdown begins in England; "stay at home" rule ends in England; Easter; reopening of non-essential retail in England and Wales; reopening of non-essential retail in Scotland; reopening of non-essential retail in Northern Ireland; most legal restrictions to control coronavirus (COVID-19) lifted in England.
- Users should note that week-on-week changes in retail footfall volumes are outlined as percentages, rather than as percentage point changes. Percentage change figures quoted in the commentary will therefore not necessarily match the percentage point changes observed in the chart.
Download this image Figure 9: Overall retail footfall in the UK decreased by 4% in the week to 11 September 2021, and was at 83% of the level seen in the equivalent week of 2019
.png (249.1 kB)
According to Springboard, in the week to 11 September 2021, the volume of overall retail footfall in the UK decreased by 4% from the previous week (week to 4 September 2021), because of an 8% fall in shopping centre footfall, as well as falls in retail park and high street footfall of 5% and 2% respectively.
In the latest week to 11 September 2021, overall retail footfall was at 83% of the level seen in the equivalent week of 2019. Comparing retail locations, footfall at retail parks remained the strongest relative to pre-coronavirus (COVID-19) pandemic levels, at 96% of its equivalent 2019 level. Meanwhile, the corresponding figures for high streets and shopping centres were 80% and 76%, respectively. Throughout most of the pandemic, footfall at retail parks has consistently been strongest when compared with other retail locations, relative to their 2019 levels.
Regional retail footfall
Figure 10: The South West region had the highest retail footfall relative to pre-pandemic levels in the week to 11 September 2021, at 88% of the level in the same week of 2019
Volume of daily retail footfall, percentage of the level recorded on the same day of the equivalent week of 2020, UK countries and English regions, 1 March 2020 to 11 September 2021

Source: Springboard and the Department for Business, Energy and Industrial Strategy
Download this image Figure 10: The South West region had the highest retail footfall relative to pre-pandemic levels in the week to 11 September 2021, at 88% of the level in the same week of 2019
.png (100.2 kB)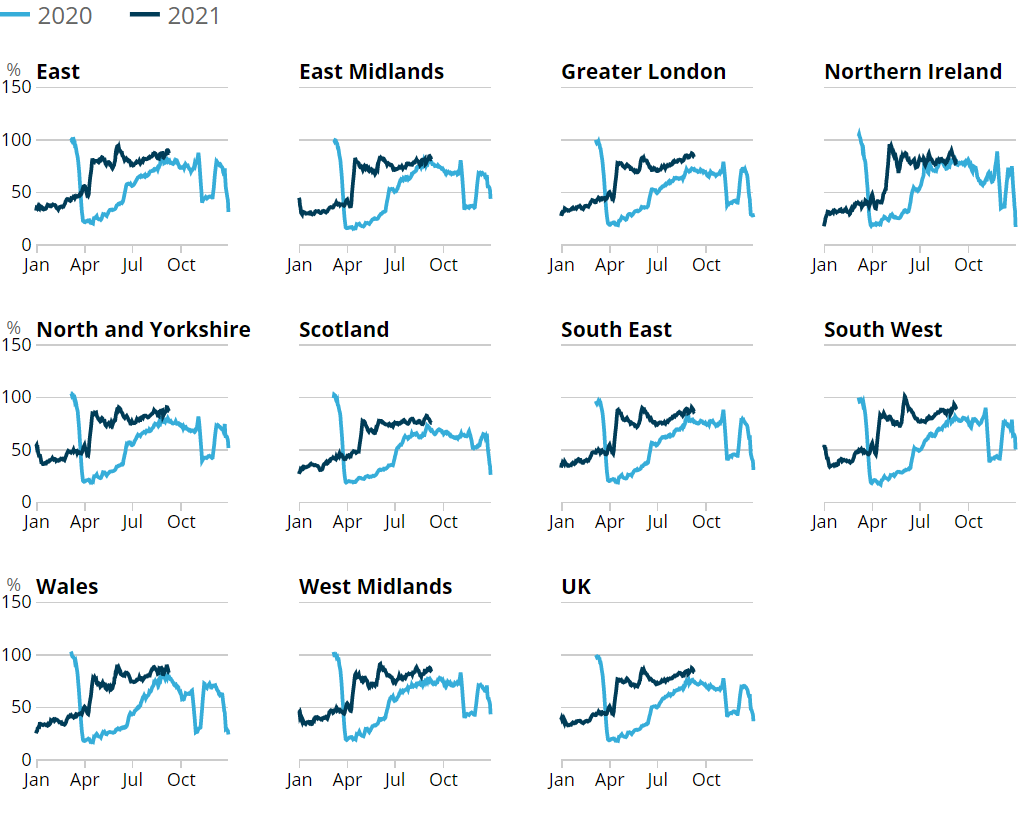
According to Springboard, in the week to 11 September 2021, retail footfall saw week-on-week percentage decreases in all 10 UK countries and English regions, the largest of which was in Wales, where footfall fell by 9% over the week, with the North and Yorkshire seeing the smallest fall of 2%.
In the same week, relative to the levels seen in the equivalent week of 2019, retail footfall was strongest in the South West at 88%. In contrast, retail footfall was weakest in Scotland and Northern Ireland, at 77% and 78% respectively of the level seen in the equivalent week of 2019.
Nôl i'r tabl cynnwys10. Shipping
A changeover in the systems used to collect these data has introduced a level shift in the data time series from 14 June 2021 onwards, and users should not make comparisons between data before and after this date. The data produced prior to the change, for 1 April 2019 to 13 June 2021, can still be compared within that period.
A full methodological review of our current method of data collection is underway and data may be subject to revision once this is complete. We will continue to update the accompanying dataset using the current method until the review is complete.
Figure 11: There was an average of 316 daily ship visits in the week to 12 September 2021, a 9% increase from 290 in the previous wee
Daily movements in shipping visits, UK, seasonally adjusted, 1 December 2019 to 12 September 2021
Source: exactEarth
Download this chart Figure 11: There was an average of 316 daily ship visits in the week to 12 September 2021, a 9% increase from 290 in the previous wee
Image .csv .xls
Figure 12: The average number of daily cargo ships visits in the week to 12 September 2021 was broadly unchanged for the third consecutive week
Daily movements in cargo shipping visits, UK, seasonally adjusted, 1 December 2019 to 12 September 2021
Source: exactEarth
Notes:
- The vertical line indicates the date when the data collection system changed. Users should not compare data before and after this date.
- See the accompanying dataset for notable dates and weather events.
- In the coming weeks, we will continue to review the seasonally adjusted estimates of shipping indicators data following its reintroduction with the discontinuity.
Download this chart Figure 12: The average number of daily cargo ships visits in the week to 12 September 2021 was broadly unchanged for the third consecutive week
Image .csv .xls11. Road traffic in Great Britain
According to Department for Transport (DfT) non-seasonally adjusted road traffic data, the volume of all motor vehicle traffic on Monday 13 September 2021 was at the same level seen on the Monday of the first week in February 2020.
Compared with the previous week (Monday 6 September 2021), traffic volume was unchanged for heavy goods and car vehicle traffic, at 109% and 96% of their level in the first week of February 2020, respectively. In comparison, the equivalent figure for light vehicle traffic was 112%, a 2 percentage point increase from the previous week.
Further data on traffic volumes as well as data on other modes of transport such as rail and tube are available from DfT.
Figure 13: The volume of motor vehicle traffic on Monday 13 September 2021 was at the same level in the first week of February 2020
Daily road traffic index: 100 = same traffic as the equivalent day of the week in the first week of February 2020, 1 March 2020 to 13 September 2021, non-seasonally adjusted
Embed code
Notes:
- The blue shaded areas refer to periods when restrictions across the UK were in effect.
Download the data
The daily DfT estimates are indexed to the first week of February 2020 and the comparison is with the same day of the week. The data provided are useful as an indication of traffic change rather than actual traffic volumes. More information on the methods, quality and economic analysis for these indicators can be found in the DfT methodology article.
Nôl i'r tabl cynnwys12. Data
UK spending on credit and debit cards
Dataset | Released 16 September 2021
Experimental indicator for monitoring UK retail purchases derived from the Bank of England's CHAPS data.
Shipping indicators
Dataset | Released 16 September 2021
Experimental weekly and daily ship visits dataset covering UK ports.
Traffic camera activity
Dataset | Released 16 September 2021
Experimental daily traffic camera counts data for busyness indices covering the UK.
Online job advert estimates
Dataset | Released 16 September 2021
Experimental job advert indices covering the UK online job market.
Company Incorporations, Voluntary Dissolutions and Compulsory Dissolutions
Dataset | Released 16 September 2021
Weekly dataset showing the number of Companies House incorporations and voluntary dissolutions accepted, and companies placed into compulsory dissolution.
Daily UK flights
Dataset | Released 16 September 2021
Experimental daily UK flight numbers and rolling seven-day average, including flights to, from, and within the UK
13. Glossary
Faster indicator
A faster indicator provides insights into economic activity using close-to-real-time big data, administrative data sources, rapid response surveys or Experimental Statistics, which represent useful economic and social concepts.
Company incorporations
Incorporations are when a company is added to the Companies House register of limited companies. This can also include where an existing business applies to become a limited company, where it was not one before.
Voluntary dissolution applications
A voluntary dissolution application is when a company applies to begin dissolution proceedings. As such, they effectively choose to be removed from the Companies House register. For a company to be eligible to voluntarily dissolve, it should not have completed any trading activity for a period of three months.
Compulsory dissolution
When a company fails to file the required financial accounts and/or confirmation statements, if no contact is received by Companies House following a series of letters to the company and its officers, a first gazette notice is published in the Gazette, a notice of the Registrar's intention to dissolve the company.
Nôl i'r tabl cynnwys14. Measuring the data
UK coronavirus restrictions
A full overview of coronavirus (COVID-19) restrictions for each of the four UK constituent countries can be found here:
These restrictions should be considered when interpreting the data featured throughout this bulletin.
Nôl i'r tabl cynnwys15. Strengths and limitations
Information on the strengths and limitations of the indicators in this bulletin is available in the Coronavirus and the latest indicators of the UK economy and society methodology.
Nôl i'r tabl cynnwys