1. Main points
Today’s (10 February 2017) data confirm that economic activity continued to expand at the end of 2016 – however, there was some variation across the headline industries.
Production output rose for the second consecutive month in December, a result of strong growth in manufacturing, especially in industries that produce pharmaceutical and metal products.
The trade balance improved slightly in December, with both goods exports and imports rising; there is little evidence that the fall in the value of sterling has had an effect on the trade balance – though changes in oil and other commodity prices have made this difficult to assess directly.
Construction output rose by 1.8% in December, following a 0.4% rise in November; over 2016 new housing output rose strongly (8.5%), while total repair and maintenance saw the second consecutive year of falling output.
2. Introduction and statistician quote
Economic activity continued to expand at the end of 2016, as gross domestic product (GDP) rose by 0.6% in Quarter 4 (Oct to Dec) 2016 (a rate unchanged from the previous 2 quarters and in line with longer historical trends). Calendar year growth for 2016 was 2.0%, close to the 2.2% growth seen in 2015, but some way below the average rate of calendar year GDP growth (2.9%) in the decade prior to the downturn in 2008.
The production and construction bulletins published alongside this article present revised information regarding economic activity in December 2016 – which was previously based on the early responses to the Monthly Business Survey. In addition the latest UK trade data provide the first estimate of goods and services trade in December.
It should be noted that retail sales and services output data – that complete the set of short term economic activity indicators - have already been published for December. However the December services growth figure is currently a provisional estimate based on early Monthly Business Survey (MBS) returns and forecast data.
The short term indicators show continued expansion of economic activity at the very end of 2016 – but with variation across the headline industries – as shown in Figure 1. Production activity rose by 1.1% in December following a 2.0% increase in November: manufacturing output recorded growth in both months. The value of exports rose at a faster rate than imports in Quarter 4, leading to a narrowing of the total trade deficit in the final quarter of 2016. Finally, construction output rose 1.8% in December and by 0.2% in the final quarter of 2016 – primarily a result of stronger commercial work in December and housing new work over the quarter.
The services industries (that collectively account for over 78% of economic output) saw growth of 0.8% in Quarter 4 2016; however, growth slowed between November and December. In addition the volume of retail sales – which saw very strong growth throughout 2016 – fell by 1.9% in December 2016, but still remained 4.3% higher compared with December 2015.
Commenting on today's short-term indicator figures, Senior ONS statistician Kate Davies said:
"The UK trade deficit narrowed to £8.6 billion in the final quarter of 2016 as exports of products including oil and aircraft to non-EU countries increased. There was also a notable increase in export sales of gold to overseas buyers. While both exports and imports grew over 2016, there remains little evidence that the weaker pound has had an effect on the trade balance.
"Industrial output and the construction sector both remained broadly flat over the final quarter of 2016 but grew in December, with manufacturing growth driven by a strong month for often volatile pharmaceuticals and the expansion in construction led by house and commercial building."
Figure 1: Summary of short-term indicators, Jan 2010 to Dec 2016, 2010=100, chained volume measures, seasonally adjusted
Jan 2010 to Dec 2016
Source: Office for National Statistics
Notes:
- Services data have been published in the Index of Services bulletin up to November 2016. Data for December were also presented in the preliminary estimate of GDP, but are based on early MBS responses.
Download this chart Figure 1: Summary of short-term indicators, Jan 2010 to Dec 2016, 2010=100, chained volume measures, seasonally adjusted
Image .csv .xls3. Trade
The overall UK trade deficit narrowed £0.3bn in December to £3.3bn, with monthly export growth slightly outpacing import growth (2.4% and 1.7% respectively). However, the growth in exports partly reflected a rise in “erratic” items that include ships, aircraft, valuables and non-monetary gold. Excluding these erratics, the trade balance widened slightly in December and over Quarter 4 (Oct to Dec) 2016 as a whole.
There has been substantial interest around the response of UK trade to the depreciation of sterling that occurred in the middle of 2016. While there is strong evidence that export and import prices have been affected by this, the effect on the trade balance and volumes more widely remains unclear. On a trade weighted basis, sterling depreciated 17.0% between the final quarters of 2015 and 2016, but despite this the latest data show little response, with the trade balance actually widening over the same period. However, this was a result of fairly large increases in the value of exports and imports (9.8% and 11.3% respectively).
Looking at the longer-run relationship between the UK trade balance and the Sterling Exchange Rate Index (ERI) shows little direct correlation over time. Figure 2 plots the quarter on year change in goods exports and imports, as well as the ERI. Between Quarter 3 (July to Sept) 2007 and Quarter 1 (Jan to Mar) 2009 the ERI depreciated by 25%, an effective average quarterly rate of 4.0%. This was a very sharp fall in sterling, more than reversing the appreciation of the later 1990s; however, the trade balance did not achieve a sustained improvement in the years that followed.
Figure 2: Quarter on year growth in goods trade and the sterling Exchange Rate Index, %
Source: Office for National Statistics
Download this chart Figure 2: Quarter on year growth in goods trade and the sterling Exchange Rate Index, %
Image .csv .xlsA number of wider factors might offset the expected effect of depreciation on the trade balance, including demand as well as relative prices. Moreover a high proportion of goods that UK firms export may be produced from intermediate goods with high import content. Recent ONS data confirm that firms have experienced higher imported material costs following the recent depreciation, and there is some evidence that this has fed through to output and export prices. This was set out further in previously published analysis.
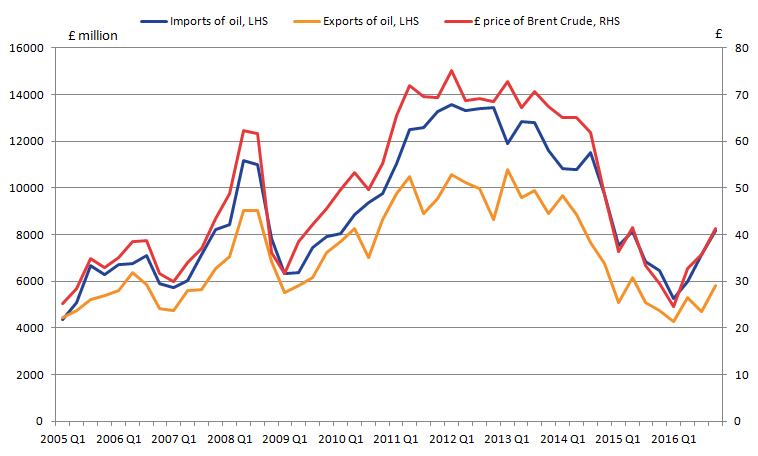
The effects are further complicated by the impact of sterling on the trade in oil balance. Figure 3 shows that the UK has been a net consumer of oil over the last decade, and that the value of oil exports and imports are both closely tied to the oil price. Consequently the rise in global oil prices in 2016, which follows low prices in 2015, are starting to act to widen the trade in oil balance again. In addition the recent depreciation in sterling has acted to push up the sterling price of Brent crude relative to dollar prices, which appears to be compounding this effect.
Figure 3: Trade in oil (£million) and Brent crude prices (£)
Source: Office for National Statistics, Financial Times
Download this image Figure 3: Trade in oil (£million) and Brent crude prices (£)
.png (43.0 kB) .xls (35.3 kB)
The December trade data also show which countries the UK exported to in 2016. Overall the value of goods exports rose by 4.9% in 2016, which was the highest growth rate seen since 2011. In recent years UK goods exports to non-EU countries have tended to rise on average at a faster rate compared to UK goods exports to the EU – however, in 2016 that trend reversed, with EU export growth outpacing non-EU export growth (7.8% and 2.4% respectively).
Figure 4: Contributions to goods export values by country, %
Source: Office for National Statistics
Download this chart Figure 4: Contributions to goods export values by country, %
Image .csv .xlsFigure 4 shows the cumulative contribution to growth in the value of goods exports since 2009. It shows that exports rose across all of the main country groupings between 2015 and 2016, with the greatest contribution to growth in 2016 coming from Germany, where exports rose 6.4%. Trade with a broad range of non-EU countries also increased, while exports to China and the US – the latter being our largest single trading partner – rose by 3.1% and 0.4% respectively. Looking at the period from 2009 to 2016 shows that non-EU economies have collectively accounted for 23.4 percentage points of the 31.7% growth, but EU trade still accounted for 48% of goods exports in 2016.
Nôl i'r tabl cynnwys4. Production
Previous analysis has shown that stronger export performance had been a key factor driving recent production growth. This trend has continued in the latest data: production output rose by a further 1.1% in December 2016, while manufacturing also increased by 2.1%.
Although gross domestic product (GDP) growth continues to be driven by services output, UK manufacturing growth improved in 2016 overall. Growth in the latest calendar year was 0.7%, higher than 2015 (negative 0.2%) and the average rate of calendar year growth in the decade prior to the downturn (0.3%). This occurred despite a number of possible headwinds, such as the fact that the IMF recently estimated that growth in world trade volumes was lower in 2016 (1.9%) compared with the previous year (2.7%).
UK manufacturing output also compares favourably across the G7 economies, when levels of activity are compared to those experienced in 2007 (shown in Figure 5). Germany is currently the only G7 economy to have exceeded pre-downturn levels of manufacturing output, while the remaining economies remain between 5.5% (US) and 20.6% (Italy) below 2007 levels. Following the rise in December UK manufacturing output is now only 2.3% below levels seen in 2007.
Figure 5: Level of manufacturing output in the G7 economies, 2007=100
Source: Office for National Statistics, Organisation for Economic Co-operation and Development
Download this chart Figure 5: Level of manufacturing output in the G7 economies, 2007=100
Image .csv .xlsFigure 6 shows that there has been a large variation in the growth of manufacturing by “main industrial groupings” – which splits goods into consumer, capital and intermediate goods. Growth in UK manufacturing has been predominantly driven by the production of capital goods since the downturn, with the level of output currently 10% above 2007 levels. Growth in this grouping has also broadly tracked that seen in Germany in recent years. The strong capital production data corroborate ONS data on UK capital acquisitions: in Quarter 3 (July to Sept) 2016 business investment volumes were 9.5% higher compared to 2007 levels.
In contrast the production of consumer goods has been subdued, with production remaining below 2007 levels. This suggests that a large proportion of household consumption, which has driven the expenditure measure of GDP growth in recent quarters, has been imported from abroad. UK production in intermediate goods, for use in the production process elsewhere has also not fully recovered from the economic downturn in 2008 to 2009.
Figure 6: Level of UK manufacturing output by main industrial grouping, 2007=100
Source: Office for National Statistics
Download this chart Figure 6: Level of UK manufacturing output by main industrial grouping, 2007=100
Image .csv .xls5. Construction
Construction output rose by 1.8% in December, following a 0.4% rise in November. Overall, output rose by 1.5% in 2016, a contrast to the strong growth seen in 2014 and 2015. Growth in December – which was driven particularly by private commercial work – brings the volume of output to slightly higher than that in December 2015.
Comparing the types of construction work between 2015 and 2016 shows a large range of outcomes. New housing has seen considerable strength over the 2016 calendar year (8.5% growth) while total repair and maintenance – which has historically grown at a slower rate compared to new work – has seen a second consecutive year of decline (albeit a small rate of contraction).
Looking more broadly over the post-downturn period shows that private housing new work has accounted for the vast majority of construction growth. Between 2010 and 2016, new private housing accounted for 9.3 percentage points of the 11.2% growth over the period. In addition the housing component of construction has been more volatile and sensitive to turning points in the economy: for example private housing output fell by 22.4% and 31.3% in 2008 and 2009 respectively, while total construction only fell 2.6% and 13.2% in the same years.
Nôl i'r tabl cynnwys