1. Main points
- Today’s (7 April 2017) data show that overall UK economic activity was relatively subdued in February, following strong growth across the headline industries at the end of 2016.
- Production output saw a slight fall of 0.7% in February, with relatively warm temperatures leading to a decrease in domestic energy demand and, subsequently, gas and electricity production. Despite the monthly fall, total production remains 1.6% higher on a 3 month on 3 month basis.
- The total trade deficit (goods and services) widened by £0.7 billion in February to £3.7 billion, reflecting both a 0.7% fall in export values and a 0.6% rise in import values.
- While construction output fell by 1.7% in February, the longer-term picture remains positive with the 3 month on 3 month figure showing positive growth for 4 consecutive months (1.5% in February).
2. Introduction and statistician quote
The three bulletins published alongside this article present new information on economic conditions in February 2017, with data available for output in the production and construction industries, as well as the trade balance. It should be noted that retail sales data for February and services output data for January – that complete the set of short-term economic activity indicators – have already been published. The new February data follows the final estimate of gross domestic product (GDP) for Quarter 4 (Oct to Dec) 2016 (released on 31 March), which showed that the UK economy grew by 0.7% in the quarter and 1.8% in 2016 overall.
The new estimates indicate that activity was relatively subdued across the headline industries in February, with output falls in both the production and construction industries adding to a broadly flat January outcome for the services industry – shown in Figure 1.
The decrease in production output (down 0.7%) was the second consecutive monthly fall and reflected decreases across all four production sectors, with the volatile energy supply and mining and quarrying sectors being the two largest contributors (down 3.4% and 2.0% respectively). Construction output also recorded a fall in February (down 1.7%), with a 1.2% rise in total repair and maintenance more than offset by a 3.3% fall in total new work. Despite the monthly falls, the underlying trend in both production and construction activity remains positive, with the 3 month on 3 month figures showing growth of 1.6% and 1.5% respectively.
The overall trade deficit (goods and services) widened by £0.7 billion in February to £3.7 billion, with exports falling by 0.7% and imports rising by 0.6%. However, looking at the underlying trade picture and excluding erratic commodities (ships, aircraft, precious stones, silver and non-monetary gold), the total trade deficit narrowed by £0.4 billion in February, to £2.5 billion.
In addition, previously released services data showed that output in the services industry remained broadly flat in January (down 0.1%), with a slowdown in the 3 month on 3 month growth figure since October 2016. The slowing in services growth has been primarily driven by a weakening in the distribution, hotels and restaurant component, which incorporates retail trade. Despite strong retail figures in February – all store types saw monthly growth in both quantity bought (volume) and amount spent (value) – recent underlying trends indicate a slowdown. Retail sales volumes recorded their weakest 3 month on 3 month growth since March 2010, with the largest contribution coming from food stores (accounting for 0.6 percentage points of the 1.4% fall).
Commenting on today's short-term indicator figures, Senior ONS statistician Kate Davies said:
“While manufacturing was broadly flat in February, unseasonably warm weather reduced gas and electricity use, pulling down overall production.
The overall trade deficit worsened, but excluding erratic items the picture improved as imports fell more than exports.
There were small falls across a range of construction subsectors for the second month running, following a record performance for the industry at the end of 2016.”
Figure 1: Summary of short-term indicators, Jan 2010 to Feb 2017, chained volume measures, seasonally adjusted
UK
Source: Office for National Statistics
Notes:
- Services data have been published in the Index of Services bulletin up to January 2017.
Download this chart Figure 1: Summary of short-term indicators, Jan 2010 to Feb 2017, chained volume measures, seasonally adjusted
Image .csv .xls3. Production
Production output fell by 0.7% in February 2017 following a fall of 0.3% in January and strong growth in November and December 2016. The monthly fall was broad-based across the four production sectors, with the energy supply sector (electricity, gas, steam and air conditioning) making the largest downward contribution of negative 0.3 percentage points. This can be attributed to relatively warm temperatures in February, leading to a decrease in domestic energy demand and, subsequently, gas and electricity production. The month of February saw the UK record its ninth warmest February since 1910 with a mean temperature of 5.3 °C, which is 1.6 °C above the 1981 to 2010 long-term average. Meanwhile, manufacturing contributed negative 0.1 percentage points to growth in production output with a monthly fall of 0.1%. However, the picture on a 3 month on 3 month basis for manufacturing is still one of strong growth, as the rate remains at 2.1%, the highest since May 2010.
Over the last 20 years, the energy supply sector (like other production sectors) has experienced relatively flat growth on average, growing at a compound average annual growth rate of 0.6% per year. However, the flat average growth hides what is historically a relatively volatile industry. One factor which could contribute to this volatility is deviations from average temperatures for the month, which may alter the energy demand of consumers and businesses compared with the same month in previous years.
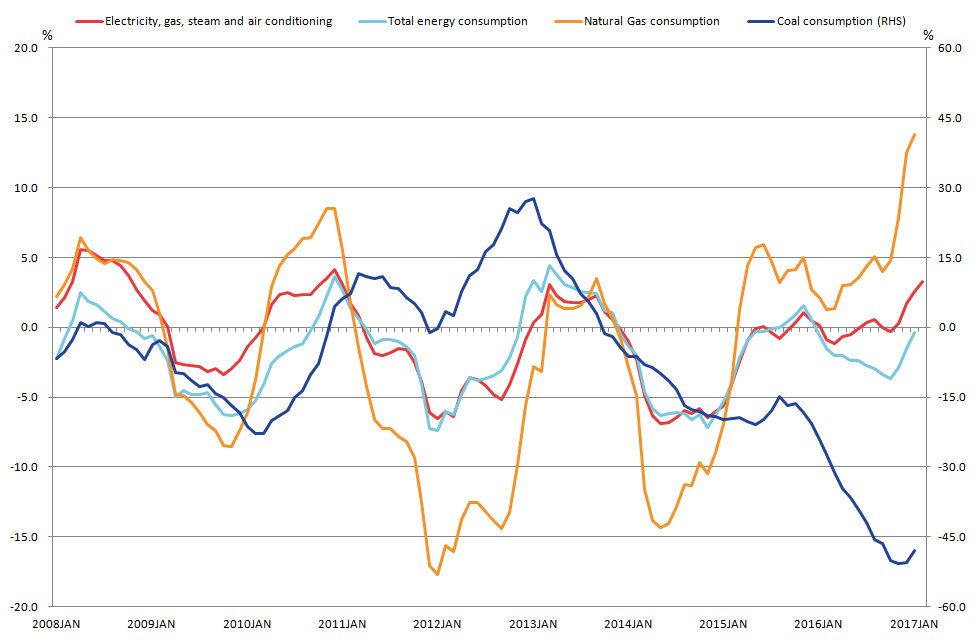
Figure 2 shows the relationship between growth in energy production and in the consumption of selected fuels used for electricity production and heating. Whilst production and total consumption track each other very closely, there has been a notable divergence over the past year, with growth in production outpacing consumption. This may be partially attributed to new gas fields coming online (most notably Lagann in mid-2016 and more recently Cygnus), to meet increased demand for gas to generate electricity instead of coal. On a 12-month on 12-month basis, natural gas consumption has been rising at a faster rate than total energy consumption since March 2015. Whilst the consumption of coal has been declining since October 2013, this decline has been particularly marked since the end of 2015, reaching negative 50.8% on the same basis in November 2016. A contributing factor to the increasing proportion of natural gas, rather than coal, in total energy consumption may be the introduction of the carbon price floor in April 2013.
Figure 2: 12-month on 12-month growth in energy production and consumption, Jan 1998 to Feb 2016, % change
UK
Source: Office for National Statistics and Department for Business, Energy and Industrial Strategy
Download this image Figure 2: 12-month on 12-month growth in energy production and consumption, Jan 1998 to Feb 2016, % change
.png (53.6 kB) .xlsx (17.7 kB)
4. Trade
The latest trade data reveal that the overall trade deficit widened by £0.7 billion in February, with total export values decreasing by 0.7% and import values rising by 0.6%. However, comparing the most recent 3 months (Dec to Feb) with the 3 months ending November 2016, the total trade deficit narrowed marginally by £0.3 billion, with growth in export values (3.1%) slightly outpacing growth in import values (2.7%). Goods export volumes have also remained strong to both EU and non-EU trading partners in recent months, increasing by 4.9% and 3.3% respectively on a 3 month on 3 month basis.
Excluding the erratic commodities, the underlying trade picture is similar to the aggregate. In the most recent 3 months, the total trade deficit excluding erratics has also narrowed slightly – by £0.5 billion – compared with the 3 months ending November 2016. Similarly, there has been recent strength in goods export volumes excluding oil and erratic commodities to both EU and non-EU countries, with an increase of 3.3% and 3.1% respectively on a 3 month on 3 month basis.
Trade prices continue to be heavily influenced by recent sterling movements. Goods export and import prices (excluding oil and erratic commodities) fell by 0.5% and 0.7% respectively in February compared with January, coinciding with sterling appreciating by 0.8% against a basket of currencies (Figure 3). Lower trade prices also coincided with a 0.4% fall in the total input price index (the prices manufacturers are charged for intermediate inputs used in the production process) and flat output price growth (the prices charged for finished manufactured goods) in the month to February.
Figure 3: UK export prices and import prices, Jan 1998 to Feb 2017
Source: Office for National Statistics
Download this chart Figure 3: UK export prices and import prices, Jan 1998 to Feb 2017
Image .csv .xlsIt is important to note that both export and import prices are those faced by UK exporters and importers respectively, denominated in sterling. This means that while UK export prices on a sterling basis have fallen, there may have been no change in the price when denominated in the currency facing the importer (who is buying UK goods and services). Figure 3 only shows aggregate movements in trade prices (both EU and non-EU trading partners). However, a larger proportion of goods exported to the EU are conducted in euros, rather than in sterling – 46% compared with 39%1. Similar to the aggregate picture, trade prices to the EU are also heavily affected by exchange rate movements against the euro, with a strong long-run relationship between export prices to the EU (excluding oil and erratic goods) and the sterling to euro exchange rate (Figure 4).
Figure 4: Export prices to the EU (less oil and erratics) and sterling to euro exchange rate, Jan 1998 to Feb 2017
Source: Office for National Statistics and Bank of England
Download this chart Figure 4: Export prices to the EU (less oil and erratics) and sterling to euro exchange rate, Jan 1998 to Feb 2017
Image .csv .xlsNotes for: Trade
- Weighted in September 2016.
5. Construction
Construction output fell by 1.7% in February 2017, following a flat January (revised up from a fall of 0.4%). The largest contributions to the monthly fall in February came from infrastructure (negative 1.0 percentage points) and private new housing (negative 0.6 percentage points). Despite the monthly fall, recent underlying trends remain strong, with the 3 month on 3 month figure for construction output showing positive growth for 4 consecutive months (1.5% in February).
Moreover, while February is the second consecutive monthly fall in private new housing output, it is a component that has grown particularly strongly since early 2013. As such, private new housing output remains at historically high levels in spite of the recent weakness. In addition, new build dwelling starts, which may lead new housing output, rose in Quarter 4 (Oct to Dec) 2016, suggesting that the sector remains robust.
Construction output and the labour market
Looking over a longer period, there is a strong correlation between total construction output (all work) and employment in the construction industry (measured by workforce jobs), as shown in Figure 5.
Figure 5: Construction output (all work) and construction employment (workforce jobs, employee jobs, self-employed jobs), Quarter 1 (Jan to Mar) 1997 to Quarter 4 (Oct to Dec) 2016
Great Britain
Source: Office for National Statistics
Notes:
- Workforce jobs = employee jobs + self-employment jobs.
Download this chart Figure 5: Construction output (all work) and construction employment (workforce jobs, employee jobs, self-employed jobs), Quarter 1 (Jan to Mar) 1997 to Quarter 4 (Oct to Dec) 2016
Image .csv .xlsFigure 5 shows that prior to the economic downturn of 2008 to 2009, construction output and total construction employment (workforce jobs) grew at broadly similar rates. During the downturn, both fell and have subsequently recovered. However, unlike output, construction employment has not returned to its pre-downturn peak.
In the construction industry, just under 40% of jobs are self-employed jobs (a proportion that has been gradually increasing from around 30% in 1998). Comparing the growth in employee jobs against self-employed jobs since their pre-downturn peaks, Figure 5 shows that employee jobs remain low while self-employed jobs have largely recovered.
Over this time period, the proportion of workers in the construction industry working part-time (both employees and self-employed workers) has remained broadly unchanged.
In terms of wages, over the last 15 years, growth in median weekly pay in the construction industry has broadly mirrored that of the wider economy, with median weekly earnings remaining around 20% higher than the average across all sectors.
Nôl i'r tabl cynnwys