1. Disclaimer
These research outputs are part of the faster indicators of UK economic activity project and are not official statistics. The indicators are still in development and not yet fully in production. We are making these data available at an early stage to invite feedback and comment on their further development.
Nôl i'r tabl cynnwys2. Main points from the latest data
The balance of the monthly Value Added Tax (VAT) indicators shows a mixed picture in April 2019.
In April 2019, the month-on-month VAT turnover diffusion index for the wholesale and retail trade was at its highest level (0.17) since April 2015. A positive diffusion index value means that the number of firms who had higher turnover in April 2019 than March 2019 was greater than the number of firms who had lower turnover.
Only two of the monthly VAT indices are below their long-term average values. These are the month-on-month and month-on-a-year-ago turnover diffusion indices for agriculture, forestry and fishing.
In March 2019, the average road traffic counts for larger vehicles were broadly stable, close to their average between 2016 and 2018.
In this release, we publish shipping indicators for October 2018 to March 2019 for the first time, using satellite-based ship tracking.
Ship traffic in ports was broadly stable over the period October 2018 to March 2019.
The time spent by ships in ports fell overall in the same period, with a slight recovery in March 2019; the shipping indicators are not seasonally adjusted.
We include three new ports in the shipping indicator dataset: Holyhead, Warrenpoint and Larne.
3. Data analysis
VAT heatmap and commentary
Figure 1: The balance of VAT indicators shows a mixed picture for April 2019, with only two of the monthly indices below their long-term mean values
Embed code
Figure 1 shows that there was a mixed picture for the monthly Value Added Tax (VAT) indicators in April 2019. Very few of the indicators are currently at values considerably different from their 2008 to 2018 averages (either dark teal or dark red). The monthly turnover diffusion indices for agriculture, forestry and fishing (month-on-month and month-on-a-year-ago) are the only monthly indices below their long-term mean values (light red).
The month-on-month (MoM) turnover diffusion indices for both the construction sector and the wholesale and retail sector increased in April 2019. The April 2019 level of this index for the construction sector is slightly above its 2008 to 2018 average (light teal) and the April 2019 level of the wholesale and retail index is considerably above its 2008 to 2018 average (dark teal). The levels of the month-on-a-year ago (MoY) turnover diffusion indices in April 2019 relative to their 2008 to 2018 averages are similar to the MoM turnover diffusion indices for each of these industrial sectors (the colour of the MoY turnover diffusion index for each industrial sector is the same as the colour of its MoM diffusion index in the heatmap). Only three industrial sectors (agriculture, forestry and fishing; construction; and wholesale and retail trade) have a sufficient number of reporters to be able to compile monthly diffusion indices within a month of the reporting period, which is April 2019 in this release.
The MoM turnover diffusion index for all industrial sectors combined increased slightly in March 2019 to a level slightly above its 2008 to 2018 average (light teal). This is the first publication of these data, as two months’ worth of data are required to create the all industrial sectors combined indices.
The quarterly diffusion indices are not yet available for Quarter 2 (Apr to June) 2019.
The number of new reporters was slightly above its average 2008 to 2018 level (light teal) in April 2019. The number of repayment claims fell in April 2019 to be close to its 2008 to 2018 average (light grey).
The heatmap is a useful visualisation tool to look across the indicators for a common signal. It can also help in identifying changes in particular indicators, which are of interest for further investigation. Figures 2 to 7 explore the VAT indicators further.
Figure 2: The month-on-month turnover diffusion index was positive for wholesale and retail trade in April 2019
Turnover and expenditure diffusion indices month-on-month and month-on-a-year ago for April 2019, seasonally adjusted, current prices, UK
Source: HM Revenue and Customs – Value Added Tax returns
Download this chart Figure 2: The month-on-month turnover diffusion index was positive for wholesale and retail trade in April 2019
Image .csv .xlsFigure 2 shows the latest monthly diffusion index values for April 2019 for three industrial sectors. These sectors are:
- agriculture, forestry and fishing
- construction
- wholesale and retail trade
Only these sectors can be published within one month of the end of the reporting period (April 2019 in this case), as there is an insufficient number of reporters in other industrial sectors so soon after the reference period. Monthly data to the end of March 2019 are available for the other industrial sectors in the dataset for this release.
The MoM turnover diffusion index for wholesale and retail trade was 0.17 in April 2019, which is strongly positive. This means that more wholesale and retail firms reported an increase in turnover between March 2019 and April 2019 than reported a decrease in turnover between the two periods. The MoY turnover diffusion index was also positive for this sector so more firms reported turnover increasing between April 2018 and April 2019 than reported turnover decreasing between these periods.
The MoM turnover diffusion index for agriculture, forestry and fishing was negative 0.08 in April 2019, which is weakly negative. This means that more agriculture, forestry and fishing firms reported a decrease in turnover between March 2019 and April 2019 than reported an increase in turnover between the two periods.
The MoM expenditure diffusion index for the construction sector was negative 0.19 in April 2019. This means more construction firms reported a decrease in expenditure than reported an increase, in April 2019 compared with March 2019. VAT expenditure data include intermediate consumption, investment in capital assets and inventories.
Figure 3: The month-on-month turnover diffusion index for all industries increased in March 2019
Turnover and expenditure diffusion indices month-on-month and month-on-a-year ago for all industrial sectors for January to March 2019, seasonally adjusted, current prices, UK
Source: HM Revenue and Customs – Value Added Tax returns
Download this chart Figure 3: The month-on-month turnover diffusion index for all industries increased in March 2019
Image .csv .xlsFigure 3 shows the latest monthly diffusion index values for January to March 2019 for all industrial sectors combined.
Analysis published in Faster indicators of UK economic activity: value added tax returns showed that monthly reporters are skewed towards firms reporting repayment claims, often from certain industries. While firms from all industrial sectors can contribute towards these indices, these biases mean that the sectoral distribution of firms in these “all industries” indices is not equal to that in the economy.
Despite this, the MoM turnover diffusion index for all industries in March 2019 has 37,700 firms contributing towards it in comparison with the MoM turnover diffusion indices for April 2019, where 200 firms contribute towards the agriculture, forestry and fishing index, 70 firms contribute towards the construction index and 120 firms contribute towards the wholesale and retail trade index. Monthly data to the end of March 2019 are available for other industrial sectors in the data spreadsheet. Each firm contributing to the indices has the same weight regardless of industry, turnover and size.
The MoM turnover diffusion index for all industries was 0.03 in March 2019, which is weakly positive.
Figure 4: The month-on-month turnover diffusion indices show levels relatively close to 0 in April 2019 for agriculture and construction
Month-on-month turnover diffusion indices, seasonally adjusted, current prices, January 2008 to April 2019, UK
Source: HM Revenue and Customs – Value Added Tax returns
Download this chart Figure 4: The month-on-month turnover diffusion indices show levels relatively close to 0 in April 2019 for agriculture and construction
Image .csv .xlsFigure 4 shows the volatility in the time series for the MoM turnover diffusion indices. The April 2019 value for the wholesale and retail trade index is high compared with the average.
The April 2019 MoM turnover diffusion index for wholesale and retail trade was at its highest level in April 2015. The MoM diffusion indices for the agriculture, forestry and fishing sector and the construction sector in April 2019 were around levels seen in recent months.
Figure 5: The month-on-month expenditure diffusion indices show levels relatively close to 0 in April 2019 for agriculture, and wholesale and retail trade, with construction lower
Month-on-month expenditure diffusion indices, seasonally adjusted, current prices, January 2013 to April 2019, UK
Source: HM Revenue and Customs – Value Added Tax returns
Download this chart Figure 5: The month-on-month expenditure diffusion indices show levels relatively close to 0 in April 2019 for agriculture, and wholesale and retail trade, with construction lower
Image .csv .xlsFigure 5 shows the latest values of the MoM expenditure diffusion indices in a historic context.
At negative 0.19, the MoM expenditure diffusion index for the construction sector in April 2019 was at its lowest level since April 2014. The MoM diffusion indices for the agriculture, forestry and fishing sector and the wholesale and retail trade sector in April 2019 were around levels seen in recent months.
Figure 6: Number of new VAT reporters increases slightly in April 2019
Number of new VAT reporters, seasonally adjusted, all industries, January 2007 to April 2019, UK
Source: HM Revenue and Customs – Value Added Tax returns
Download this chart Figure 6: Number of new VAT reporters increases slightly in April 2019
Image .csv .xlsFigure 6 shows the number of new VAT reference numbers appearing in the VAT returns data. This increased in April 2019 to 20,930 from 19,160 in March 2019. It is currently at its highest level since November 2018.
Figure 7: Number of firms reporting repayment claims decreased in April 2019
Number of repayment, re-input and replacement returns, seasonally adjusted, all industries, January 2007 to April 2019, UK
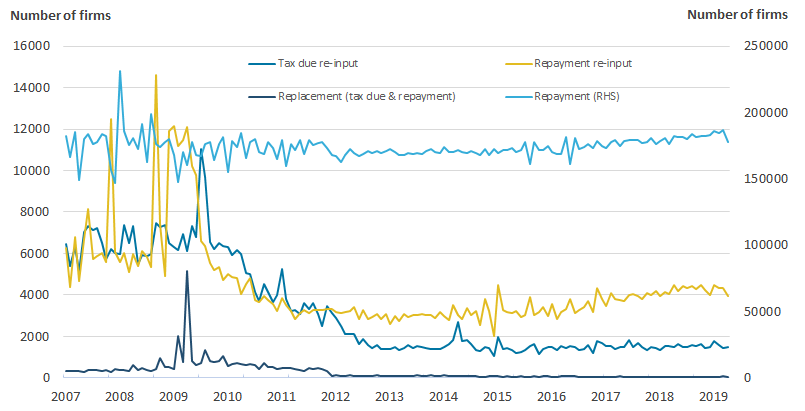
Source: HM Revenue and Customs – Value Added Tax returns
Download this image Figure 7: Number of firms reporting repayment claims decreased in April 2019
.png (36.7 kB) .xlsx (16.7 kB)
Figure 7 shows the number of some of the different record types reported to HM Revenue and Customs (HMRC) each month. The seasonally adjusted number of repayment claims was 177,530 in April 2019, a reduction from 186,620 in March 2019.
Road traffic commentary
In March 2019, for the two largest vehicle categories, those over 11.66 metres and those between 6.6 metres and 11.66 metres, the average 15-minute traffic count per sensor (seasonally adjusted) remained broadly stable.
We expect larger vehicles (over 6.6 metres in length, such as lorries) to be more closely related to the movement of goods, and so to trade in goods, than smaller vehicles (such as cars), and this is what was found in Faster indicators of UK economic activity: road traffic in England.
Figure 8: Traffic counts for the larger vehicles were broadly stable in March 2019
Road traffic counts by vehicle length, seasonally adjusted, January 2007 to March 2019, England. Vehicles over 11.66m in length and between 6.6m and 11.66m in length
Source: Highways England – Road traffic sensor data
Notes:
- The extreme values in August 2017 and March 2018 are the result of a large fall in the number of sensor counts in those months. They should be interpreted with care.
Download this chart Figure 8: Traffic counts for the larger vehicles were broadly stable in March 2019
Image .csv .xlsFigure 8 shows that the average traffic counts for larger vehicles were broadly stable in March 2019. Over a 15-minute interval at each sensor, in March 2019, there were on average 32.7 vehicles over 12 metres in length. For vehicles between 7 and 12 metres in length, the count was 21.1 in March 2019. There is a gap in the data between 31 December 2014 and 1 April 2015 when the method of data collection changed.
Shipping commentary
In this release, we publish shipping indicators for October 2018 to March 2019 for the first time, using satellite-based ship tracking. Over this period, ship traffic in ports was broadly stable, and time-in-port fell overall in the same period, with a slight recovery in March 2019. The shipping indicators are not seasonally adjusted. Time-in-port increased by 5.2%, and total traffic increased by 6.9% in March 2019.
In this publication, we use a different data source from that used for the time period July 2016 to August 2018. The new data source uses global satellite tracking. However, due to differences in data collection, there is a step change between the older time series published in Faster indicators of UK economic activity: shipping, and the data published in this release (and subsequent releases). The two time series should not be directly compared. See What has changed? in Section 5 for more details.
As discussed in Faster indicators of UK economic activity: shipping, we expect the shipping indicators to be related to the import and export of goods. The relationship with imports and exports, and caveats, are presented in more detail in that release.
Figure 9: Number of ships in ports increasing in March 2019
Number of ships in ports, not seasonally adjusted, October 2018 to March 2019, UK
Source: Orbcomm
Notes:
- Other includes: Milford Haven, Forth, Dover, Holyhead, Larne and Warrenpoint
Download this chart Figure 9: Number of ships in ports increasing in March 2019
Image .csv .xlsThe port traffic indicator remains relatively constant between October 2018 and March 2019, with a fall of 2.4% in the period. Over the same time period, the contribution by port remains reasonably stable, with London, and Grimsby and Immingham making the largest contributions, with over 40% of the total number of ships in ports in the dataset within these two ports.
Figure 10: Time-in-port increases in March 2019 after decreasing for the three months previously
Total time ships spend in ports (time-in-port), weeks, not seasonally adjusted, October 2018 to March 2019, UK
Source: Orbcomm
Notes:
- Other includes: Milford Haven, Forth, Dover, Holyhead, Larne and Warrenpoint
Download this chart Figure 10: Time-in-port increases in March 2019 after decreasing for the three months previously
Image .csv .xlsOver the time period October 2018 to March 2019, the time-in-port indicator trend was downward with a small recovery in March 2019.
Nôl i'r tabl cynnwys4. What are these data?
This release is part of the Faster indicators of UK economic activity project, led by the Data Science Campus. The project is delivering new, faster, indicators of economic activity constructed from novel data sources. These indicators are available up to one month in advance of official estimates of gross domestic product (GDP). The release includes indicators constructed from three datasets and this is the first timely release to include shipping indicators.
Indicators from HM Revenue and Customs (HMRC) Value Added Tax (VAT) returns:
- monthly diffusion indicators from turnover reported on VAT returns, January 2008 to April 2019
- quarterly diffusion indicators from turnover reported on VAT returns, January 2008 to March 2019
- monthly diffusion indicators from expenditure reported on VAT returns, January 2013 to April 2019
- quarterly diffusion indicators from expenditure reported on VAT returns, January 2013 to March 2019
- VAT reporting types and new VAT reporters, January 2007 to April 2019.
Road traffic sensor data for England from Highways England:
- monthly average road traffic counts for England and English port areas, January 2007 to March 2019
- monthly average road speeds for England and English port areas, January 2007 to March 2019
Shipping indicators from Automated Identification Systems (AIS):
- a monthly count of the time spent in UK ports from August 2016 to March 2019
- a monthly count of ships in UK ports from August 2016 to March 2019
It is important to note that we are not attempting to forecast or predict GDP or other headline economic statistics here, and the indicators should not be used in this way. Rather, by exploring big, closer-to-real-time datasets of activity likely to have an impact on the economy, we provide an early picture of a range of activities that supplement official economic statistics and may aid economic and monetary policymakers and analysts in interpreting the economic situation. They should be considered as early warning indicators providing timely insight into real activities in the economy, and their potential impact on headline GDP should be carefully interpreted.
The VAT turnover and expenditure diffusion indices are constructed to have values between [negative 1 and 1], inclusive. If all firms report an increase in the latest period relative to the comparison period, the index would be 1. If all firms report a decline, the index would be negative 1. If an equal number grow and decline, the index would be 0.
A full description of the data, methodology and economic analysis, describing the time series, can be found in Faster indicators of UK economic activity and associated articles.
Nôl i'r tabl cynnwys5. Quality and methodology
What has changed?
VAT indicators
In this publication, we have improved the methodology for constructing the diffusion indices. This has led to minor revisions, but the overarching narrative has not changed.
For diffusion indices, the handling of firms that submit multiple returns about the same reporting period has been improved. For the quarterly diffusion indices, the handling of firms that switch stagger (that is, reporting pattern) was also improved. The most a previously published quarterly non-seasonally adjusted diffusion index, on the scale (-1.00,1.00), has changed is 0.03. The most a previously published monthly non-seasonally adjusted diffusion index, on the scale (-1.00,1.00), has changed is 0.06.
Shipping indicators
In this publication we have:
added three new ports to our dataset: Holyhead, Warrenpoint and Larne
used a new data source for tracking shipping.
Please note that the time series August 2016 to July 2018 should not be compared directly with the time series from October 2018.
In Faster indicators of UK economic activity: shipping, we analysed two years’ worth of Automated Identification Systems (AIS) data, from July 2016 to August 2018, for UK ports provided by the Maritime and Coastguard Agency (MCA). In this release, we move to data from ORBCOMM, accessed via the United Nations Global Platform, which will also be used for future updates. The ORBCOMM data uses satellites to track the position and movement of ships. The new dataset allows us to update the indicators more quickly and gives us access to global shipping information.
However, the change to the data source has resulted in a step change between the end of the MCA time series and the beginning of the ORBCOMM time series. This is because of the different (satellite compared with terrestrial) data collection methods.
For both port traffic and time-in-port indicators, the values derived from the new data source are consistently lower. As we currently have no overlapping period for the two data sources, we cannot carry out a full comparison between the two datasets. However, the underlying cause for the discrepancy could be due to the different methods of AIS data collection, which are terrestrial compared with orbital.
The early indications are that different data collection methodology results in different distributions for the captured message types and subsequently a discrepancy in the datasets. Therefore, the time series representing the August 2016 to July 2018 period, published earlier in March 2019, and October 2018 to March 2019, published in this release, should not be compared. At a later stage, when we have data from both data sources for overlapping periods, we will investigate the discrepancy in detail and will research a method for converting between them.
In addition to changes to the data source, in the series from October 2018, we have added three new ports: Holyhead, Warrenpoint and Large. Although these are a small fraction of the total for both shipping indicators, this will also contribute to discrepancies between the pre-August 2018 time series, and that from October 2018.
VAT indicators
Data source
The Value Added Tax (VAT) indicators are constructed from the VAT returns reported to HM Revenue and Customs (HMRC) by all VAT-registered firms. Details on who reports, the timing of reporting, and differences between the approach used for these indicators and the use of VAT returns in official statistics can be found in Faster indicators of UK economic activity: Value Added Tax returns.
Constructing the VAT diffusion indices
To construct the VAT diffusion index, all the firms that are in both the time period of interest (time, t) and the comparison period, for example, the previous month for month-on-month indices, are selected. Firms with 0 values in both periods are excluded. The index for each time period (t) is then constructed using the following formula:
Note that each firm is given equal weight. We do not adjust for the size of firms’ activity.
The formula ensures the indices fall in the interval [negative 1 to 1], inclusive. If all firms report an increase in the latest period relative to the base period, the index would be 1. If all firms report a decline, the index would be negative 1. If an equal number grow and decline, the index would be 0.
Quality
There are four main quality considerations for the VAT indicators.
Although the number of firms included in the indicator is over 250,000 on average for the quarterly diffusion indicators, the earliest monthly diffusion indicators (month 1, MoM) contain fewer than 100 firms in some periods. The number of firms contributing to each indicator are included in the dataset.
Monthly reporters, used in the monthly diffusion indices, are not representative of the balance of firms across the economy, particularly those reporting in month 1 (within a month). The agriculture, forestry and fishing, construction, and wholesale and retail trade industries dominate the monthly returns in month 1. More generally it is possible that early-reporting firms reporting all frequencies may have different characteristics from firms reporting later, even in the same industry.
Changes to tax and collection policies may have an impact on the indices that are not related to the underlying economic climate.
The expenditure measure captures all expenditure that must be reported to HMRC for VAT purposes. This means that it is the sum of intermediate consumption, investment in capital assets, and inventories. Care should be taken in interpreting which of these elements any changes should be attributed too.
Avoiding the identification of individual firms
Splitting the data by industry occasionally results in only a small number of firms left in the indices. In cases where fewer than 15 firms have reported in a particular component or sector, we suppress the entire series. In the event where only a single series is removed, we also remove the next smallest to prevent any derivation of the suppressed series from the total.
Figures are also rounded, to prevent possible inference of exact values. The diffusion index and percentage of new reporters are rounded to two decimal places, and the number of firms for any measure is rounded to the nearest 10.
It should be noted that for some indicators, although they meet these disclosure thresholds, the number of firms contributing can still be low, for instance below 100 firms, so caution is needed in interpreting the data.
Road traffic indicators
Data source
Average counts and average speed data for traffic on English motorways and major A-roads were obtained from Highways England’s TRIS dataset, which lists the roads covered. Traffic flow is measured by induction loop and radar sensors. The data can be split by four categories of vehicle length as follows:
- less than 5.2 metres – for example, cars, motorcycles
- 5.2 metres to 6.6 metres – for example, panel vans, minibus
- 6.6 metres to 11.66 metres – for example, rigid lorries, buses
- greater than 11.66 metres – for example, larger rigid lorries and coaches, articulated lorries
Quality
For the road traffic indicators, there are three main issues which need to be considered when interpreting the data.
Individual sensors can drop out unexpectedly, due, for example, to road works or faults. The missing data can cause gaps in the time series and affect the average values. For example, if sensors drop out in an area of high traffic counts, the overall average will fall, making it difficult to interpret the time series. The total number of counts for each area is included in the dataset.
There was a change to the data collection methodology in 2015, which causes a step change in the time series. There may be biases in the positioning of the sensors, which could be preferentially deployed to areas of heavy traffic, and in recent years, to road sections requiring active traffic management.
Shipping indicators
Data source
The shipping indicators are computed from AIS data, which are available from different data providers. For the period of July 2016 to August 2018, we have used a dataset provided by MCA. For the period of October 2018 to March 2019, we have used ORBCOMM data to shorten the lead time of the computation of the indicators. The ability to receive a live stream of AIS messages greatly improves the ability to produce the indicators within a short period of time.
Constructing the shipping indicators
After initial filtering, which removes the messages from ships that do not move more than a predefined threshold distance over a rolling period of six months, the rectangular geo masks, defined in Faster indicators of UK economic activity shipping, are used to mark the messages as originating from a list of UK ports. Then, through appropriate grouping and aggregation operations, the values of the “time-in-port” and “port traffic” indicators are computed for each.
In particular, the “time-in-port” indicator is computed for each specific port by summing all the periods between messages originating from within the port. The “port traffic” indicator is computed by counting the number of unique Maritime Mobile Service Identity (MMSI) observations that have originated within the port area and the particular period. Finally, the results from the computation are used to generate the charts.
Quality
A large number of corrupted messages have to be removed from the raw AIS data. Additionally, a high proportion of the MMSI identifiers report single or inconsistent messages. These must be removed before any sensible aggregations are possible. Also, some ships, like pilot vessels, spend most of their time in port. Removing all of the above messages is based on the presumption that active ships must travel a certain distance over a certain period of time. The specific filter rule that is used in computation of the indicators is that ships must move by more than 0.5 degrees in a combination of latitude and longitude over a period of six months.
Different AIS data providers use different methods for AIS data collection. This inconsistency results in different properties of the data distributions and noise patterns in the datasets, which makes them incompatible. There was a change in the data provider for October 2018 to March 2019, which caused a step change in the time series.
Gaps in the data represent a significant problem for accurate aggregations. As the number of received messages should be relatively constant (hour, day, week, month), monitoring the number of incoming messages in each period is used to detect and identity gaps in the data.
Avoiding the identification of individual ships
The two shipping indicators are based on monthly aggregates. As many ships visit the ports over the month, it is considered that no individual ship data are disclosed through the indicators.
Seasonal adjustment
Seasonal adjustment for the VAT indicators was performed using the software X-13ARIMA-SEATS. The method of seasonal adjustment used is the X-11 algorithm. The parameters used in the March 2019 publication were fixed for this release.
The monthly road traffic series were seasonally adjusted using the standard JDemetra+ seasonal adjustment package, with default settings. In JDemetra+, missing values are treated as outliers whereas X-13ARIMA-SEATS does not handle missing observations.
This methodology and the new data have led to small changes in the seasonally adjusted series relative to the previous publication.
Further details
Full details of the data, quality, methodology and economic analyses can be found in Faster indicators of UK economic activity and associated articles.
Nôl i'r tabl cynnwys6. Feedback
We welcome feedback and comments on these indicators, including on presentation, further development or other data sources to investigate. Feedback can be sent by email to Faster.Indicators@ons.gov.uk.
Nôl i'r tabl cynnwys