1. Purpose of the test
We’re planning some changes for the 2021 Census. One of the biggest changes is that it will be mainly online for the first time. As part of the planning and preparation, from March to May 2017 we conducted a major field test in England and Wales. Census Test Day (the reference date) was 9 April 2017.
The test covered most of the systems and services required to run the data collection operation and tested approaches to find more efficient ways to get a response. We also used it to test a question on sexual orientation. Findings from the test will be taken forward in the 2019 Rehearsal.
The main objectives of the 2017 Test were to understand and assess:
options for maximising response though the timing of non-response follow up by a field force
methods for optimising self-completion through non-response reminder letters
methods for optimising self-completion through providing paper questionnaires
the effect on response and the quality of response, of including a question on sexual orientation
the provision and evaluation of an Assisted Digital service that supported respondents in completing their online questionnaire
field processes and the field work management tool
Some of the other objectives were to establish:
- the enumeration of communal establishments
- use of mobile devices in the field
- local authority engagement
- helpline and online help
- questionnaire, electronic questionnaire and question design
2. Design of the test
The 2017 Test involved a total of 208,000 households in England and Wales. We tested a number of different “treatments” to meet the test objectives.
Component one
Component one was conducted in seven local authority areas:
Barnsley Metropolitan Borough Council
Blackpool Borough Council
Powys County Council (Montgomeryshire) (Cyngor Sir Powys)
Sheffield City Council
South Somerset District Council
Southwark Council
West Dorset District Council
You can find more information about the selection of the seven areas in Summary of areas selected for census 2017 Test (774.41KB).
We chose these areas because they include:
a mix of rural and urban locations
some areas with a substantial student population
areas with a range of broadband coverage
areas with concentrations of ethnic groups
multilingual areas
We sampled 100,000 households and used a split sample design. This tested the following “treatments”:
a questionnaire with and without a sexual orientation question
non-response field follow-up starting 4 days and 10 days after Census Test Day
low, medium and high hard-to-count groups across the local authorities
Hard-to-count groups were constructed by combining two categories. These were the likelihood to self-respond (using previous census data we are able to identify groups that are typically harder to reach) and internet availability (using Ofcom data on broadband availability and take-up).
Component two
Component two was tested on a sample of 108,000 households drawn from across the whole of England and Wales. This included different modules of combined “treatments”, which were applied across a sample of hard-to-count groups. This sample was entirely separate from the one drawn from the seven areas.
The “treatments” that were combined into modules included:
a questionnaire with and without a sexual orientation question
first receiving either a paper questionnaire or letter inviting them to respond online
receiving the standard ONS-style letter and reminder letters or receiving an alternative developed by the Behavioural Insights Team
as the final reminder, receiving a letter to respond online or a paper questionnaire
receiving the initial contact letter three weeks or two weeks before the reference day
We also tested our “Assisted Digital” service in a small area on the Isle of Wight. Residents could visit libraries in four towns to get help completing the questionnaire.
Component three
A separate part of the test was the validation of communal establishment enumeration procedures. We tested procedures in a number of communal establishments, including university halls of residence, sheltered housing units and hotels.
Census Test Evaluation Survey
We carried out a Census Test Evaluation Survey (CTES) after the 2017 Test had finished. This was to provide further understanding of:
how do people feel about the inclusion of a question on sexual orientation?
why do some households not respond?
who is unwilling or unable to respond online?
It also included questions that had been included in the 2017 Test for the first time or had been redesigned. This allows us to understand the quality of answers to the questions in the test.
We carried out complete and valid interviews with 1,839 people who could be linked to their 2017 Test response. We also carried out interviews with 991 people who did not respond to the 2017 Test (either before or after the CTES sample was drawn).
Nôl i'r tabl cynnwys3. Response to the test
Across the test we achieved sufficient response to enable us to draw conclusions from our statistical tests. Table 1 shows the response rate for each test area. The 2017 Test was carried out without the full census machinery, that is, without responses being mandatory, without a comprehensive marketing and engagement strategy, and with field force only being used for part of the test. The response rates are comparable with other census tests in previous decades.
The response rates also reflect the relative differences between areas in the population’s tendency to respond. For example, Southwark which is urban, with a more diverse and younger population, has a lower response rate than Powys, which is rural and has an older population.
| Local Authority Area | Response Rate (%) |
|---|---|
| Barnsley | 47.3 |
| Blackpool | 38.6 |
| Powys | 53.9 |
| Sheffield | 42.5 |
| South Somerset | 52.2 |
| Southwark | 33.8 |
| West Dorset | 53.1 |
| Total | 42.7 |
Download this table Table 1: Percentage response rate for each area in the test
.xls .csv4. Testing initiatives to maximise response
This section describes what we did for each of the test objectives focused on optimising response and self-completion. This is important to support us enabling people to complete the census quickly and in the way that they want to. This can reduce the need for follow-up by a field interviewer and reduces costs.
Options for maximising overall response through field
For 100,000 households, treatments were designed to test whether starting field follow-up earlier was a cost-effective way of improving response rates. We started field follow-up either 4 days or 10 days following the test reference day (9 April 2017) to see whether starting earlier could increase final response rates.
The overall response rate for starting field follow-up on day 10 was 1.4 percentage points lower than when field follow-up was started on day 4. Starting field follow-up early had a statistically significant positive effect on response rates in the low and medium self-response hard-to-count groups. However, starting early is likely to be of little benefit to response rates for the more compliant households. Such visits may be premature and not a cost-effective option.
Households in both treatment groups had the same number of visits (up to a maximum of five) and there is no evidence of increased contact rates (face-to-face visits being achieved or “sorry I missed you” cards being delivered) for the households in the day 4 treatment. This implies that the increased response rate is genuinely due to the fact that the visits were earlier. We think that people respond more positively to early visits because they are less likely to have forgotten about their original invitation or to have lost their unique access code.
Our results demonstrate that starting field follow-up earlier increases response, but suggest that it may be most cost effective to start early in certain areas that are characterised by harder-to-count populations.
Methods for optimising self-completion through reminders
Some treatments were designed to test different reminder letters. For this test households were either sent no reminder letters, ONS-style reminder letters or reminder letters that the Behavioural Insights Team (BIT) created using “nudge” techniques. Some households were sent a paper questionnaire as their third reminder letter.
The BIT-style initial contact letter drew on principles of social norms, endowed progress and general costs (see Annex 1 for explanations of these techniques). BIT-style reminder letters used deadlines and conveyed that non-response was monitored. Both the BIT-style initial contact and reminder letters performed better than the ONS control letters, increasing the likelihood of completion by 5 percentage points.
Reminder letters were demonstrated to be effective in increasing response. Compared with no reminders, response rates increased by 13 percentage points (using the ONS-style reminder) and 22 percentage points (using the BIT-style reminder and a paper questionnaire as the third reminder). We are working to refine the BIT letters further as the use of these techniques has the potential to save money through reducing the need for non-response field follow up.
Methods for optimising self-completion through providing paper questionnaires
We tested the provision of paper questionnaires using a number of different treatments. For most households we monitored requests for paper questionnaires made either via the telephone helpline or field force. For some households we sent either a paper questionnaire or a unique access code as the initial contact. These treatments helped us to understand the impact on response rates and who is likely to require a paper questionnaire.
We found that some households are more likely to respond if sent a paper questionnaire. Table 2 shows the percentage response rates for the different treatment groups of the 2017 Test and the percentage completed online.
These findings will feed into our research on where and how to target the provision of paper questionnaires. The results below give us confidence of achieving our expected online response rate of 75%.
| Response Rate (%) | Of which online response (%) | |
|---|---|---|
| Online first, paper available on request or given in field | 43 | 84 |
| Paper first, no field follow-up | 39 | 30 |
| Online first, paper not available, no field follow-up | 23 | 100 |
| Online first, paper not available on request, but sent as 3rd reminder, no field follow-up | 33 | 55 |
Download this table Table 2: Percentage response rate and online response under each component in the 2017 Test, England and Wales
.xls .csvProvision and evaluation of an Assisted Digital service
We tried out an “Assisted Digital” service that was designed to help people fill in the questionnaire online. The Assisted Digital service was trialled on the Isle of Wight, where we invited 8,000 households to take part. Feedback was overwhelmingly positive. On the Isle of Wight, 139 of the 2,653 responses were completed in the libraries, raising the response rate by 1.7 percentage points.
We will make Assisted Digital help available in the 2021 Census. We will do further research into where people are content or willing to go to get help, and what we can do to take help to them. We will explore more innovative and “easy to reach” ways to provide face-to-face help where necessary.
Nôl i'r tabl cynnwys5. Sexual orientation question
The 2021 Census topic consultation identified a need for information on sexual orientation. To examine potential concerns around public acceptability, data quality and impact on respondent burden of a sexual orientation question, we developed a research and testing plan. This included the 2017 Test as one source of evidence.
One of the objectives of the 2017 Test was to find out the effect on response, and the quality of response, of including a question on sexual orientation in the census questionnaire (see Figure 1). There were two separate components of the test where the question was tested and half of the households in these components had questionnaires that included the sexual orientation question.
Figure 1: The paper questionnaire version of the sexual orientation question

Download this image Figure 1: The paper questionnaire version of the sexual orientation question
.png (84.7 kB)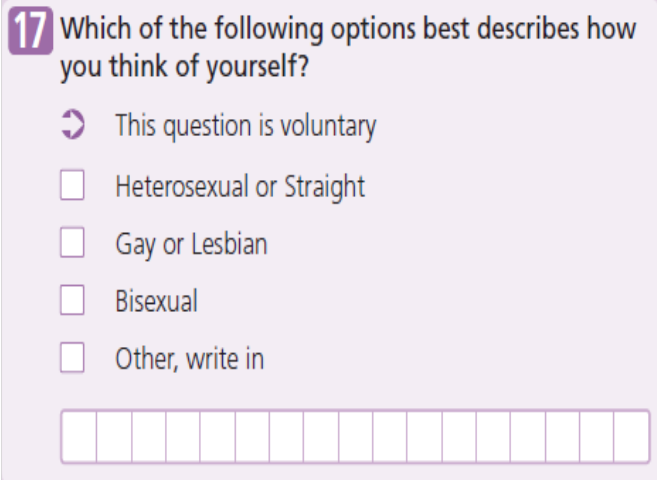
We have considered whether the question produces estimates that are comparable to the Annual Population Survey (APS). We have also calculated the percentage agreement rate for this question in the 2017 Test and the Census Test Evaluation Survey (CTES). In addition, we have considered whether the question itself has a high non-response rate and whether including the question has an effect on response rates for other questions.
Impact on overall response
A significant impact on overall response would drive up costs to recoup the drop in response and affect the overall quality of the census. Before the test, we decided that a maximum of 2 percentage points difference would be the highest drop in response that could be tolerated.
The overall response rate for those who received the sexual orientation question in either component of the test was 38.6%. It was 39.0% for people whose questionnaire did not include the sexual orientation question. This is a difference of 0.4 percentage points. Therefore, this is less than our maximum tolerance of 2 percentage points, which is consistent with thresholds set for testing of new sensitive questions in previous censuses.
Furthermore, we would be concerned if those who didn't respond because of the question had particular characteristics of the population. For example, from the test results we saw that older people were less likely to answer the sexual orientation question. However, the inclusion of a question on sexual orientation did not mean that they were less likely to respond to the questionnaire.
Quality of responses
It is also critical that we get a question that works and facilitates the collection of good quality data to meet user needs. Quality of response here is defined as the level of item non-response (those that responded to the 2017 Test but didn't complete the question), comparability with other sources (namely the APS), and agreement rates with the Census Test Evaluation Survey (CTES).
The level of item non-response for the sexual orientation question was 8.4% overall. This was 4.8% for those who responded online and 20.2% for those who responded on paper. This is likely due to an age bias in response. Our predefined threshold for this was less than 10%, which was set at roughly the level we’d expect for a voluntary question.
Table 3 compares the distribution of the population by their sexual orientation in the test and the APS. The population identifying as gay, lesbian or bisexual in the test (2.4%) was similar to the estimate in the APS (2.0%). The proportion of missing responses was higher in the test (8.4%) compared with the APS (4.1%). These differences may be due to the mode and higher levels of non-respondents in the test. We are testing an alternative version of the question with a “prefer not to say” option. If the “don’t know” and “missing” options are excluded then the distributions are very similar.
| 2017 Test (%) | APS (%) | |
|---|---|---|
| Heterosexual or straight | 88.7 | 93.4 |
| Gay or lesbian | 1.8 | 1.2 |
| Bisexual | 0.6 | 0.8 |
| Other | 0.5 | 0.5 |
| Don’t know or refuse (APS ) / Missing (2017 Test) | 8.4 | 4.1 |
Download this table Table 3: Sexual orientation estimates in the 2017 Test and Annual Population Survey (APS) 2016
.xls .csvThe agreement rate between the responses provided for the sexual orientation question in the 2017 Test and the CTES was 98.6%. This is very high and suggests that the vast majority of those who responded answered accurately.
Impact on other questions
Comparing the item non-response rates for all the other questions, we can see that there is little or no difference between the two sample groups (those who received the sexual orientation questionnaire and those who received a questionnaire without the sexual orientation question).
Furthermore, the drop-off rate (people who stop completing the survey) at this question (less than 1 in 1,500 responses) is similar to that of other questions. This suggests that this question does not stand out compared with the other questions. In fact, the sexual orientation question had similar online drop-off rates to the ethnic group question. Both of these have lower drop-off rates than the religion and national identity questions.
Further work
Overall the results from the 2017 Test suggest that including a question on sexual orientation would not significantly impact overall response and that the quality of responses are of acceptable quality. Should we decide to recommend including this question, we have also identified some further work to improve quality, in particular to reduce non-response to the question on paper.
For example, our research shows that some members of the public may not have answered the question because they did not understand why the information was needed. Others stated that the information is personal and private. To address these issues, we would review the question guidance explaining the reasons for asking this question, and to reiterate messages about the confidentiality of their responses including that there is the option to complete a private individual form.
Nôl i'r tabl cynnwys6. Operation of main systems and services
We tested the preparation, delivery, collection, field follow-up, management information and security systems.
The operation of systems, largely developed in-house, worked effectively. The transmission of information between different systems was successful in:
enabling the public to respond
providing electronic updates to the field force
providing public requests to the contact centre and to our logistics team
Fieldwork management tool
An objective of the 2017 Test was to further explore the use of mobile technology by the census field force. By utilising technology there is potential to deliver savings to the cost of the operation in 2021 and to optimise field staff's ability to react to new census returns being submitted.
For the 2017 Test, field staff successfully used their own smart-phones and tablets to receive their lists of non-responding addresses to visit each day. No personal information was available on these devices. Field staff were then able to record the outcome of their visits and transmit them back to census headquarters (HQ) on the same day. This new information gave the HQ team the ability to track operational progress more effectively and drive up performance within the local teams.
The electronic fieldwork management tool (FWMT) provided much greater functionality than the paper forms used in previous years, cutting down on unnecessary visits to, and inconvenience for, households that had already responded. After the 2011 Census, an evaluation of census field operations looked at a sample of census enumeration record books. In this sample, 11% of the 206,981 visits occurred after there had already been a valid return from the household. During the 2017 Test, only 0.9% of the 220,824 visits were to households that had already submitted a valid household response.
Further improvements could be made if a lag were built in to delay any field visits to households that had received paper either on request, as a reminder, or as a result of a field visit, to allow for time for the response to be submitted. This, and other lessons from the 2017 Test, is part of the work we are taking forward to develop a FWMT for use in the 2021 Census.
Nôl i'r tabl cynnwys7. Annex 1: Behavioural Insights Team-style initial contact letter
The Behavioural Insights Team (BIT)-style initial contact letter drew on principles of social norms, endowed progress and general costs.
Social norms
We have a natural disposition to want to belong to social groups and act in ways that are likely to ensure our inclusion. This often means feeling compelled to behave like the other people who are part of the group. To tap into this principle, we included the following sentence in the Census Test advance letter: “More than 9 out of 10 people filled in the last census.”
Specific and general costs
BIT found that a text message stating the specific costs of a missed appointment to the NHS significantly reduced the number of missed hospital appointments. A more general message about costs was also effective but to a lesser degree. As it was difficult to accurately estimate the cost of not responding to the Census Test letter, we could not include a specific cost, so a general cost savings message was included: “Every census completed online saves taxpayers’ money.”
Endowment effect
Reframing tasks so that individuals perceive themselves as already having made progress towards a goal increases those individuals’ effort and persistence in achieving that goal. In the redesigned letter, we altered the three-step census completion process so that the first step was “Receive your internet access code”, including a checkmark next to this step. This was done to visually signal to respondents that they were already on the path to completing this goal.
Other changes
In addition, to ensure the purpose of the letter was as clear as possible, we only included essential content, used more white space between paragraphs, and made the text itself larger.
Nôl i'r tabl cynnwys