Yn yr adran hon
- Disclaimer
- Main points
- Things you need to know about this release
- Why are we doing this?
- Definitional differences and comparisons at national level
- Local authority level comparisons for number of rooms and bedrooms
- Occupancy ratings for rooms and bedrooms
- Summary and next steps
- Annex A: Methodology
- Annex B: Addresses by 2011 Census property type, top and bottom 10 local authorities for number of rooms
- Annex C: Addresses by 2011 Census property type, bottom 10 local authorities for number of bedrooms
1. Disclaimer
The Valuation Office Agency (VOA) data included in these analyses are NOT official statistics on the number of rooms, bedrooms or occupancy ratings1 in England and Wales. Rather they are published to allow users to compare the VOA data with the 2011 Census, as a potential alternative approach to collecting information on the number of rooms and bedrooms in the 2021 Census.
It is important the information and research presented are read alongside the analysis to aid interpretation and avoid misunderstanding. These analyses must not be reproduced without this disclaimer and warning note.
Notes for: Disclaimer
- Occupancy rating is defined as the difference between the number of rooms/bedrooms and the rooms/bedrooms required.
2. Main points
This is our first assessment of the Valuation Office Agency (VOA) dataset as a potential for replacing the questions on number of rooms and bedrooms on the 2021 Census questionnaire in England and Wales.
In this publication, we compare the VOA data and 2011 Census data on rooms and bedrooms for England and Wales and explain the impact on the resulting occupancy ratings.
Based on the initial analysis, it’s Office for National Statistics’ (ONS) view that with some further development, the VOA data are of sufficient statistical quality to replace one or both of the questions on rooms and bedrooms in the 2021 Census.
We’d like to get your feedback on our view through a consultation. It includes questions about the impact of using VOA data on rooms and bedrooms as an alternative to 2021 Census data. The evidence presented in this publication will help when you respond to the consultation.
More information on how we’ll use and evaluate your responses to the consultation is available. This may help you when you’re answering the questions.
The comparisons have been made at address level by linking 2011 Census and VOA records as at 2011, using the unique property reference number (UPRN1).
For the number of rooms, the direct agreement rate between the two sources is low at 16%. This is attributable to definitional differences between the 2011 Census and VOA, and respondent difficulty in answering the census number of rooms question accurately. A more relevant comparison can be made on the assumption that the VOA is at least one room smaller than census, where the agreement rate is 48%.
For the number of bedrooms, the direct agreement rate is much higher at 76%. Although there are also some definitional differences in the way bedrooms are counted on both sources, there is less impact than there is for the number of rooms.
The proportion of addresses considered to be overcrowded2 (on a bedroom basis) in the VOA data are 6% (1,346,659 addresses) compared to 5% (1,007,366 addresses) in the 2011 Census. This is because of definitional differences.
This assessment is the start of research into the potential of the VOA data. Over time, we’ll consider other variables on the VOA dataset, such as built age of property and property type. When linked with 2021 Census and other data, these have the potential to produce new outputs.
Notes for: Main points
- A unique property reference number (UPRN) is a unique alphanumeric identifier for every spatial address in Great Britain and can be found in Ordnance Survey’s address products.
- By the census definition, a household is considered to be overcrowded if it has an occupancy rating of minus 1 or less. That is, it has at least one bedroom too few for the number of people living in the household.
3. Things you need to know about this release
These analyses are NOT official statistics on the number of rooms, bedrooms or occupancy ratings in England and Wales. Census estimates of the number of rooms, bedrooms and occupancy ratings are usually produced for households. The 2011 Census defines a household as “one person living alone, or a group of people (not necessarily related) living at the same address who share cooking facilities and share a living room or sitting room or dining area”.
In the case of administrative data, including Valuation Office Agency (VOA) data, it isn’t currently possible to identify houses in multiple occupation (HMOs) from address information. Without additional information about the residents and the relationships between them, it’s difficult to tell when there are multiple households living at the same address.
The agreement rates between 2011 Census and VOA data for the number of rooms and bedrooms (and the resulting occupancy ratings for each) have been produced by linking address records across the 2011 Census data and VOA data. The agreement rates and all analyses in this report are, therefore, at address level.
We’ve also produced comparisons between the 2011 Census and VOA data at output area (OA) level. Further information on OAs can be found in the LA and OA analysis tool.
For information on how we linked the VOA and 2011 Census datasets to produce agreement rates for number of rooms and bedrooms, please see Annex A.
Nôl i'r tabl cynnwys4. Why are we doing this?
In 2016, we published our updated view on the topics proposed for inclusion in the 2021 Census (see the Housing Topic report). We identified there was a medium user need for data about number of rooms and bedrooms. We proposed that it wasn’t appropriate to continue to ask two questions on the census questionnaire designed to meet a single information need.
Additionally, the 2011 Census Quality Survey (CQS), which was used to assess the accuracy of responses to the 2011 Census, found quality issues with the number of rooms variable. The agreement rate between the CQS and the 2011 Census for the number of rooms question was relatively low at 67%. The survey found that differences occurred because respondents had misunderstood the question and the majority of these differences (93%) were within plus or minus one room.
We have explored administrative data as an alternative approach to provide information on number of rooms and bedrooms, with a view to potentially not asking one or both of these questions in the 2021 Census.
Before each census, the recommendation on the conduct and content of the census is published in Parliament in the form of a White Paper. The 2021 Census White Paper is expected to be published in 2018.
The recommendation regarding questions on the number of rooms and bedrooms will be based on:
- the potential of alternative (in this case) Valuation Office Agency (VOA) data to produce good quality estimates of the number of rooms and bedrooms
- your consultation feedback on the impact of using VOA data as a possible alternative to producing estimates of the number of rooms and bedrooms
5. Definitional differences and comparisons at national level
As with many administrative data sources, there are definitional, coverage, timing and data collection differences between the 2011 Census and Valuation Office Agency (VOA) data. It’s important for users to be aware of these differences when interpreting this comparative analysis.
Households and addresses
The 2011 Census defines households as:
“One person living alone, or a group of people (not necessarily related) living at the same address who share cooking facilities and share a living room or sitting room or dining area.”
“A household must contain at least one person whose place of usual residence is at the address. A group of short-term residents living together is not classified as a household, and neither is a group of people at an address where only visitors are staying.”
The focus on shared facilities in the census definition serves an important purpose in distinguishing between multiple households that occupy the same residential address. It’s often the case that there’s a one-to-one relationship between a household and an address. However, cases where multiple households occupy the same residential address are referred to as houses in multiple occupation (HMOs).
In the case of administrative data, including VOA data, it isn’t currently possible to identify HMOs from address information alone.
Number of rooms
The 2011 Census question asks respondents to count the number of rooms available for use only by their household. The definition for number of rooms in VOA data is the total number of “living” rooms, as reported by the “data collector”1. The differences between the two datasets for rooms that are included and excluded in the definitions are summarised in Table 1.
Table 1: Room types included and excluded in the 2011 Census and VOA
| Room type | Census | VOA |
|---|---|---|
| Bathroom* | Excluded | Excluded |
| Toilet* | Excluded | Excluded |
| Halls and landing* | Excluded | Excluded |
| Storage | Excluded | Included |
| Kitchen | Included | Excluded |
| Living room | Included | Included |
| Studies | Included | Included |
| Conservatories | Included | Excluded2 |
| Utility rooms | Included | Excluded |
| Bedrooms | Included | Included |
| Separate dining rooms | Included | Included |
| Dining areas within other rooms* | Excluded | Excluded |
| Source: Office for National Statistics | ||
| Notes: | ||
| 1. Room types marked with an asterisk are not included by both the census and the VOA. | ||
| 2. In the VOA dataset, conservatories are included as a separate variable. | ||
| 3. VOA - Valuation Office Agency. | ||
Download this table Table 1: Room types included and excluded in the 2011 Census and VOA
.xls (27.1 kB)The impact of this definitional difference is that for the majority of addresses, the number of rooms in the VOA will be at least one room less than that shown in the 2011 Census. This is because of the definitional difference regarding kitchens.
This definitional difference can clearly be seen at a national level in Figure 1.
Figure 1: Distribution of differences in number of rooms between VOA and 2011 Census, addresses in England and Wales
Source: Office for National Statistics
Notes:
- VOA – Valuation Office Agency.
Download this chart Figure 1: Distribution of differences in number of rooms between VOA and 2011 Census, addresses in England and Wales
Image .csv .xlsThe direct agreement rate between VOA data and the 2011 Census for the number of rooms at address level for England and Wales is low, at 16%. This is mainly attributable to the definitional differences between the two datasets. As outlined in this section, the main difference is that kitchens are included as one room in the census definition but not in the VOA definition. This means a more relevant comparison can be made on the assumption that the VOA data is at least one room smaller than census data.
It’s also important to note that the 2011 Census Quality Survey (CQS) (which was used to assess the accuracy of responses to the 2011 Census) found quality issues with the number of rooms question. The agreement rate between the CQS and the 2011 Census for the number of rooms question was relatively low at 67% (all other household questions had an agreement rate of over 88%).
The survey found that differences occurred because respondents had misunderstood the question. Additionally, some of the differences were because handwritten numbers on census questionnaires were incorrectly scanned or interpreted. For example, a handwritten number “6” may have been picked up as a “5” or vice versa. However, the majority of these differences (93%) were within plus or minus one room.
On this basis, the “agreement rate” should be considered as the aggregation of the categories where the number of rooms recorded on the VOA dataset is the same as that recorded on the census, or where the number of rooms recorded on the VOA dataset is one or two less than on the census, as shown in Figure 2.
Figure 2: Distribution of aggregated differences in number of rooms between VOA and 2011 Census, addresses in England and Wales
Source: Office for National Statistics
Notes:
- VOA – Valuation Office Agency.
- Aggregated differences in number of rooms are where VOA and census are the same, or where VOA is one or two rooms less than census.
Download this chart Figure 2: Distribution of aggregated differences in number of rooms between VOA and 2011 Census, addresses in England and Wales
Image .csv .xlsThe CQS also found that respondents in properties with four, five, six and seven rooms had the most difficulty in understanding the census definition of a room. A similar pattern can be seen in agreement rates between the 2011 Census and VOA datasets by room in Table 2. As the size of the address increases (in terms of number of rooms), the percentage of records that agree between the 2011 Census and VOA datasets decreases. This indicates that properties with fewer rooms are likely to have higher agreement rates than those with more rooms.
Table 2: Percentage of 2011 Census number of rooms by VOA number of rooms, addresses in England and Wales
| VOA number of rooms | ||||||||||
|---|---|---|---|---|---|---|---|---|---|---|
| Census number of rooms | 1 | 2 | 3 | 4 | 5 | 6 | 7 | 8 | 9+ | Total |
| 1 | 39.8 | 39.2 | 12.2 | 4.3 | 2.7 | 0.9 | 0.4 | 0.2 | 0.3 | 100 |
| 2 | 17.0 | 55.6 | 18.6 | 5.4 | 2.5 | 0.5 | 0.2 | 0.1 | 0.1 | 100 |
| 3 | 2.6 | 60.4 | 26.6 | 6.4 | 3.3 | 0.5 | 0.2 | 0.1 | 0.1 | 100 |
| 4 | 0.5 | 7.0 | 70.1 | 16.4 | 4.9 | 0.8 | 0.2 | 0.1 | 0.1 | 100 |
| 5 | 0.1 | 1.4 | 16.9 | 55.8 | 23.5 | 1.7 | 0.3 | 0.1 | 0.1 | 100 |
| 6 | 0.1 | 0.7 | 6.7 | 35.7 | 48.9 | 6.7 | 1.0 | 0.2 | 0.1 | 100 |
| 7 | 0.1 | 0.6 | 4.2 | 20.8 | 41.8 | 26.3 | 5.0 | 0.9 | 0.3 | 100 |
| 8 | 0.1 | 0.7 | 3.2 | 12.6 | 27.8 | 34.8 | 16.2 | 3.5 | 1.2 | 100 |
| 9+ | 0.1 | 0.8 | 2.7 | 7.1 | 15.3 | 23.8 | 24.2 | 14.3 | 11.8 | 100 |
| Source: Office for National Statistics | ||||||||||
| Notes: | ||||||||||
| 1. VOA - Valuation Office Agency. | ||||||||||
| 2. Rows may not total 100% due to rounding. | ||||||||||
Download this table Table 2: Percentage of 2011 Census number of rooms by VOA number of rooms, addresses in England and Wales
.xls (28.2 kB)Number of bedrooms
In the 2011 Census, a bedroom is defined as any room intended to be used as a bedroom when the property was built, or any room that has been permanently converted for use as a bedroom. It also includes all rooms intended for use as a bedroom even if it isn’t being used as such at the time of the census.
In the VOA data, bedrooms include rooms that are built as bedrooms, even if they aren’t being used as such. It excludes rooms incapable of comfortably holding a single bed (approximately anything less that 2m x 2m).
The 2011 Census Quality Survey (CQS) indicated that respondents found the number of bedrooms question easier to interpret than the number of rooms question. The agreement rates between the 2011 Census and CQS was very high at 91%, with 99% being within plus or minus one room. Scanning and respondent error were identified as reasons for differences but on the whole, respondents found this question easier to interpret than the number of rooms question.
The definitional differences for the number of bedrooms aren’t vastly different between the 2011 Census and VOA data, and the CQS showed that there is greater accuracy of the responses to this question. Therefore, direct agreement rates for the number of bedrooms are higher than they are for the number of rooms.
Figure 3: Distribution of differences in number of bedrooms between VOA and 2011 Census, addresses in England and Wales
Source: Office for National Statistics
Notes:
- VOA – Valuation Office Agency.
Download this chart Figure 3: Distribution of differences in number of bedrooms between VOA and 2011 Census, addresses in England and Wales
Image .csv .xlsThe direct agreement rate for the number of bedrooms between 2011 Census and VOA data (76%) is much higher than that for rooms. The CQS found that 99% of census responses were within plus or minus one room for the number of bedrooms. Therefore, the agreement rates between VOA and 2011 Census data can be considered as the aggregation of the categories where VOA is the same as, one bedroom less or one bedroom more than 2011 Census. This increases the agreement rate to 96%.
Coverage and quality of the data
The household response rate for the 2011 Census was 94% and the responses for the remaining 6% of households were estimated. In addition, 3% of responses to the number of rooms question were imputed due to the question not being answered. This means that, for a small proportion of addresses in this analysis, we’ve compared VOA data to imputed data. This will have affected the agreement rates slightly.
The information VOA collects and holds about domestic properties are in support of its statutory functions for valuation and maintenance of Council Tax lists2. It’s the statutory requirement of VOA to maintain accurate valuation lists for Council Tax and every effort is made to ensure the accuracy of the data.
However, VOA only collects data needed to place an accurate band on the property. Property attribute data is only updated where information comes to VOA’s attention that a valuation list entry might be inaccurate.
Considerable reliance is placed upon local authorities to notify VOA of any changes (including new builds, demolitions or alterations). There can be some variability in this process and lists are only updated when new information has been brought to VOA’s attention. Therefore, there are some records in the list that won’t have been updated as regularly as others.
Estimates for the coverage of VOA data aren’t currently available. The VOA supplements its information with other data sources3. However, the high match rate (94% of census address records – see Annex A) achieved between the 2011 Census and VOA data indicates the coverage of the VOA data are good for statistical purposes. Incomplete values for the number of rooms variable in the VOA data was lower than that for the 2011 Census, at only 1% of addresses.
Notes for: Definitional differences and comparisons at national level
- VOA data are checked and updated whenever VOA visit a dwelling or through their communications with billing authorities, builders, developers or the public.
- Local Government Finance Act (LGFA) 1992.
- In England and Wales, whenever VOA make a site visit to a dwelling, or through their communications with billing authorities, builders, developers or the public, every opportunity is taken to check and update the property details.
6. Local authority level comparisons for number of rooms and bedrooms
This section looks at the agreement rates between Valuation Office Agency (VOA) and 2011 Census data for number of rooms, number of bedrooms and occupancy ratings at local authority level. These analyses are based on the linked dataset (see Figure 14 in Annex A) at address level.
Number of rooms
Figure 4 shows that 216 (62%) local authorities have between 10% and 15% of addresses where the number of rooms is the same in the VOA data as it is in 2011 Census. The range of direct agreement is between 0% and 30%, compared with the national proportion of 16% (see Figure 1).
Figure 4: Local authority distribution by direct agreement rates between VOA and 2011 Census for number of rooms, addresses in England and Wales
Source: Office for National Statistics
Notes:
- VOA – Valuation Office Agency.
Download this chart Figure 4: Local authority distribution by direct agreement rates between VOA and 2011 Census for number of rooms, addresses in England and Wales
Image .csv .xlsThe 10 local authorities that have the highest direct agreement rates between VOA and 2011 Census records are shown in Figure 5.
Figure 5: Distribution of direct agreement rates by local authority (top 10) for number of rooms, addresses in England and Wales
Source: Office for National Statistics
Notes:
- VOA – Valuation Office Agency.
Download this chart Figure 5: Distribution of direct agreement rates by local authority (top 10) for number of rooms, addresses in England and Wales
Image .csv .xlsThe majority of records that agree between the VOA and 2011 Census data for number of rooms are in local authorities that contain higher proportions of terraced properties (Merthyr Tydfil, Merton, Rhondda Cynon Taf, Caerphilly, Waltham Forest and Greenwich) and purpose-built blocks of flats or tenements (City of London, Islington, Ealing and Tower Hamlets). For more information, please see Annex B.
As noted in section 5 (see Table 2), addresses with a smaller number of rooms have a higher agreement rate than those with more rooms. In smaller properties, it’s likely that there’s less room for error when counting the number of rooms. This is a possible reason for the agreement rates being higher for the previously mentioned local authorities.
Figure 6 shows the 10 local authorities with least agreement between VOA and 2011 Census data for number of rooms.
Figure 6: Distribution of direct agreement rates by local authority (bottom 10) for number of rooms, addresses in England and Wales
Source: Office for National Statistics
Notes:
- VOA – Valuation Office Agency.
Download this chart Figure 6: Distribution of direct agreement rates by local authority (bottom 10) for number of rooms, addresses in England and Wales
Image .csv .xlsThe majority of the local authorities with the lowest agreement rates in Figure 6 are in rural areas. These areas are likely to contain a larger proportion of bigger properties. For example, Mid Suffolk contains 41% detached properties (see Annex B). Such properties tend to have more rooms of the type where there are definitional differences between the VOA and census, such as storage rooms, conservatories and utility rooms (see Section 5, Table 1).
As shown in section 5 (see Table 2), addresses with more rooms have lower agreement rates than those with fewer rooms. It’s also known from the 2011 Census Quality Survey (CQS) that respondents in properties with four, five, six and seven rooms had the most difficulty in understanding the census definition of a room.
As outlined in the national analysis, the agreement rate can be considered as the aggregation of the categories where VOA data is the same, one room less or two rooms less than the 2011 Census data. Figure 7 shows how the rates improve when this is considered.
Figure 7: Local authority distribution by aggregated differences in number of rooms between VOA and 2011 Census, addresses in England and Wales
Source: Office for National Statistics
Notes:
- VOA – Valuation Office Agency.
- Aggregated differences are where VOA and census are the same, or where VOA is one or two rooms less than census.
Download this chart Figure 7: Local authority distribution by aggregated differences in number of rooms between VOA and 2011 Census, addresses in England and Wales
Image .csv .xlsApplying this logic at local authority level, agreement rates improve and range between 70% and 95%. The figure above shows that 162 (47%) local authorities have between 80% and 85% of addresses where the number of rooms recorded on the VOA dataset is the same as that recorded on the census, or where the number of rooms recorded on the VOA dataset is one or two less than on the census.
Number of bedrooms
As outlined in Section 5, the definitions for the number of bedrooms in VOA and 2011 Census data align quite closely and therefore agreement rates are higher, as shown in Figure 8.
Figure 8: Local authority distribution by direct agreement rates between VOA and 2011 Census for number of bedrooms, addresses in England and Wales
Source: Office for National Statistics
Notes:
- VOA – Valuation Office Agency.
Download this chart Figure 8: Local authority distribution by direct agreement rates between VOA and 2011 Census for number of bedrooms, addresses in England and Wales
Image .csv .xlsThe majority of local authorities have an agreement rate of between 75% and 80% for the number of bedrooms. As outlined in Section 5, the agreement rate can be considered as the aggregation of categories where VOA data is the same, one bedroom less or one bedroom more than the 2011 Census data. This is because the 2011 Census Quality Survey (CQS) found that 99% of census responses to the number of bedrooms question were within plus or minus one room. Figure 9 shows the agreement rates between census and VOA data when this is considered.
Figure 9: Local authority distribution by aggregated differences in number of bedrooms between VOA and 2011 Census, addresses in England and Wales
Source: Office for National Statistics
Notes:
- VOA – Valuation Office Agency.
- Aggregated differences in number of bedrooms are where VOA and census are the same, or where VOA is one bedroom less or one bedroom more than census.
Download this chart Figure 9: Local authority distribution by aggregated differences in number of bedrooms between VOA and 2011 Census, addresses in England and Wales
Image .csv .xlsThis shows that agreement rates improve even further. There are over 200 local authorities that contain between 95% and 100% of addresses where the number of bedrooms in VOA data is the same, one bedroom more or one bedroom less than in census.
Figure 10 shows the bottom 10 local authorities with the least direct agreement between VOA and 2011 Census data for the number of bedrooms.
Figure 10: Distribution of direct agreement rates by local authority (bottom 10) for number of bedrooms, addresses in England and Wales
Source: Office for National Statistics
Notes:
- VOA – Valuation Office Agency.
Download this chart Figure 10: Distribution of direct agreement rates by local authority (bottom 10) for number of bedrooms, addresses in England and Wales
Image .csv .xlsThe local authorities with the least agreement for the number of bedrooms between VOA and 2011 Census data tend to be in London and Wales. For the number of rooms (as previously mentioned) similar local authorities appeared in the top 10. These areas have a higher proportion of smaller properties (see Annex C) and, as shown in Section 5, agreement rates are higher between the VOA and 2011 Census data for addresses with a smaller number of rooms.
It’s likely that for smaller properties where space is limited, living rooms and other rooms are used as bedrooms. This means there’s confusion around the definitions of what should be counted as a bedroom in both the VOA and 2011 Census data. This results in low agreement rates for these areas, particularly because the VOA excludes rooms incapable of comfortably holding a single bed, whereas the census doesn’t define this.
Isle of Anglesey, Powys, Pembrokeshire, Isles of Scilly and Ceredigion have higher proportions of detached houses (see Annex C). It’s possible in these cases that use of a particular room is changing more frequently and not being captured accurately in either the census or VOA data. This results in lower agreements rates between the two datasets.
Nôl i'r tabl cynnwys7. Occupancy ratings for rooms and bedrooms
Information about the number of rooms and number of bedrooms is used across a range of sectors to understand overcrowding and under-occupancy. This informs decision-making through housing strategies and needs assessments.
An occupancy rating can indicate overcrowding or under-occupation within a household as follows:
- occupancy rating of zero – implies that a household has the precise notional number of rooms or bedrooms recommended by the room or bedroom standard, for the number and composition of people living within the household
- occupancy rating of minus 1 or less – indicates that a household has at least one room or bedroom too few for the number of people living in the household and is considered overcrowded
- occupancy rating of plus 1 or more – Indicates that a household has at least one room or bedroom more than is recommended for the number and composition of people living in the household and is considered under-occupied
Occupancy rating is defined as the difference between the number of rooms or bedrooms and the rooms or bedrooms required variable. Therefore, the formula to calculate occupancy rating is as follows:
Occupancy rating equals number of rooms and bedrooms subtract the number of rooms and bedrooms required.
The rooms or bedrooms required variable is calculated in accordance with age, sex and relationship composition of the census household.
Occupancy rating for rooms
Given the differences in definitions (see Section 5) between Valuation Office Agency (VOA) and census data for the number of rooms (mainly where the census includes kitchens and VOA doesn’t), an assumption can be made that the number of rooms in the VOA data are at least one room smaller than the number of rooms in the 2011 Census.
As mentioned previously, the number of rooms required is calculated in accordance with the age, sex and relationship composition of the census household. Therefore, the definition of the rooms required variable also includes kitchens.
The number of rooms required can’t be derived from VOA data. This is because information on the age, sex and relationship composition of the people at that address isn’t collected by VOA1. To calculate occupancy rating for rooms using VOA data, the following formula would have to be applied:
Occupancy rating (rooms) equals VOA numbers of rooms subtract number of rooms required (derived from census)
This means that the majority of addresses will generally fall within the “overcrowded” category when deriving occupancy rating for rooms from VOA data. Therefore, accurate conclusions from the analysis can’t be drawn.
Further research will be conducted to consider ways to produce more accurate and meaningful occupancy ratings for rooms using VOA data.
Occupancy rating for bedrooms
The definition for the number of bedrooms is more closely aligned between the VOA and 2011 Census data. The number of bedrooms required is calculated in accordance with the age, sex and relationship composition of the census household. The formula to calculate occupancy ratings for bedrooms from VOA data is as follows:
Occupancy rating (bedrooms) equals VOA number of bedrooms subtract number of bedrooms required (derived from census).
Table 3: Number of addresses by occupancy rating for bedrooms, 2011 Census and VOA, England and Wales
| 2011 Census | VOA | |||
|---|---|---|---|---|
| Occupancy rating (bedrooms) | Number of addresses | % | Number of addresses | % |
| Overcrowded (1 or more bedrooms too few) | 1,007,366 | 4.5 | 1,346,659 | 6.1 |
| Standard (zero) | 5,689,866 | 25.6 | 5,566,787 | 25.4 |
| Under-occupied (1 spare room) | 7,716,825 | 34.8 | 7,477,178 | 34.1 |
| Under-occupied (2 or more spare rooms) | 7,791,805 | 35.1 | 7,549,879 | 34.4 |
| Total | 22,205,862 | 100 | 21,940,503 | 100 |
| Source: Office for National Statistics | ||||
| Notes: | ||||
| 1. VOA - Valuation Office Agency. | ||||
| 2. Total values are lower than the number of linked records in the linked dataset between VOA and 2011 Census due to missing values for the number of bedrooms. | ||||
Download this table Table 3: Number of addresses by occupancy rating for bedrooms, 2011 Census and VOA, England and Wales
.xls (27.6 kB)Table 3 shows that 6% (1,346,659) of addresses are classified as overcrowded using the VOA data compared with 5% (1,007,366 addresses) for the 2011 Census data. Some of this difference can be explained by the definitional difference between the census and VOA data. For example, rooms incapable of holding a single bed are excluded from the number of bedrooms in the VOA dataset.
It must also be noted that the number of addresses in the overcrowded category is much smaller than those in the standard and under-occupied categories.
Overall, the distribution of addresses by occupancy rating for bedrooms between VOA and 2011 Census data are very similar.
Figure 11: Distribution of addresses by occupancy rating for bedrooms, 2011 Census and VOA data, England and Wales
Source: Office for National Statistics
Notes:
- VOA – Valuation Office Agency.
Download this chart Figure 11: Distribution of addresses by occupancy rating for bedrooms, 2011 Census and VOA data, England and Wales
Image .csv .xlsOvercrowding (bedrooms) at local authority level
The top 10 local authorities with the highest proportion of addresses in the overcrowded category are almost identical for both the VOA and 2011 Census in the linked dataset.
Table 4: Percentage of overcrowded (one or more bedrooms too few) addresses by local authority (2011 Census top 10), 2011 Census and VOA data
| Census number of addresses | Census % of addresses | VOA number of addresses | VOA % of addresses | |
|---|---|---|---|---|
| Newham | 23,067 | 24.7 | 24,682 | 28.2 |
| Brent | 17,409 | 17.7 | 21,791 | 22.1 |
| Tower Hamlets | 15,922 | 16.7 | 17,118 | 19.0 |
| Haringey | 14,046 | 16.1 | 16,820 | 19.4 |
| Southwark | 17,689 | 15.6 | 17,790 | 17.3 |
| Hackney | 13,798 | 15.5 | 16,057 | 19.1 |
| Waltham Forest | 12,605 | 14.6 | 15,857 | 18.6 |
| Ealing | 16,073 | 13.9 | 19,761 | 17.1 |
| Barking and Dagenham | 9,109 | 13.5 | 10,693 | 15.8 |
| Lambeth | 15,588 | 13.2 | 17,861 | 16.1 |
| Source: Office for National Statistics | ||||
| Notes: | ||||
| 1. VOA - Valuation Office Agency. | ||||
| 2. Barking and Dagenham is ranked 11th in the VOA data with 10,693 (15.8%) addresses with one or more bedrooms too few (overcrowded). | ||||
| 3. Hammersmith and Fulham is ranked 10th in the VOA data with 9,102 (15.9%) addresses with one or more bedrooms too few (overcrowded). | ||||
Download this table Table 4: Percentage of overcrowded (one or more bedrooms too few) addresses by local authority (2011 Census top 10), 2011 Census and VOA data
.xls (28.2 kB)The only local authority that didn’t appear in the top 10 in the VOA data was Barking and Dagenham. It ranked 11th with 10,693 (16%) addresses with one or more bedrooms too few (overcrowded).
Hammersmith and Fulham was ranked 10th in the VOA data with 9,102 (16%) addresses in this category. Although the percentages of addresses in the overcrowded category are slightly higher for VOA than they are for 2011 Census, Table 3 demonstrates that the number of bedrooms from VOA data measures overcrowding well when compared with the 2011 Census.
Notes for: Occupancy ratings for rooms and bedrooms
- The information VOA collects and holds about domestic properties is in support of their statutory functions for valuation and maintenance of Council Tax lists under Local Government Finance Act 1992.
8. Summary and next steps
Based on the comparisons highlighted in this report, we’ve found the Valuation Office Agency (VOA) data has:
- good coverage of addresses in England and Wales as (94% 2011 Census records matched to the VOA dataset (see Annex A))
- a direct agreement of 16% for the number of rooms between the VOA and 2011 Census datasets
- an agreement rate of 85% for rooms when adjustments are made for definitional differences and the quality of the census data (findings of the 2011 Census Quality Survey (CQS)); this is where VOA data are the same (16%), one room less (48%) or two rooms less (21%) than 2011 Census data
- a direct agreement rate of 76% with the 2011 Census for the number of bedrooms
- similar results for occupancy rating for bedrooms when compared with the 2011 Census
The definitional, timing and collection differences between the census and VOA data present us with some challenges in using the VOA data to produce estimates of the number of rooms and bedrooms for households. This is based on the historical definitions used by the census.
Based on the initial analysis, it’s our view that with some further development, the VOA data are of sufficient statistical quality to replace one or both of the questions on rooms and bedrooms in the 2021 Census.
We’d like to get your feedback on our view through a consultation. It includes questions about the impact of using VOA data on rooms and bedrooms as an alternative to 2021 Census data. The evidence presented in this publication can help you when responding to the consultation.
More information on how we’ll use and evaluate your responses to the consultation is available, which may help with your responses.
Our aim is to explore the potential of VOA data further to produce statistics on housing data more regularly in an Administrative Data Census context. We also aim to produce new outputs using additional variables, such as built age of property and property type.
Nôl i'r tabl cynnwys9. Annex A: Methodology
In summary, there are four steps to prepare the data to produce agreement rates between 2011 Census and Valuation Office Agency (VOA) data for the number of rooms, number of bedrooms and occupancy ratings (for rooms and bedrooms). These are:
- assigning a standardised unique identifier to addresses in each dataset (2011 Census and VOA) to enable linking of the two
- preparing the 2011 Census dataset
- preparing the VOA dataset
- linking the prepared versions of the above two datasets
Step one: assign address records in the VOA and 2011 Census data to a standardised unique identifier
To do this, we use the unique property reference number (UPRN1) that has been referenced to all residential addresses in England and Wales on AddressBase. The 2011 Census data hadn’t previously used UPRNs to identify individual addresses. We assigned UPRNs to addresses in the 2011 Census dataset using an automated matching methodology that links addresses to AddressBase. Geoplace assigned the UPRN to VOA records and these were included in the extract we received from VOA.
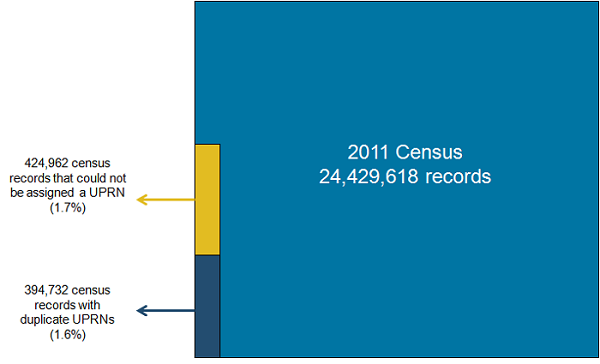
Step two: prepare the 2011 Census dataset
This involved removing census addresses that couldn’t be assigned a UPRN (2% of census records) and census addresses that had duplicate UPRNs assigned to them (2% of census records).
We used the census dataset after all adjustments for household non-response and question non-response had been applied. The dataset includes 24.4 million household spaces2 in England and Wales. This includes 96% of household spaces with at least one usual resident and 4% with no usual residents.
Figure 12 shows those removed from the dataset as a proportion to total census addresses.
Figure 12: Preparing the 2011 Census dataset for linkage
Source: Office for National Statistics
Notes:
- UPRN – Unique Property Reference Number.
- Image is not to scale.
Download this image Figure 12: Preparing the 2011 Census dataset for linkage
.png (35.0 kB) .xlsx (9.8 kB)Duplicate UPRNs in census data occurred if two or more different census addresses were assigned the same UPRN. An example of this might be where a ground floor flat and a first floor flat are assigned the same UPRN, but have different census address identifiers. This is likely to be due to matching error when address records in census are linked to AddressBase, as the method includes an element of probabilistic matching.
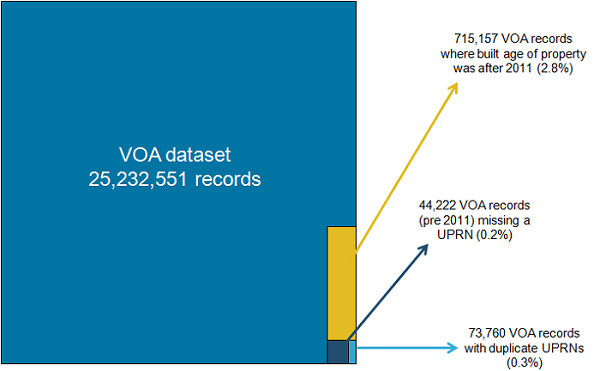
Step three: prepare the VOA dataset
Figure 13 shows the addresses removed from the original VOA dataset supplied to ONS, as a proportion of the total number of VOA addresses.
Figure 13: Preparing the VOA dataset for linkage

Source: Office for National Statistics
Notes:
- VOA – Valuation Office Agency.
- UPRN – Unique Property Reference Number.
- Image is not to scale.
Download this image Figure 13: Preparing the VOA dataset for linkage
.png (49.7 kB) .xlsx (9.8 kB)The VOA data extract provided to us reflects the period 1 April 1993 to 1 July 2016. To make the data as closely comparable to 2011 Census data as possible, we used the “built age of property” variable to filter the records to exclude those that were built after 2011 (3% of VOA records)3. Once we had done this, we removed records that hadn’t been assigned a UPRN by Geoplace (0.2%) and records with duplicate UPRNs (0.3%).
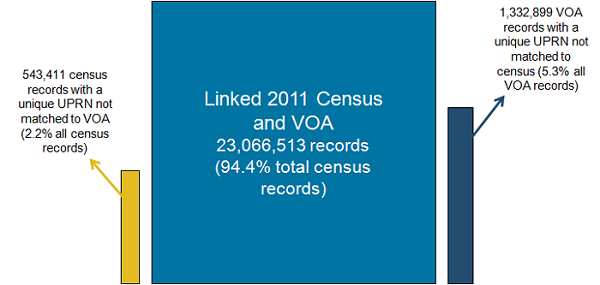
Step four: link the remaining 2011 Census and VOA records
Figure 14: Linking the 2011 Census and VOA datasets

Source: Office for National Statistics
Notes:
- VOA – Valuation Office Agency.
- UPRN – Unique Property Reference Number.
- Image is not to scale.
Download this image Figure 14: Linking the 2011 Census and VOA datasets
.png (57.9 kB) .xlsx (9.8 kB)Figure 14 shows that the linked dataset covers 94% of all 2011 Census records. This is the basis for the direct agreement rates of the VOA and 2011 Census data for number of rooms and bedrooms, and the resulting occupancy ratings discussed in the analysis.
We plan to carry out further research to understand more about the records that didn’t match between the 2011 Census and VOA data. Results from this research will help us to improve matching methods for the future.
Notes for: Annex A. Methodology
- A unique property reference number (UPRN) is a unique alphanumeric identifier for every spatial address in Great Britain and can be found in Ordnance Survey’s address products.
- A household space is the accommodation occupied by an individual household or, if unoccupied, available for an individual household.
- 2011 Census day was 27 March and the “built age of property” variable can only be filtered by year. Therefore, the VOA data are likely to include properties that were built after census day in 2011.
Efallai y bydd hefyd gennych ddiddordeb yn:
- Admin-based levels of overcrowding (using the bedroom standard and Valuation Office Agency number of bedrooms), feasibility research: England and Wales: January 2021
- Estimating the number of rooms in Census 2021: an update on deriving an occupancy rating from Valuation Office Agency number of rooms
- Estimating the number of rooms in Census 2021: an update on imputation methods for Valuation Office Agency data
- Future of population and social statistics
- Valuation Office Agency data
- 2011 Census Quality Survey
- Estimating rooms and bedrooms online consultation
- Estimating the number of rooms in Census 2021: an update on deriving an occupancy rating from Valuation Office Agency number of rooms