1. Disclaimer
These Research Outputs are not official statistics. Rather they are published as outputs from research into an Administrative Data Census approach. These outputs must not be reproduced without this disclaimer and warning note, and should not be used for policy - or decision-making.
Nôl i'r tabl cynnwys2. New analysis using administrative data
This is early research to demonstrate the new potential of an Administrative Data Census and whether it is feasible to produce household estimates from administrative data. This research is working towards providing estimates of household size. This builds on our previous publication on occupied addresses (households), which published the first estimates of the number of households from administrative data. That publication outlined the limitations in meeting a traditional definition of “household” using administrative data and found that the estimates of the number of households from administrative data were lower than census estimates.
This research investigates whether definitional differences could be corrected by using survey data to support the administrative data. We have produced estimates of household size directly using the approach from our first Research Outputs on households. We have also used a Structure Preserving Estimator (SPREE) method to combine the Annual Population Survey (APS) with the administrative data. The percentage estimates from the SPREE method are available for download. They have been produced for 2011 so that comparisons with 2011 Census data can be made.
This research finds that:
- the differences between the SPREE and the census estimates of household size were greater in areas with higher percentages of one-person households; further data may be required to support the estimates of one-person households, such as Council Tax data
- the differences between the SPREE and the census estimates of household size were greater in areas with large armed forces populations, due to armed forces personnel not being included in the administrative data that we have
- the differences between the SPREE and the census estimates of household size were greater in areas with larger numbers of houses in multiple occupation (HMOs) or bedsits; ongoing research into the identification of HMOs should improve these estimates.
- the differences between the SPREE and the census estimates of household size were greater in areas with more varied household size distributions
For more information on the APS quality and methodology, see the Annual Population Survey Quality and Methodology Information report.
Nôl i'r tabl cynnwys3. Things you need to know about this release
- These Research Outputs are not official statistics – they are published to demonstrate the type of analysis possible using administrative data.
- The term “households” refers to the estimates that have been produced for this report; these percentage estimates are actually based on the concept of “occupied addresses” from administrative data, which is different from traditional “household” definitions used in censuses and surveys – for a detailed explanation of the definitional differences between household and occupied address estimates, see Occupied address (household) estimates from Administrative Data: 2011 and 2015.
- The “household” estimates produced for these Research Outputs also include communal establishments (CEs) – CEs aren’t included in household estimates produced from censuses and surveys and our intention is to identify and exclude CEs from Research Outputs in future releases.
4. How have we determined household size?
In this report we have produced household size estimates using two methods:
- by combining the NHS Patient Register; the Department for Work and Pensions (DWP) Customer Information System; data from the Higher Education Statistics Agency; England and Wales school census data; “activity data” from the NHS, DWP and Her Majesty’s Revenue and Customs (HMRC); and aggregate statistics for home and foreign armed forces personnel from the Ministry of Defence into what we call a Statistical Population Dataset (SPD) V2.01; this is referred to as SPD estimates in this report
- a combination of the SPD and the Annual Population Survey (APS) 2011 using a Structure Preserving Estimator (SPREE) method; this is referred to as SPREE estimates in this report
The APS is assumed to have a more accurate distribution of household sizes than administrative data. Due to its limited sample size, the APS alone cannot be used to produce estimates of household size at a sufficiently low geographical level to meet user needs for small area, multivariate outputs. This research compares results from both methods to the 2011 Census data to see if an improvement is made by using the combined data approach.
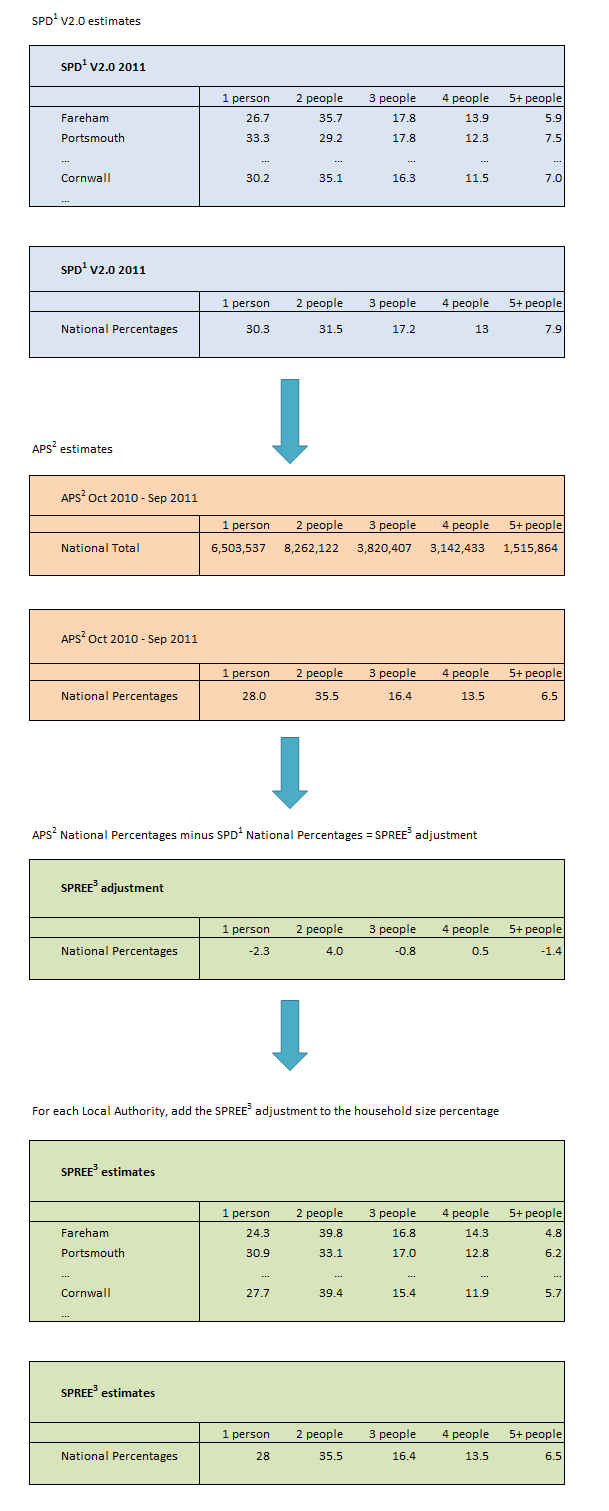
For the second method, where we combine the survey and administrative data, we have used a Structure Preserving Estimator (SPREE) method to produce household size estimates. This method uses the structure observed in the administrative data (in this case the SPD) and adjusts the estimates to more robust national distributions of household sizes produced from the APS. The SPD estimates are adjusted using the APS totals at national level (marginals), modifying the distribution between the household sizes, while maintaining the number of households in a local authority produced by the SPD, as shown in Figure 1.
Figure 1: Tables used in SPREE method to estimate household sizes, 2011
Source: Office for National Statistics
Notes:
- Statistical Population Dataset.
- Annual Population Survey.
- SPREE - Structure Preserving Estimator.
Download this image Figure 1: Tables used in SPREE method to estimate household sizes, 2011
.png (43.8 kB)
For example, SPD V2.0 estimates that nationally 31.5% of households consist of two people, while the APS estimates that 35.5% of households consist of two people. The SPREE adjustment to be applied is simply the difference between the two.
The greatest effect of applying the SPREE method is a reduction in the percentage of one-person households and an increase in the percentage of two-person households. A previous methodological paper contains further details on the SPREE approach.
The adjustments identified from the national totals (Table 1) are then applied to the SPD figures at local authority level. As the sample sizes of the City of London and Isles of Scilly local authorities are so small, the unadjusted counts from the SPD are used, rather than the modelled SPREE estimates.
| 1 | 2 | 3 | 4 | 5 plus | |
|---|---|---|---|---|---|
| Census | 30.2 | 34.2 | 15.6 | 13.0 | 7.0 |
| SPD1 V2.0 | 30.3 | 31.5 | 17.2 | 13.0 | 7.9 |
| APS2 | 28.0 | 35.5 | 16.4 | 13.5 | 6.5 |
| SPREE3 adjustment | -2.3 | 4.0 | -0.8 | 0.5 | -1.4 |
Download this table Table 1: Percentage of household sizes, census, SPD V2.0 and APS and resulting SPREE adjustment, England and Wales, 2011
.xls .csvNotes for: How have we determined household size?
- An SPD is a single, coherent dataset that forms the basis for estimating the size of the resident population using administrative data. This methodology was used in the first Research Outputs on occupied addresses (households).
5. What do the outputs show?
Where does the model perform best?
The indicator of good performance is the sum of the absolute size of all the differences in percentage estimates of household size categories1. For England and Wales, the total absolute difference of each method from the census is the same (5.4 percentage points).
The 10 local authorities where the Structure Preserving Estimator (SPREE) estimates of household size distribution are most similar to the 2011 Census estimates are shown in Table 2. These 10 areas are all in the South East or London. The 10 local authorities where the SPREE estimates of household size distribution are most different to the 2011 Census estimates are shown in Table 3. There is more variation in the regions for the areas in Table 3.
| Household Size | Total absolute percentage point difference | ||||||
|---|---|---|---|---|---|---|---|
| Local Authority | Region | 1 | 2 | 3 | 4 | 5 plus | |
| Waverley | South East | -0.2 | -0.1 | 0.5 | 0.3 | -0.5 | 1.6 |
| Cherwell | South East | -0.6 | 0.3 | 0.4 | 0.1 | -0.2 | 1.6 |
| Aylesbury Vale | South East | -0.1 | -0.2 | 0.8 | 0.0 | -0.5 | 1.6 |
| Woking | South East | -0.1 | -0.3 | 0.9 | -0.3 | -0.3 | 1.9 |
| South Oxfordshire | South East | -0.3 | -0.5 | 0.8 | -0.1 | 0.1 | 1.8 |
| Hackney | London | -0.8 | 0.0 | -0.2 | 0.6 | 0.4 | 2.0 |
| Kingston upon Thames | London | -0.9 | 0.0 | 0.1 | 0.9 | -0.1 | 2.0 |
| Surrey Heath | South East | -0.4 | -0.3 | 1.1 | 0.0 | -0.4 | 2.2 |
| Westminster | London | 0.4 | -0.9 | 0.4 | -0.2 | 0.2 | 2.1 |
| Maidstone | South East | -0.4 | -0.5 | 0.8 | 0.3 | -0.2 | 2.2 |
Download this table Table 2: Difference between the SPREE and census percentages for the 10 local authorities with the lowest total difference, by household size
.xls .csv
| % points difference | Total absolute percentage point difference | ||||||
|---|---|---|---|---|---|---|---|
| Local Authority | Region | 1 | 2 | 3 | 4 | 5 plus | |
| Hastings | South East | -6.7 | 2.7 | 1.1 | 2.7 | 0.3 | 13.5 |
| Blackpool | North West | -6.6 | 3.0 | 1.6 | 1.6 | 0.5 | 13.3 |
| Liverpool | North West | -6.5 | 2.1 | 2.3 | 2.0 | 0.1 | 13.0 |
| City of London | London | 0.3 | -5.9 | 1.1 | 1.4 | 3.1 | 11.8 |
| Isles of Scilly | South West | -1.6 | -4.3 | 2.4 | 0.2 | 3.4 | 11.9 |
| Fylde | North West | -5.4 | 2.5 | 1.4 | 1.3 | 0.2 | 10.8 |
| Nottingham | East Midlands | -3.8 | 2.5 | 1.3 | 1.6 | -1.5 | 10.7 |
| Preston | North West | -5.0 | 2.7 | 1.4 | 1.0 | -0.2 | 10.3 |
| Gwynedd | Wales | -4.5 | 2.8 | 1.8 | 0.5 | -0.7 | 10.3 |
| Shepway | South East | -4.5 | 2.4 | 0.9 | 1.8 | -0.5 | 10.1 |
Download this table Table 3: Difference between the SPREE and census percentages for the 10 local authorities with the highest total difference, by household size
.xls .csvThe differences between the SPREE estimates and the census estimates are greater in areas with higher proportions of single-person households, for example, Hastings, as shown in Figures 2 and 3. Hastings has higher than average percentages of single-person households; over 38% according to the 2011 Census compared with the national average of 29.7%.
Conversely, differences are smaller in local authorities where there are lower than average proportions of single-person households (27.8%), for example, in Waverley, as shown in Figures 4 and 5.
This could be due to address types in these areas that are hard to count, for example, bedsits and houses converted to flats, so that one-person and two-person households may be incorrectly grouped into a larger household. Hastings also has a lower percentage of two-person households in the Statistical Population Dataset (SPD) estimates than the census estimates, so the SPREE adjustment attempts to fit household sizes for one and two persons to the national distribution and moves the estimates further from the census estimates, as shown in Figures 2 and 3. Further discussion of this issue can be found in our previous publication on Occupied address (household) estimates.
Figure 2: Household size percentage estimates, Census, SPD V2.0 and SPREE, Hastings, 2011
Source: Office for National Statistics
Notes:
- SPD - Statistical Population Dataset.
- SPREE - Structure Preserving Estimator.
Download this chart Figure 2: Household size percentage estimates, Census, SPD V2.0 and SPREE, Hastings, 2011
Image .csv .xls
Figure 3: SPD difference from census percentages versus SPREE adjustment, Hastings, 2011
Source: Office for National Statistics
Notes:
- SPD - Statistical Population Dataset.
- SPREE - Structure Preserving Estimator.
Download this chart Figure 3: SPD difference from census percentages versus SPREE adjustment, Hastings, 2011
Image .csv .xls
Figure 4: Household size percentage estimates, Census, SPD V2.0 and SPREE, Waverley, 2011
Source: Office for National Statistics
Notes:
- SPD - Statistical Population Dataset.
- SPREE - Structure Preserving Estimator.
Download this chart Figure 4: Household size percentage estimates, Census, SPD V2.0 and SPREE, Waverley, 2011
Image .csv .xls
Figure 5: SPD difference from census percentages versus SPREE adjustment, Waverley, 2011
Source: Office for National Statistics
Notes:
- SPD - Statistical Population Dataset.
- SPREE - Structure Preserving Estimator.
Download this chart Figure 5: SPD difference from census percentages versus SPREE adjustment, Waverley, 2011
Image .csv .xlsLondon areas
London local authorities that have high percentages of one-person households do not seem to follow the same pattern as in areas such as Hastings. For example, Figure 6 for Kensington and Chelsea shows that the SPD estimates tend to have a higher percentage of one-person households and a lower percentage of two-person households compared with the census estimates. This could be due to people being included in the SPD estimates when they are actually short-term residents; or only one person in a couple being included on the SPD if the other is not interacting with the administrative data that we are using. The effect of the SPREE model adjustment moves the estimates closer to the census estimates, as seen in Figure 7.
Figure 6: Household size estimates, Census, SPD V2.0 and SPREE, Kensington and Chelsea, 2011
Source: Office for National Statistics
Notes:
- SPD - Statistical Population Dataset.
- SPREE - Structure Preserving Estimator.
Download this chart Figure 6: Household size estimates, Census, SPD V2.0 and SPREE, Kensington and Chelsea, 2011
Image .csv .xls
Figure 7: SPD difference from census percentages compared with SPREE adjustment, Kensington and Chelsea, 2011
Source: Office for National Statistics
Notes:
- SPD - Statistical Population Dataset.
- SPREE - Structure Preserving Estimator.
Download this chart Figure 7: SPD difference from census percentages compared with SPREE adjustment, Kensington and Chelsea, 2011
Image .csv .xlsArmed forces areas
When producing SPD population estimates, armed forces counts are added in at an aggregated level, as military personnel are required to register at base medical facilities, which are not included on the Patient Register. Therefore, as armed forces personnel are unlikely to be included in the record level administrative data, this is expected to result in larger differences in household size estimates for areas with high numbers of armed forces.
The model estimates for Richmondshire and Forest Heath (areas known to have a high count of armed forces personnel) show large differences from the census estimates across household sizes. The SPD estimates one-person households for Richmondshire and Forest Heath at 4.7 and 5.5 percentage points higher respectively than the census estimates, compared with all other local authorities in England and Wales, which are less than 3.6 percentage points above the census estimates.
Two-person households are lower than the census estimates for these local authorities, by 3.1 and 3.3 percentage points respectively. This is likely to occur when a member of the armed forces is registered with an Armed Forces GP and hence not on the SPD, but their partner registers with a non-Armed Forces GP, so the SPD counts a two-person household as a one-person household (see Figures 8 and 9).
Figure 8: Household size estimates, Census, SPD V2.0 and SPREE, Richmondshire, 2011
Source: Office for National Statistics
Notes:
- SPD - Statistical Population Dataset.
- SPREE - Structure Preserving Estimator.
Download this chart Figure 8: Household size estimates, Census, SPD V2.0 and SPREE, Richmondshire, 2011
Image .csv .xls
Figure 9: SPD difference from census percentages versus SPREE adjustment, Richmondshire, 2011
Source: Office for National Statistics
Notes:
- SPD - Statistical Population Dataset.
- SPREE - Structure Preserving Estimator.
Download this chart Figure 9: SPD difference from census percentages versus SPREE adjustment, Richmondshire, 2011
Image .csv .xlsWhat is the effect of the SPREE model on household size?
The effect of the SPREE adjustment can be seen in Table 4, which shows the percentage of local authorities whose household percentages fell within one percentage point of the census estimates. The SPD estimates for four-person households are closest to the census estimates and two-person households are furthest. The SPREE method brings estimates for two-, three- and five-plus-person households closer to the census estimates, but moves one- and four-person estimates further from the census estimates.
| % | ||
|---|---|---|
| Household size | SPD | SPREE |
| One person | 59.5 | 18.4 |
| Two person | 0.9 | 37.6 |
| Three person | 9.5 | 63.5 |
| Four person | 89.7 | 81.9 |
| Five plus people | 57.2 | 88.5 |
Download this table Table 4: Percentage of local authorities within one percentage point of census estimates, SPD compared to SPREE
.xls .csvThe proportions of one-person households in each local authority in 2011, according to the 2011 Census, ranged from 22.4% in Hart to 56.4% in the City of London (with a national average of 29.7%). This range may mean that adjustment to a national percentage potentially causes challenges. For 330 (94.8%) local authorities, the SPREE estimates have a lower percentage of one-person households than the census estimates (on average two percentage points below the census estimates).
Households of five plus show improved estimates from the SPD estimates. In areas where a high percentage of five-person households is expected, such as Newham (Figure 8), which has the largest percentage of five plus households according to the 2011 Census (20.8%), the SPREE estimates move even further away from the census estimates. This is despite the SPD estimates being close, as the distribution of households is most unlike the national distribution.
Figure 10: SPD difference from census percentages versus SPREE adjustment, Newham, 2011
Source: Office for National Statistics
Notes:
- SPD - Statistical Population Dataset.
- SPREE - Structure Preserving Estimator.
Download this chart Figure 10: SPD difference from census percentages versus SPREE adjustment, Newham, 2011
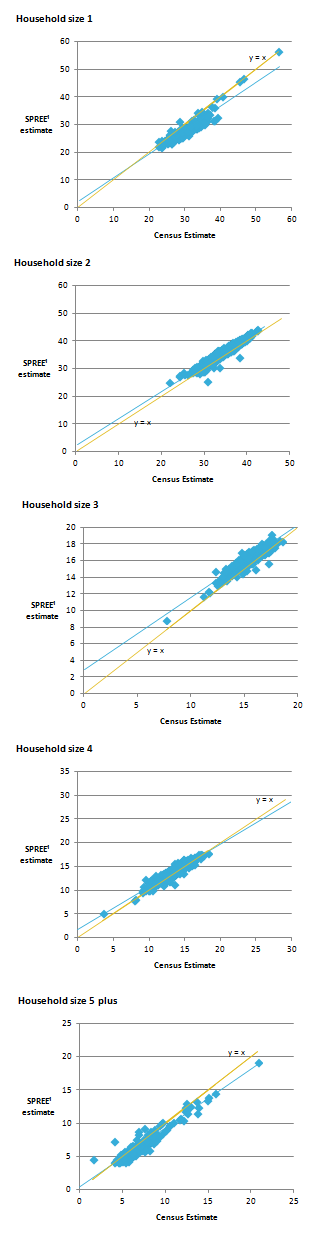
Image .csv .xlsFigure 11 shows the correlation between the SPREE estimates and the census estimates of household size proportions and the difference from the desired outcome of y equals x, where the estimates perfectly match the census estimates. One-person households are furthest from the census estimates, but have a larger range of values. Two-, three- and five-plus-person households show a strong correlation with the census estimates and have a smaller range of values.
Figure 11: Correlation between census estimates and SPREE estimates, household size percentages, 2011
Source: Office for National Statistics
Notes:
- SPREE - Structure Preserving Estimator.
Download this image Figure 11: Correlation between census estimates and SPREE estimates, household size percentages, 2011
.png (31.4 kB) .xls (142.3 kB)
Notes for: What do the outputs show?
- For example, Waverley has a total absolute percentage point difference of 0.2 plus 0.1 plus 0.5 plus 0.3 plus 0.5 equals 1.6, see Table 2.
6. Next steps
Improvements could be made if more data sources can be found that can support the distribution of household sizes, such as Council Tax. In particular, estimates of one-person households appear to be influenced currently by the lower proportion of one-person households on the 2011 Annual Population Survey (APS) compared with the 2011 Census; and the inherent issues with the raw administrative data where numbers of smaller households are underestimated and numbers of larger households are overestimated. If a population coverage survey was conducted to support Administrative Data Census outputs, particular care could be given to ensure representation of all household sizes.
Improvements in address matching are also anticipated to help these estimates. As we receive more administrative data, it is hoped that a higher percentage of records will be allocated a Unique Property Reference Number (UPRN) with a higher degree of accuracy. Also, more activity data could provide further current information about a person’s location, providing us with more confidence where there is conflicting information from data sources. Further research into the classifications of UPRNs can also help to add more certainty to the definition of a household, for example, to help exclude communal establishments, such as small care homes and students’ halls of residences.
In early 2018, the next household Research Outputs will be released, to demonstrate updated methodology and the possibility of using a coverage survey, along with household composition estimates using the Structure Preserving Estimator (SPREE) method detailed in this article.
Nôl i'r tabl cynnwys7. Feedback
We are keen to get feedback on these Research Outputs and the methodology used to produce them, including how they might be improved and potential uses of the data. Please email your feedback to Admin.Data.Census.Project@ons.gov.uk. Don't forget to include the title of the output in your response.
Nôl i'r tabl cynnwys