1. Main points
In May 2018, the quantity bought in the retail industry increased by 1.3% when compared with April 2018 with growth across all main sectors.
Feedback from retailers suggested that a sustained period of good weather and Royal Wedding celebrations encouraged spending in food and household goods stores in May.
The quantity bought saw a sharp increase to year-on-year growth in May at 3.9% when compared with April at 1.4%; due possibly to a combination of warm weather and slow year-on-year growth in May 2017 at 0.8%.
Non-store retailing showed strong growth in the quantity bought when compared with the previous year at 16.2%, the previous month at 4.5% and in the three months to May at 4.9%.
Online spending for food, department and clothing stores continued to increase, achieving new record proportions of online retailing in May at 5.8%, 17.4% and 17.6% respectively.
The proportion of online spending in clothing stores has grown at a much faster rate in the last 14 months, from 14.7% in March 2017 to 17.6% in May 2018.
2. Things you need to know about this release
This bulletin presents estimates of the quantity bought (volume) and amount spent (value) in the retail industry for the period 29 April 2018 to 26 May 2018.
Unless otherwise stated, the estimates in this release are seasonally adjusted.
The Retail Sales Index (RSI) measures the value and volume of retail sales in Great Britain on a monthly basis. Data are collected from businesses in the retail industry and the survey’s results are used to produce seasonally adjusted monthly, quarterly and annual estimates of output in the retail industry at current price and at chained volume measures (removing the effect of inflation). Unless otherwise stated, all estimates included in this release are based on seasonally adjusted data.
The RSI is an important economic indicator and one of the earliest short-term measures of economic activity. It is used in the compilation of the national accounts and widely used by private and public sector institutions, particularly by the Bank of England and Her Majesty’s Treasury to assist in informed decision- and policy-making.
Summary information can be found in the RSI Quality and Methodology Information report.
Nôl i'r tabl cynnwys3. Main figures for total retail sales
Table 1: Main figures: May 2018
| Seasonally adjusted, percentage change, Great Britain | ||||
| Most recent month on a year earlier | Most recent 3 months on a year earlier | Most recent month on previous month | Most recent 3 months on previous 3 months | |
|---|---|---|---|---|
| Value (amount spent) | 6.3 | 4.2 | 1.6 | 1.3 |
| Volume (quantity bought) | 3.9 | 2.1 | 1.3 | 0.9 |
| Value (excluding automotive fuel) | 6.1 | 4.2 | 1.5 | 1.5 |
| Volume (excluding automotive fuel) | 4.4 | 2.2 | 1.3 | 1.2 |
| Source: Office for National Statistics | ||||
Download this table Table 1: Main figures: May 2018
.xls (41.0 kB)In May 2018, both the amount spent (value) and quantity bought (volume) showed growth across all measures (Table 1). When compared with the previous month, the amount spent increased by 1.6% and the quantity bought by 1.3%.
When compared with a year earlier, the amount spent and quantity bought in May both increased at a faster rate at 6.3% and 3.9% respectively. Figure 1 shows the sharp increase to the year-on-year growth rate for the quantity bought when compared with earlier months.
Figure 1: Year-on-year growth rates in the quantity bought in all retailing, seasonally adjusted
Great Britain, January 2018 to May 2018
Source: Monthly Business Survey - Retail Sales Inquiry - Office for National Statistics
Download this chart Figure 1: Year-on-year growth rates in the quantity bought in all retailing, seasonally adjusted
Image .csv .xlsFigure 1 shows that the year-on-year growth rate for the quantity bought was relatively stable each month from January to April 2018, remaining under 2%. In May, we see stronger growth at 3.9%; a sharp year-on-year increase when compared with April at 1.4%.
Whilst the growth in May 2018 is strong, this is compared with a weak year-on-year growth of 0.8% in May 2017 as prices started to increase across all sectors.
Feedback from retailers suggests that a change to sustained warm weather following the adverse weather seen earlier in the year has seen increases in consumer spending in the current month. The Met Office also reported above average temperatures (Figure 2), stating that May was “provisionally the equal second-warmest May in a series from 1910”.
Figure 2: Year-on-year growth rates in the quantity bought in all retailing, seasonally adjusted, along with the average temperature
Great Britain, January 2018 to May 2018

Source: Monthly Business Survey - Retail Sales Inquiry - Office for National Statistics. Source 2: The Met Office
Download this image Figure 2: Year-on-year growth rates in the quantity bought in all retailing, seasonally adjusted, along with the average temperature
.png (14.2 kB) .xlsx (17.3 kB)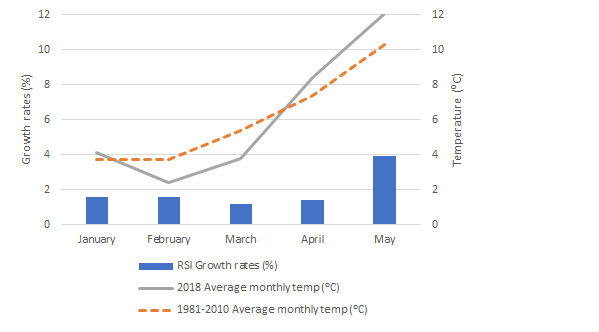
Figure 2 shows the year-on-year growth rates from January 2018 to May 2018 along with the average temperatures reported by the Met Office. As we began to experience warmer weather in April, temperatures rose to above average in May, which contrasts with the lower than average temperatures experienced in February and March. This shift to warmer weather may have encouraged consumers to spend later in the year.
Looking at the main store types, growth in May was seen across all retail sectors (Figure 3).
Nôl i'r tabl cynnwys4. Month-on-month contributions to growth
Figure 3: Contributions to month-on-month growth for the quantity bought and amount spent in the four main retail sectors, seasonally adjusted
Great Britain, May 2018 compared with April 2018
Source: Monthly Business Survey - Retail Sales Inquiry - Office for National Statistics
Download this chart Figure 3: Contributions to month-on-month growth for the quantity bought and amount spent in the four main retail sectors, seasonally adjusted
Image .csv .xlsAll main sectors contributed positively to the growth in retail sales in May 2018 when compared with April. Non-store retailing contributed most to the growth in the quantity bought at 0.5 percentage points.
Food stores provided a positive contribution to growth with supermarkets commenting on good sales in celebration of the Royal Wedding during good weather.
Nôl i'r tabl cynnwys5. Year-on-year contributions to growth
Figure 4: Contributions to year-on-year growth in the quantity bought and amount spent in the four main retail sectors, seasonally adjusted
Great Britain, May 2018 compared with May 2017
Source: Monthly Business Survey - Retail Sales Inquiry - Office for National Statistics
Download this chart Figure 4: Contributions to year-on-year growth in the quantity bought and amount spent in the four main retail sectors, seasonally adjusted
Image .csv .xlsWhen compared with the same month a year earlier, the main contribution to the quantity of goods bought came from non-store retailing at 1.5 percentage points in May. Non-food stores provided positive contributions to both the quantity bought and amount spent at 1.3 and 1.9 percentage points respectively. Within non-food stores, household goods stores saw the strongest growth (Table 2).
As the only sector to show no contribution to growth, petrol stations remained flat for the quantity bought, where the rising cost of fuel in May was the largest rise since April 2017 at 7.8%.
Table 2: Sector summary for non-food stores: May 2018
| Seasonally adjusted, Great Britain | |||
| Percentage change over 12 months | |||
|---|---|---|---|
| Quantity bought (volume) | Amount spent (value) | Index categories and their percentage weights | |
| Department stores | 2.9 | 3.7 | 8.6 |
| Textile, clothing and footwear stores | 0.5 | 2.0 | 12.0 |
| Household goods stores | 7.9 | 9.3 | 8.2 |
| Other stores | 3.0 | 4.2 | 12.8 |
| Total non-food stores | 3.2 | 4.5 | 41.6 |
| Source: Office for National Statistics | |||
Download this table Table 2: Sector summary for non-food stores: May 2018
.xls (42.0 kB)Household goods stores increased for both the quantity bought and amount spent by 7.9% and 9.3% respectively. DIY stores cover a range of garden and household goods and feedback from retailers suggested the warm weather had boosted sales in these areas.
Nôl i'r tabl cynnwys6. What’s the story in online sales?
Table 3: Summary of internet statistics: May 2018
| Value seasonally adjusted, percentage rates, Great Britain | ||||
| Category | Year-on-year growth | Month-on-month growth | Online sales as a proportion of retailing | Index categories and their percentage weights |
|---|---|---|---|---|
| All retailing1 | 19.9 | 5.2 | 18.0 | 100 |
| All food | 20.7 | 2.5 | 5.8 | 13.9 |
| All non-food | 23.7 | 3.2 | 14.0 | 34.9 |
| Department stores | 36.0 | 4.3 | 17.4 | 8.1 |
| Textile, clothing and footwear stores | 24.0 | 4.5 | 17.6 | 12.3 |
| Household goods stores | 12.8 | 4.3 | 11.6 | 6.3 |
| Other stores | 19.8 | -0.8 | 10.0 | 8.2 |
| Non-store retailing | 17.2 | 7.5 | 80.2 | 51.2 |
| Source: Office for National Statistics | ||||
| Notes: | ||||
| 1. All retailing refers to sales as a proportion of total retail sales. | ||||
Download this table Table 3: Summary of internet statistics: May 2018
.xls (43.5 kB)Internet sales increased by 19.9% for the amount spent in May 2018 when compared with May 2017, with all sectors showing strong year-on-year growth (Table 3).
Department stores continued to show strong online sales on the year, with an increase of 36.0%. This follows strong year-on-year growth in April 2018 at 26.2%.
The month-on-month picture was also one of growth across each sector except other stores, which saw a decline of 0.8%.
Online sales as a total of all retailing continued to increase at 18.0%. Online spending for food, department stores, and clothing and footwear stores continued to achieve new record proportions of online retailing at 5.8%, 17.4% and 17.6% respectively.
Figure 5 looks at online spending for food, department stores and clothing stores over time.
Figure 5: Internet sales as a proportion of all retailing, seasonally adjusted
Great Britain, January 2013 to May 2018
Source: Monthly Business Survey - Retail Sales Inquiry - Office for National Statistics
Download this chart Figure 5: Internet sales as a proportion of all retailing, seasonally adjusted
Image .csv .xlsAs shown in Figure 5, the proportion of online spending within food stores has remained relatively flat, with a slight and steady increase from 3.9% in 2013 to its current high of 5.8% in May 2018.
The proportion of online spending within department and clothing stores shows a more volatile series but with a similar trend of steady growth throughout 2013 to May 2017.
From mid-2017, the proportion of online spending within clothing stores has grown at a much faster rate, from 14.7% in March 2017 to 17.6% in May 2018, showing that consumers are purchasing more of their clothing items online in recent months.
To note, Figure 5 includes sales from stores in the food, department stores and clothing sector that trade online. Retailers in the non-store sector, that may also sell food and clothing, without a store presence, are not included here as they are captured in the non-store retailing sector.
Nôl i'r tabl cynnwys8. Quality and methodology
Our Monthly Business Survey (MBS) for retail sales measures output from the retail industry in Great Britain. It samples 5,000 businesses, with all businesses employing over 100 people or with an annual turnover of more than £60 million receiving an online questionnaire every month.
Further qualitative data or information and summary tables can be found in the attached datasets. This includes data on:
response rates
standard errors
revision triangle
distribution analysis
The Retail sales Quality and Methodology Information report contains important information on:
the strengths and limitations of the data and how it compares with related data
uses and users of the data
how the output was created
the quality of the output including the accuracy of the data