Cynnwys
- Main points
- Things you need to know about this release
- UK total manufacturers’ product sales increase
- Divisions driving the growth in 2016
- Half of the divisions reported a decline in sales in 2016
- Top 10 product sales in the UK in 2016
- UK manufacturers’ product sales revised upwards for 2015 and 2016
- UK manufacturing within the EU
- Links to related statistics
- What’s changed in this release?
- Quality and methodology
1. Main points
- The value of UK manufacturers’ product sales was £364.7 billion in 2016, a 1.8% increase on the 2015 total of £358.1 billion; this rise in sales is a reverse of the fall seen in 2015 and continues the trend since 2009.
- The value of UK manufacturers’ product sales of £364.7 billion in 2016 presents a mixed picture with half the divisions increasing and half decreasing; manufacturing of motor vehicles, trailers and semi-trailers experienced the largest increase between 2015 and 2016 of £6.2 billion (12.8%).
- Increases in manufacturers’ sales were also reported by divisions such as basic pharmaceutical products and pharmaceutical preparations (£1.7 billion or 15.5%), furniture (£512 million or 7.6%), chemicals (£503 million or 2.5%) and other transport equipment (£500 million or 1.8%).
- The manufacturing of machinery and equipment saw the largest decline between 2015 and 2016, decreasing by £905 million (3.7%) to £23.9 billion.
- In 2016 UK manufacturers’ sales make up approximately 8.8% of total EU sales, the fourth-largest producer behind Germany, Italy and France.
2. Things you need to know about this release
Prodcom covers product sales by UK manufacturers; this is not the same as UK retail sales, which refer to the sales of goods by retail businesses, or consumer purchases. Links to other manufacturing data sources are outlined in section 9.
All estimates of the value of product sales are presented at current prices, meaning that they have not been adjusted for inflation; this is important to bear in mind when comparing value changes over time.
For manufacture of basic metals (division 24), estimates for the manufacture of basic iron and steel and of ferro-alloys are not included in the overall UK Prodcom sales figures or in the divisional total due to an administrative source that cannot be published.
For coke and refined petroleum products (division 19), only one product – “pitch and pitch coke, obtained from coal tar or from other mineral tars” – is included, which is covered within a single industry (19100: the manufacture of coke oven products). Since 2015 there have been no businesses within the Prodcom population specifically classified to this industry.
Due to coverage, methodological, sample, or other differences, Prodcom estimates may not always match figures given in other manufacturing data sources. Details on the Prodcom survey methodology can be obtained from the Prodcom technical report while products covered can be found in the Prodcom list.
It is sometimes necessary to suppress figures for certain products to avoid disclosing information about an individual business. The Prodcom technical report describes the methods used to safeguard the information provided in confidence to us. In the same way, our commentary must also avoid disclosing information about individual businesses.
Prodcom estimates are designated as National Statistics, which means that the data have been produced in compliance with the Code of Practice for Official Statistics.
Nôl i'r tabl cynnwys3. UK total manufacturers’ product sales increase
Manufacturers’ sales have increased by £6.6 billion (1.8%) from the 2015 final estimates of £358.1 billion. This is above the level seen in 2014 of £362.5 billion, after the fall in 2015 (Figure 1).
This increase coincides with the rises shown in the ONS Annual Business Survey (ABS) as well as the Producer Price Index (PPI) and is mainly attributed to the motor vehicle division.
Figure 1: Total value of UK manufacturers’ product sales, 2006 to 2016
Source: Prodcom - Office for National Statistics
Notes:
- Care should be taken when comparing estimates prior to 2008 with those after 2008 due to the introduction of new industrial classifications.
Download this chart Figure 1: Total value of UK manufacturers’ product sales, 2006 to 2016
Image .csv .xlsSince 2009 manufacturers’ product sales generated a year on year increase totalling £64.9 billion (22.0%) with the exception of 2014 to 2015 when there was a decline of £4.4 billion, before increasing again in 2016. The two largest divisions, the manufacture of motor vehicles, trailers and semi-trailers, and manufacturing of food products, contributed more than half of this growth (56.0%) at £27.3 billion and £9.3 billion respectively in 2009.
Overall, between 2015 and 2016, total UK manufacturers’ sales have increased; primarily led by increasing sales of both petrol and diesel cars within the motor vehicle division, which showed a £6.2 billion increase, however half of the divisions within the manufacturing, mining and quarrying sector have seen a decrease.
Table 1: Contribution to growth and percentage change by division, 2015 to 2016, UK
| Manufacturing Division | 2015 (£b) | 2016 (£b) | change (%) | contribution to growth |
|---|---|---|---|---|
| Manufacture of motor vehicles, trailers and semi-trailers | 48.4 | 54.6 | 12.8 | 1.7 |
| Manufacture of basic pharmaceutical products and pharmaceutical preparations | 10.8 | 12.5 | 15.5 | 0.5 |
| Manufacture of furniture | 6.7 | 7.2 | 7.6 | 0.1 |
| Manufacture of chemicals and chemical products | 20.5 | 21.0 | 2.5 | 0.1 |
| Manufacture of other transport equipment | 27.8 | 28.3 | 1.8 | 0.1 |
| Manufacture of other non-metallic mineral products | 12.4 | 12.9 | 3.4 | 0.1 |
| Other manufacturing | 4.9 | 5.1 | 3.3 | 0.0 |
| Manufacture of rubber and plastic products | 19.2 | 19.3 | 0.6 | 0.0 |
| Manufacture of electrical equipment | 10.3 | 10.4 | 0.6 | 0.0 |
| Repair and installation of machinery and equipment | 14.2 | 14.3 | 0.3 | 0.0 |
| Manufacture of textiles | 4.2 | 4.2 | 0.5 | 0.0 |
| Manufacture of leather and related products | 0.7 | 0.7 | -0.7 | 0.0 |
| Manufacture of wearing apparel | 1.7 | 1.7 | -0.8 | 0.0 |
| Manufacture of computer, electronic and optical products | 12.2 | 12.0 | -1.0 | 0.0 |
| Manufacture of wood and of products of wood and cork, articles of straw and plaiting materials | 6.5 | 6.4 | -2.0 | 0.0 |
| Manufacture of beverages | 12.9 | 12.7 | -1.5 | -0.1 |
| Manufacture of paper and paper products | 10.1 | 9.9 | -2.3 | -0.1 |
| Manufacture of fabricated metal products, except machinery and equipment | 26.4 | 26.2 | -1.1 | -0.1 |
| Printing and reproduction of recorded media | 7.9 | 7.5 | -4.8 | -0.1 |
| Manufacture of basic metals | 5.9 | 5.5 | -6.8 | -0.1 |
| Manufacture of food products | 66.2 | 65.7 | -0.7 | -0.1 |
| Manufacture of machinery and equipment n.e.c. | 24.8 | 23.9 | -3.7 | -0.3 |
| Total UK manufacturers' sales | 358.1 | 364.7 | 1.8 | 1.8 |
| Source: Office for National Statistics | ||||
Download this table Table 1: Contribution to growth and percentage change by division, 2015 to 2016, UK
.xls (22.0 kB)The manufacture of food products division remains the largest within the UK manufacturing sector, contributing £65.7 billion (18.0%) of total UK manufacturing in 2016. However, this division saw a decline in sales in 2016, falling by £456 million (0.7%). Falling sales of fresh bread and of milk and cream of a fat content by weight exceeding 1%, but not exceeding 6% (in immediate packings of net content exceeding 2 litres) accounted for much of the decline.
Nôl i'r tabl cynnwys4. Divisions driving the growth in 2016
Between 2015 and 2016, manufacturers of motor vehicles, trailers and semi-trailers reported the largest increase in sales of £6.2 billion (12.8%). The motor vehicle division has seen sales double over the last seven years when the estimate was £27.4 billion in 2009. The division saw the largest contribution (1.7%) to the total UK manufacturing growth rate for 2016 of 1.8%.
These figures support data from the Society of Motor Manufacturers and Traders, the UK car industry’s trade body, who announced that UK car production achieved a 17-year high in 2016, with record levels of motor vehicle exports.
Manufacturing of basic pharmaceutical products, furniture and chemical products additionally contributed £2.7 billion to the overall rise between 2015 and 2016.
At 15.5%, the increase in sales from the manufacture of basic pharmaceutical products was the largest year-on-year percentage change increase across any division, with an actual increase of £1.7 billion. Medicaments for therapeutic or prophylactic uses provided the largest sales of £6.4 billion, an increase since 2015 of £1.3 billion (24.4%) and the highest sales reported for this product since 2012.
Sales from the manufacture of furniture increased by £512 million (7.6%) in 2016, which continues the growth seen in each year since 2009. This increase is driven by sales of wooden kitchen furniture and upholstered wooden framed seats such as three-piece suites.
Figure 2: Divisional growth by percentage change, 2015 to 2016
UK
Source: Prodcom - Office for National Statistics
Download this chart Figure 2: Divisional growth by percentage change, 2015 to 2016
Image .csv .xls5. Half of the divisions reported a decline in sales in 2016
While total manufacturers’ sales increased in 2016, 12 out of 25 divisions reported a contraction in sales. The manufacture of machinery and equipment not elsewhere classified reported a reduction in sales of £905 million (3.7%). This was the largest decline in sales in terms of value in 2016 and a direct result of declining sales of £711 million from the manufacture of machinery for mining, quarrying and construction. A lack of demand from the worldwide mining and energy sectors had a negative effect on sales of heavy machinery, which contributed to the fall.
The next largest decline was from the manufacture of food products, which fell by £456 million (0.7%) in 2016. This was driven mainly by the operation of dairies and cheese making contributing £779 million (10.3%), as well as the manufacture of bread, fresh pastry goods and cakes contributing £341 million (5.2%).
Sales from the manufacture of basic metals have been declining since 2011, with a drop over the period of £3.0 billion (35.0%). Since 2015, sales within the division have declined by £403 million (6.8%). This decline is in-line with recent data published by the Annual Business Survey and is driven by a large fall in sales from the manufacture of tubes, pipes and fittings of steel.
Sales from the printing and reproduction of recorded media division declined by £378 million (4.8%) between 2015 and 2016. The main contributor to this decline was sales from the printing of newspapers, journals and periodicals, which have continually declined since 2010, by £545 million (53.4%). These contractions were also supported by the ONS Internet Access Survey data, which show that more people now use the internet to access the news.
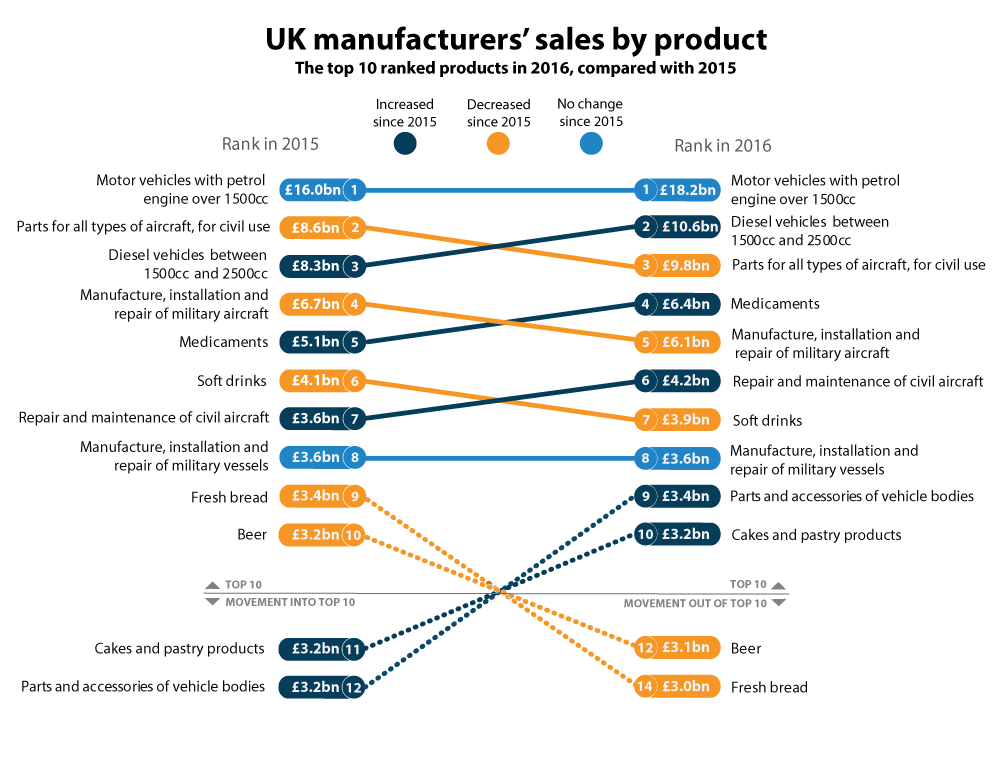
Nôl i'r tabl cynnwys6. Top 10 product sales in the UK in 2016
Motor vehicles with a petrol engine over 1500cc remain the product produced in the UK with the largest sales at £18.2 billion. This product has also increased since 2015 by £2.2 billion (14.0%). There has been similar growth in sales of diesel vehicles between 1500cc and 2500cc, which increased by £2.4 billion (28.7%) and became the second ranked product in 2016, with sales of £10.6 billion.
Figure 3: Top 10 products ranked by value of sales, UK, 2015 and 2016
Source: Prodcom - Office for National Statistics
Notes:
- One product has been removed from the top 10 due to disclosure issues.
Download this image Figure 3: Top 10 products ranked by value of sales, UK, 2015 and 2016
.png (112.8 kB) .xls (33.8 kB)
Sales from parts of civil aircraft increased by £1.1 billion (13.0%) to £9.8 billion in 2016, making this the third largest product produced in the UK. The UK aerospace trade association, the ADS group, attributes this to growth in global sales and demand as highlighted in their UK aerospace outlook report 2016. Increased sales within the aerospace industry are also reflected in the rising sales seen from manufacture, repair and installation of civil aircraft, which increased by £620 million and moved up to sixth on the list of the top 10 products. However, sales from the manufacture, installation and repair of military aircraft declined by £654 million in 2016, down 9.7% over the year, moving from fourth to fifth in the top 10 list.
Fresh bread and beer products both fell out of the top 10 products produced in the UK in 2016, with a decline in sales of £358 million and £89 million respectively. While beer sales declined, sales of gin (or Geneva) increased for the seventh year running, rising by £67 million (24.1%) to £348 million. Sales of gin are almost three-times higher than the £126 million sales seen in 2009.
Outside the top 10 products, fresh or chilled cuts of chicken increased by £224 million (10.6%) to £2.3 billion in 2016.
In late 2015, England became the last nation within the UK to implement a charge on plastic bags from shops, which coincided with a decline in demand from customers. In 2016, manufacturers’ sales of plastic bags and sacks declined by £148 million (42.2%) to £202 m in 2016.
Nôl i'r tabl cynnwys7. UK manufacturers’ product sales revised upwards for 2015 and 2016
While the revision is relatively small at a UK level, this does not reflect the picture at product level. There were just under 1,000 products that were revised upwards by a total of £3.2 billion offset by just over 1,000 products that were revised downwards also by £3.2 billion since provisional figures were published.
UK manufacturers’ sales 2015 final data have been revised up from £357.8 billion to £358.1 billion. The largest revision was within the manufacture of fabricated metal products, which was revised up by £900 million.
Nôl i'r tabl cynnwys8. UK manufacturing within the EU
UK manufacturers’ sales make up approximately 8.8% of total EU sales, the fourth-largest producer behind Germany, Italy and France.
There are certain products within the EU where the UK produces a high proportion of the total. Some specific examples include golf clubs and golfing equipment, whisky, and parts for civil aircraft piston engines, where the UK contributes over 80% of the EU total.
The top three products produced by the EU member states reflect the top products in the UK. The leading products being:
- manufacture of motor vehicles with a petrol engine over 1500cc – the UK produces approximately 18% of the EU sales, second to Germany at 54%
- motor vehicles with a diesel engine between 1500cc and 2500cc – the UK produces 11% out of total EU sales of approximately £100 billion
- medicaments for therapeutic or prophylactic uses – the UK produces 8% of EU sales, behind Ireland at 34% and France at 15%
10. What’s changed in this release?
There are no major changes within this publication; however, we constantly aim to improve our bulletin and its contents to provide a more concise summary of the main statistics. We welcome feedback via email at ProdCompublications@ons.gov.uk or by telephone on +44 (0)1633 456720.
Nôl i'r tabl cynnwys11. Quality and methodology
Prodcom estimates are based on a sample of businesses that are surveyed annually. Information on standard errors, response rates, revisions and annual product code changes can be obtained from the quality indicators pack, which is available in the related downloads section of the Prodcom background information page. The Prodcom background information page also includes:
- Prodcom technical report
- Prodcom user guide
- Quality and methodology information
Standard errors are available for most products and inform users of the precision of the estimates. The 2016 intermediate estimates are based on a response rate of 81.4%.
Our technical report describes the methodology and processes that are used to produce Prodcom estimates. This includes information on sampling procedures, data collection and converting respondent data into published estimates. It complements the Prodcom user guide, which explains the variables and provides guidance on using the data correctly.
The UK manufacturers’ sales by product (Prodcom) Quality and Methodology Information report contains important information on:
- the strengths and limitations of the data and how it compares with related data
- uses and users of the data
- how the output was created
- the quality of the output including the accuracy of the data
The survey is based on the Prodcom list, which comprises of 3,770 manufacturing products and some services. As Prodcom is carried out across EU member states the list and detailed product descriptions, are provided by the European Statistical Office (Eurostat) each year.
A report on Prodcom EU methodology is available from Eurostat.
Eurostat also provides an annual Prodcom quality report containing comprehensive quality information.
Nôl i'r tabl cynnwys