UK Manufacturers’ Sales by Product (PRODCOM): 2012 Provisional Results

First estimates of UK manufacturing sales by product (PRODCOM) with EU comparisons.

Nid hwn yw'r datganiad diweddaraf. Gweld y datganiad diweddaraf

Cyswllt:
Email Hannah Finselbach

Dyddiad y datganiad:
27 June 2013

Cyhoeddiad nesaf:
19 December 2013

1. Key points

  • The provisional estimate of UK manufacturers’ sales for 2012, at current prices, is £342 billion (£4.2 billion higher than in 2011)
  • The value of UK manufacturers’ sales in 2012 was 3.2% (£10.5 billion) above the level seen in 2008, at the start of the recession
  • Of the top 10 products by sales value, six related to the motor vehicle and aircraft industries, while three are from the drinks industries (water, beer, and whisky)
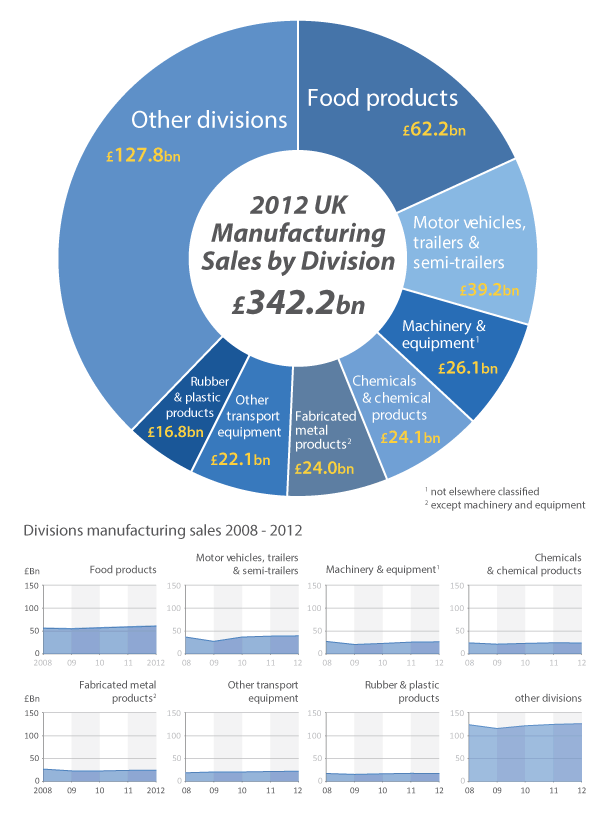
  • The largest sales in manufactured products in 2012 were from: Food (£62.2 billion); Motor vehicles, trailers and semi-trailers (£39.2 billion); and Machinery and equipment (£26.1 billion)
Nôl i'r tabl cynnwys

2. Overview

This release provides estimates of manufacturers’ sales by product and is commonly referred to as PRODCOM. Sales estimates are from businesses based in the UK only, irrespective of the final product destination. All estimates are presented at current prices and have not been adjusted for inflation using a Gross Domestic Product (GDP) deflator. This is important when comparing the value of UK manufacturers’ sales between years.

PRODCOM stands for PRODucts of the European COMmunity. The analyses in this bulletin and the accompanying tables reflect the most recent and comprehensive annual sales by value and volume data, based on the PRODCOM Survey for the years 2008 to 2012.

The PRODCOM Survey is carried out annually by all EU member states, under EU regulation, to enable comparison and, where possible, produce a picture of emerging developments of an industry or product in a European context. The survey has been conducted since 1993 when it replaced the UK’s Annual and Quarterly Sales Inquiries. In 2012, a sample of approximately 21,500 UK businesses was selected for the survey from ONS’s Inter-Departmental Business Register (IDBR).

Latest data for the 27 EU members can be found on the Eurostat website. The survey is conducted across the manufacturing industries; a total of 234 industries and 3,866 products. Every business is classified to a specific manufacturing industry but can span a variety of products depending on its diversity.

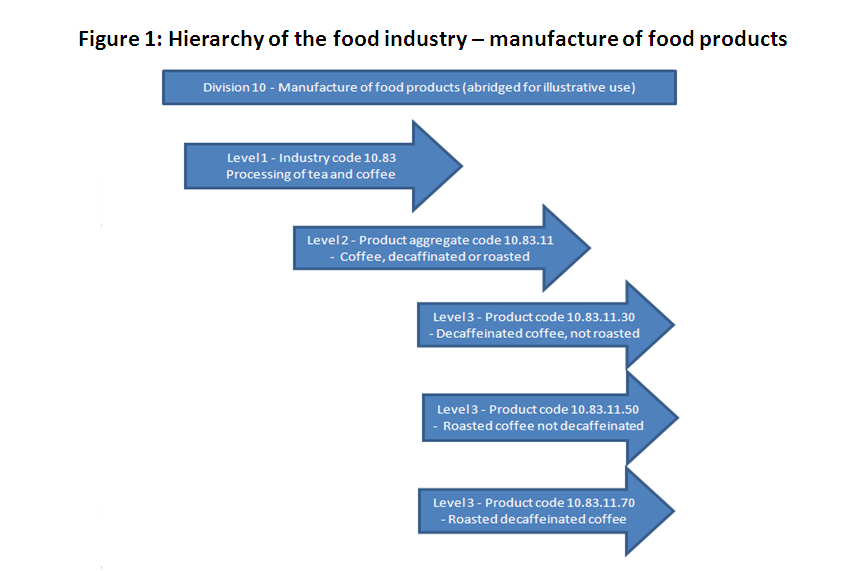
Data in the accompanying reference tables are presented by manufacturing ‘Division’ divided into ‘Industries’, followed by product aggregates and then individual products. The PRODCOM list, which is set by the European Commission, contains a comprehensive breakdown of industries. The structure of the PRODCOM codes are derived from various classification systems (detailed at 2.2). Figure 1 provides an illustration of the hierarchy of the published data.

Businesses selected for the PRODCOM survey are asked to supply the value of manufactured product sales and non-manufacturing income, the latter being used for balancing purposes only. In addition, businesses selected for three quarters of the industries covered, supply volume information.

The estimates in this release are accompanied by Her Majesty’s Revenue and Customs (HMRC) data on imports and exports, both intra (EU) and extra (non-EU). Analysis and data relating to the most recent period is published at uktradeinfo and is used by a wide range of government and international organisations. This information is useful for helping users gauge market share and for businesses to better understand how to establish new markets for their products. The trade data are also used in the ONS’ UK Balance of Payment account to help quantify the health of the UK economy.

Nôl i'r tabl cynnwys

3. User engagement

In early 2013, ONS conducted a survey seeking feedback from users of PRODCOM. A number of comments were received with respect to the possibility of expanding and improving the quality of PRODCOM data. We are continuing to seek further feedback from users to help determine priorities in order to define a continuous improvement plan. We would like to take this opportunity to thank all respondents who provided feedback to date.

We are constantly aiming to improve this release and its associated commentary. We would welcome any feedback you might have and would be particularly interested in knowing how you make use of these data to inform your work. Please contact us via email: prodcompublications@ons.gov.uk or telephone Hannah Finselbach on +44 (0)1633 456746.

Nôl i'r tabl cynnwys

4. PRODCOM sales 2012

In 2012, the value of UK manufacturers’ sales, at current prices, was estimated to be £342 billion. This is an increase of 1.2% (£4.2 billion) compared with 2011 and, following three consecutive annual increases, is 3.2% (£10.5 billion) above the level seen in 2008, at the start of the recession.

Table 1 shows the top 10 PRODCOM products with the highest value of sold production in 2012.

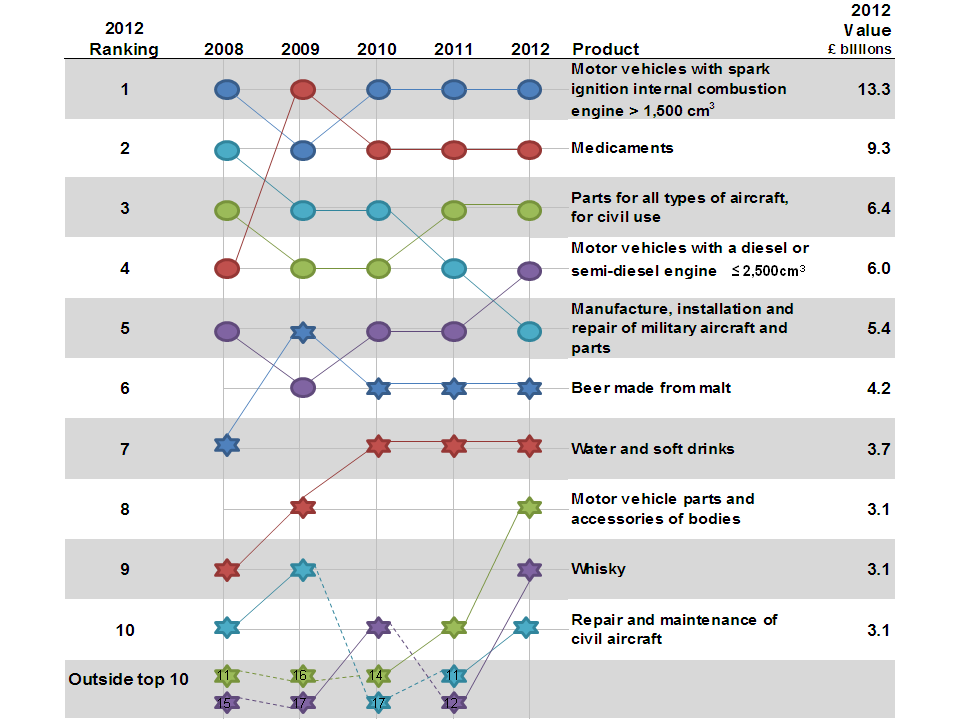
The products with the highest value of sold production in 2012 were Motor vehicles with a petrol engine (£13.3 billion); Other medicaments (£9.3 billion); Parts for all types of aircrafts (£6.4 billion); and Motor vehicles with a diesel engine (£6.0 billion). These products represented 10% of the total production value for 2012.

There is little change in the top 10 list of products from the 2011 intermediate estimates; of the current top 10, eight featured in the 2011 list, as shown in Figure 3.

In 2012, ‘Whisky’ (ranked 12 in 2011), and ‘Repair and maintenance of civil aircraft’ (ranked 11 in 2011) moved back into the top 10 list of products. They replaced ‘Iron or steel structures or parts of structures’ (ranked 8 in 2011), and ‘Motor vehicles with a diesel or semi-diesel engine greater than 2500cc’ (ranked 9 in 2011).

The increase in the value of UK manufacturers’ sales of Whisky to £3.1 billion (from £2.8 billion in 2011) may be explained by the increase in global demand for Whisky, as described in this article in the Guardian Newspaper.

The Strategic Vision for UK Aerospace: The Aerospace Growth Partnership report refers to recent investments to improve facilities and capability in UK companies. This may help to explain the increase in the value of ‘Repair and maintenance of civil aircraft’ from £2.9 billion in 2011 to £3.1 billion in 2012.

The latest annual EU comparative data for PRODCOM are available from the Eurostat website. A comparison of the value of sold products between EU Member States will be produced for these 2012 Intermediate Estimates, when the 2012 data for each member state are made available.

Nôl i'r tabl cynnwys

5. Results by industrial division

The UK estimate of manufacturers’ sales by product cover 25 ‘divisions’ in the Manufacturing industry (see Table 2 in background notes for more details on coverage). The top five divisions: Food products; Motor vehicles, trailers and semi-trailers; Machinery and equipment; Chemicals and chemical products and Fabricated metal products, except machinery and equipment account for approximately 50% of all UK production sales (see Figure 4 below).

The largest driver behind the growth in total manufacturing sales in 2012 was from Food products (£1.7 billion increase). Several divisions saw a decline in manufacturing sales, including Chemicals and chemical products (£0.4 billion decrease) compared with 2011.

The industry divisions with the highest production sales have been reasonably consistent over the past five years. For example, Food products and Motor vehicles, trailers and semi-trailers have consistently had the highest manufacturing sales values during this time.

Nôl i'r tabl cynnwys

.Background notes

  1. Key issues specific to this release

    This is the first (Provisional) set of data for the 2012 period. The Intermediate estimate for 2012 and the Final estimate for 2011 will be available in December 2013.

    Provisional survey estimates are published six months following the end of the reference period; intermediate estimates 12 months after the end of the reference period and a final set of estimates 24 months following the reference period.

    In 2011 a review of the methodology for producing standard errors for PRODCOM identified that several changes needed to be made to the underlying calculation. The effect of this is that the standard errors (and coefficients of variation) are now slightly higher than they were previously for some of the product headings. It is therefore important to note that any increases to the quality measures (contained within the accompanying tables) compared with previous years quality measures do not necessarily represent a decrease in the quality of the estimates. It should also be noted that standard errors prior to 2009 have not been recalculated.

    An extensive revision of NACE in 2007 resulted in changes to PRODCOM estimates for the 2008 survey onwards. All industry sectors now align exactly to the NACE classification. This differs from previous years where, in some instances, the UK published PRODCOM estimates under its own Standard Industrial Classification (SIC) which only matched the NACE classification to the first four digits. Due to the switch to SIC 07 in 2008 and the change in name and format of older publications, data pre-2008 are available on request from prodcompublications@ons.gov.uk

  2. National Statistics Assessment

    In July 2012 the UK Statistics Authority (UKSA) assessed the PRODCOM survey against the Code of Practice for Official Statistics. An assessment report was made available on the UKSA website. This report recommended that the PRODCOM estimates be designated as National Statistics, subject to ONS carrying out certain requirements. ONS is working hard to meet the requirements set out in this assessment report.

  3. User Engagement

    As part of the assessment process ONS is seeking views from its stakeholders and users in order to gather comprehensive and ongoing feedback on their current use and any further requirements. A summary of known users is provided below, in section 4. We would be grateful to any users of this product for their feedback. Please contact us via email: prodcompublications@ons.gov.uk or telephone Hannah Finselbach on +44 (0)1633 456746.

    Following the success of last year's business statistics user event a second all-day event, coordinated jointly with the Department for Business, Innovation and Skills (BIS), will take place in September 2013. The event, The Changing Shape of Trade and Investment in the UK, will feature a range of talks from users, producers and suppliers of business trade and investment statistics, not just from central government and the devolved administrations, but also local government, media, business representatives and researchers. More information on how to register for the event can be found on the ABS News Page.

    Government Statistical Service (GSS) business statistics

    To find out about other official business statistics, and choose the right data for your needs, use the GSS Business Statistics Interactive User Guide. By selecting your topics of interest, the tool will pinpoint publications that should be of interest to you, and provide you with links to more detailed information and the relevant statistical releases. It also offers guidance on which statistics are appropriate for different uses.

    Discussing ONS business statistics online

    There is a Business and Trade Statistics community on the StatsUserNet website. StatsUserNet is the Royal Statistical Society’s new interactive site for users of official statistics. The community objectives are to promote dialogue and share information between users and producers of official business and trade statistics about the structure, content and performance of businesses within the UK. Anyone can join the discussions by registering via either of the links above.

  4. Uses of the data

    The purpose of the statistics is to report, for each product in the PRODCOM List, how much has been produced in the UK during the reference period. This means that PRODCOM statistics relate to products (not to activities) and are therefore not strictly comparable with activity-based statistics such as Structural Business Statistics.

    The European Commission and national governments need data to monitor industry and markets and to develop their corresponding policies. To meet these requirements, Eurostat and Member States have developed the PRODCOM system and disseminate data which allows international comparisons between all Member States and other countries. The enterprises benefit from data provided by the PRODCOM system which allow them to evaluate markets and opportunities for development.

    From the perspective of Eurostat, who coordinate the collection and dissemination of PRODCOM data their most important categories of users are:

    • the European Commission
    • the national governments and their national authorities (i.e. public institutions, central and local administrations)
    • businesses and trade associations
    • the research institutions and students
    • the media

    There are numerous other users who use the data to produce various analyses and to inform policy decisions.

    EU anti-dumping cases

    EU PRODCOM survey data are regularly used in matters relating to EU anti-dumping cases providing vital product information for scrutiny during formal investigations.

    Environmental statistics

    Increasingly the data are used in analysis relating to environmental statistics such as ONS’ review of measuring the environmental goods and services sector which utilises PRODCOM data in an aim to identifying potential ‘green’ products.

    UK National Accounts

    PRODCOM outputs are required as part of the National Accounts Supply Table, an integral part of the annual Supply and Use Tables balancing process which is used to reconcile the three approaches to measuring Gross Domestic Product (GDP) and Gross National Income (GNI).

    Assisting the production of other National Statistics

    PRODCOM survey information is used to create a sampling frame for the Producer Prices Index, as it identifies businesses that make particular products.

    By combining PRODCOM with overseas trade data, users can derive various other statistics. For example: the trade balance, the UK net supply to the market and unit prices for production, imports and exports; all at the product level.

  5. Revisions

    There are no revisions to estimates previously published.

  6. Basic quality information

    A Quality and Methodology Information Report (140.2 Kb Pdf) (QMI) can be found on the Office for National Statistics (ONS) website. The aims of the QMI report are to provide users with a greater understanding of ONS’s statistics, their quality and the methods that are used to create them.

    A report on PRODCOM EU methodology is also available from the Eurostat website.

    Eurostat also produce an annual PRODCOM Quality Report containing comprehensive quality information based on the latest data received from all EU members.

    An EU glossary of terms can be used to interpret the technical descriptions and abbreviations used throughout the report.

    The following information is available to users for each PRODCOM Commodity Code.

    • an estimate of standard error
    • standard error as a percentage of the published value (the coefficient of variation)
    • number of businesses providing data at the product level
    • total employment of businesses providing data for the product

    Standard errors are an estimate of the sampling error, which arises because an estimate is based on a survey rather than a population census. It is a measure of the precision of the estimate. A low standard error therefore indicates a precise estimate. To aid comparison and interpretation, the standard error is also expressed as a percentage of the product’s estimated total sales. This quantity is sometimes called the coefficient of variation and it allows the standard errors to be put into context.

    Standard error estimates are available for most product level value estimates. The latest data are available in the accompanying publication tables.

  7. Coverage

    Product information is collected from the following Manufacturing Divisions:

    Data pertaining to Division 58 - Publishing is collected but not published as part of this bulletin. These data are not a requirement of the EU and are collected to ensure complete coverage of products in (and therefore the quality of estimates in) Division 18 – Printing. Data for Division 58 is available on request from prodcompublications@ons.gov.uk.

  8. Sample Information

    The PRODCOM list is updated annually to allow for the addition and deletion of products as the market evolves; clarification of product definitions and corrections where identified.

    The survey sample is derived from ONS’ Inter-Departmental Business register. Businesses are selected by employment size and industry classification. Additional constraints are built into the sample design with a view to restricting the form filling burden on smaller businesses. Further details on sample selection are included in the QMI (140.2 Kb Pdf).

  9. Data limitations

    It is important that users are aware of the limitations of these data.

    The reference tables associated with this release provide estimates of value, volume, and unit values (value per unit of volume) for each product group, where possible. Alongside the estimates of PRODCOM sales, estimates of Intra and Extra EU Imports and Exports are also reported. These data are collected by HMRC, and are matched with the PRODCOM codes and included within the PRODCOM tables for the benefit of demonstrating the UK trade balance. Data are available monthly, quarterly and annually from HMRC’s Trade Statistics.

    The HMRC data are collected using different a coding frame to PRODCOM. An example of the building blocks for the PRODCOM List and its synergies with associated coding frames is clearly depicted on page 6 of the Eurostat PRODCOM overview.

    The volume unit collected by HMRC may be different to the unit collected by PRODCOM, and therefore the unit values are not always comparable.

    We are currently working to provide sufficient notes for the reference tables, to aid interpretation of these figures. These will hopefully be available in time for the next publication of these estimates (19 December 2013).

  10. General Information

    The sum of constituent items in tables may not always agree exactly with the totals shown due to rounding.

    The following symbols are used in the accompanying tables:

    S Suppressed as disclosive

    S* Suppressed as disclosive but included in the aggregated for UK Manufacturer Sales of “Other” products aggregated for UK in the Sales and Turnover table

    N/A Data not available

    * Not able to provide data due to secondary disclosure, different units of measurement or other technical issues

  11. Response Rates

    These provisional estimates are based on a response rate of 79.9%. Late and revised returns are included in the intermediate and final estimates.

  12. Coherence

    Intra and Extra EU Import and Export data are supplied by HMRC to measure the flow of goods into and out of the UK. These data are also used as part of the UK’s Balance of Payment Account to gauge the health of the UK. Users should note that the coding frames used for HMRC trade data and PRODCOM are different, as noted as part of background note 8. An alternative source of data can be derived from the UK National Accounts Supply/Use Tables.

    The Index of Production (IOP) collects total production turnover but not data about individual products manufactured. There are, however, a significant number of respondents who return only one product figure to PRODCOM and it is, in theory, possible that this information could be collected through IOP for PRODCOM.

    The Annual Business Survey (ABS) also collects total turnover plus other variables similar to the standard headings collected by PRODCOM. The feasibility therefore exists for the ABS to collect standard headings on behalf of PRODCOM. There are differences however which would create issues and this explains why this has not been progressed. For example ABS collection captures financial year-end whereas PRODCOM collects a calendar year; therefore PRODCOM would not be able meet Eurostat regulations in terms of timeliness. There would also be considerable differences in sales values for individual product headings in the smaller size-band because the ABS collect data on total sales of own manufactured products, but minimal collection on sales of individual manufactured products.

  13. Disclosure

    Statistical disclosure control methodology is applied to the PRODCOM estimates to ensure that information attributable to an individual business is not disclosed in any publication. However, to provide the most comprehensive dataset, ONS seek permission to publish data from businesses whose sales and/or volume data are deemed disclosive. Where permissions are granted the data is included in the final tables. The Code of Practice for Official Statistics sets out principles for how ONS protects data from being disclosed.

    During 2013 a brief review of the PRODCOM disclosure practices was conducted. The review concluded that there were no perceived issues with the current methodology.

  14. Relevant links

    The scope, coverage and requirement for the PRODCOM survey are detailed in Eurostat’s PRODCOM User Guide. The interactive guide helps find statistics on UK business published by the Office for National Statistics. It covers statistics regarding the structure, content and performance of businesses across the UK, which includes measures of turnover and other financial transaction variables, employment, economic growth and productivity.

    Further information on the collection of import and export data by HMRC can be found on the HMRC website.

  15. Future changes to PRODCOM methodology

    As part of a package of measures to improve the quality of the PRODCOM results, the current methodology and systems used in the production of the data are under review. Details of work undertaken will be published in separate articles.

    Planned articles in 2013 relate to:

    • an amendment to the method of calculation of PRODCOM Standard Errors
    • the possibility of a bi-annual sample for the PRODCOM Survey
    • introducing selective editing within the PRODCOM Survey to reduce burden on business

    Users will be informed of planned work and progress through future statistical bulletins and accompanying articles. Users are encouraged to feedback any comments relating to the PRODCOM output using the email prodcompublications@ons.gov.uk.

  16. Social media

    Follow ONS on Twitter and receive up to date information about our statistics.

    Like ONS on Facebook to receive our updates in your newsfeed and to post comments on our page.

  17. Special events

    ONS has published commentary, analysis and policy on 'Special Events' which may affect statistical outputs. For full details visit the Special Events page on the ONS website.

    Release policy

  18. Details of the policy governing the release of new data are available by visiting www.statisticsauthority.gov.uk/assessment/code-of-practice/index.html or from the Media Relations Office email: media.relations@ons.gov.uk

    These National Statistics are produced to high professional standards and released according to the arrangements approved by the UK Statistics Authority.

Nôl i'r tabl cynnwys

Manylion cyswllt ar gyfer y Bwletin ystadegol

Hannah Finselbach
prodcompublications@ons.gov.uk
Ffôn: +44 (0)1633 456746