Cynnwys
- Main points
- Things you need to know about this release
- Output
- New orders
- Structure of the industry
- Trends in employment and the professions
- Output price indices (OPIs) and cost indices
- Comparisons and contributions to the economy
- Planning applications decisions and local authority expenditure
- International comparisons
- Building materials
- Key Performance Indicators and benchmarking
- External data sources and previously published tables
- Quality and methodology
- Appendix 1: Notes and definitions for the construction industry
1. Main points
The value of construction new work in Great Britain continued to rise in 2016, reaching its highest level on record at £99,266 million; driven by continued growth in the private sector.
The steady rise in the value of construction new orders seen since 2011 has continued, owing to the increase in all other work in 2016.
Construction price inflation reached 2.2% in the last month of 2016, above both the CPI and SPPI, which both ended 2016 at 1.1%.
The trade deficit in construction materials and components continued to widen in 2016, with imports more than double the value of exports, resulting in a trade deficit of £9,090 million.
Construction-related employment provided by construction firms grew by 55,831 compared with 2015, with jobs centred around London, the South East and the North West.
The number of construction firms in Great Britain increased to its highest level on record in 2016.
2,557 new company insolvencies occurred in the construction industry the year ending 2016, second only to the administrative services sector.
Despite a broadly positive 2016, future risks to the industry exist in the form of a potential rise in the price of imports and falls in business and consumer confidence in the UK economy.
2. Things you need to know about this release
The Construction statistics annual publication brings together a wide range of statistics currently available on the construction industry from a variety of sources. Data from Office for National Statistics (ONS) as well as other government departments are used in order to provide analysis of the construction industry.
This 2017 edition, which analyses the calendar year of 2016, includes updated figures in Tables 2.4, 2.8, 2.9, 3.1, 3.4, 3.5, which were included in the previous Construction statistics annual. This edition has been expanded to include Tables 2.5 and 2.6, as well as additional sections to include more in-depth economic analysis. It is worth noting that all data published in this release is in current prices and non-seasonally adjusted.
All other tables that were previously contained in the annual construction statistics publication are no longer collated and published by ONS. Where these data tables are no longer published, links have been provided to enable you to obtain the relevant data from external sources.
Nôl i'r tabl cynnwys3. Output
Office for National Statistics (ONS) publishes monthly statistics on construction output in Great Britain, which can be found in the monthly Output in the construction industry statistical bulletin and associated datasets. It is worth noting that while the monthly construction release focuses mainly on volume data, this release focuses mainly on current price value data.
This annual publication release contains three output tables:
- Table 2.4 shows the value of construction output by type of work
- Table 2.8 shows the value of work done by trade of firm and type of work in 2016
- Table 2.9 shows the value of work done by size of firm and type of work in 2016
The value of all new work continued to grow in Great Britain in 2016. This growth is depicted in Figure 1, split into public and private sector work. Since 2012, the rise in value of all new work has been driven by the rise in the private sector, with public sector work remaining broadly flat. Of this increase, 7,391 were as a result of ONS improving its methods in classifying smaller firms.
Figure 1: All new work broken down into public and private sectors, 2006 to 2016
Great Britain, Current prices, non-seasonally adjusted, £ million
Source: Office for National Statistics
Download this chart Figure 1: All new work broken down into public and private sectors, 2006 to 2016
Image .csv .xlsThe value of all new work increased to £99,266 million in 2016; its highest level on record. This increase in all new work has occurred despite public sector output falling in 2016. With historically low interest rates continuing to facilitate private sector investment in the industry, the marginal fall in public sector work has been far outweighed by the continuing expansion of the private sector; with growth coming from the housing sector in particular.
Aside from all new work, all repair and maintenance equated to £52,223 million in 2016, as seen in Table 2.8. This is an increase of £1,679 million compared with 2015. This rise was predominantly driven by an increase of £1,680 million in private housing repair and maintenance compared with the previous year.
Nôl i'r tabl cynnwys4. New orders
Construction new orders data is published quarterly by Office for National Statistics (ONS), using data sourced from Barbour ABI. Total new orders data can be broken down into two main sectors; all new housing and all other work.
This release contains two new orders tables:
- Table 2.5 shows value of new orders for construction by sector
- Table 2.6 shows value of new orders for construction by type of work
Figure 2 depicts the split in the value of new orders, between all new housing work and all other work from 2006 to 2016 in current prices. Since 2011, the value of all new work has endured a steady increase, predominantly driven by the rise in all other work. In contrast, the value of all new housing orders has remained broadly flat since 2006.
Figure 2: The value of new orders, 2006 to 2016
Great Britain, Current prices, non-seasonally adjusted, £ million
Source: Office for National statistics and Barbour ABI
Download this chart Figure 2: The value of new orders, 2006 to 2016
Image .csv .xlsAfter dropping sharply in the midst of the economic downturn, the value of new orders has since endured a steady recovery. The 5.5% growth in 2016 is the fifth consecutive year of at least 5% growth, subsequently leading to a rise in the value of new orders to its highest level since 2007 at £66,126 million.
Private housing and public other new work provided the main contributions to growth, with only private industrial new orders falling in 2016. The growth in all new housing has come as a result of both private new housing and public new housing increasing. However, with new private housing making up nearly 90% of all new housing, the increase has been driven largely by the £1,052 million rise in the private sector.
It is worth noting that not all new orders will become output, some contracts may fall through and be re-awarded, or in some cases no work may take place at all. Therefore unlike construction output, new orders do not directly contribute to gross domestic product (GDP).
Nôl i'r tabl cynnwys5. Structure of the industry
We produce extensive information on the structure of the construction industry, including breakdowns on employment, trade of firm and size and number of firms. This annual publication produces four tables on the industry structure:
- Table 3.1 shows the number of construction firms
- Table 3.3 shows the total employment of construction firms
- Table 3.4 shows the number of firms by size and trade of firm
- Table 3.5 shows the number of firms by size and region of registration
The number of construction firms operating in the construction industry has continued to rise, reaching its highest level on record with 296,093 registered in Great Britain in 2016, increasing by 22,318 compared with the previous year. Of this increase, 7,391 were as a result of ONS improving its methods in classifying smaller firms.
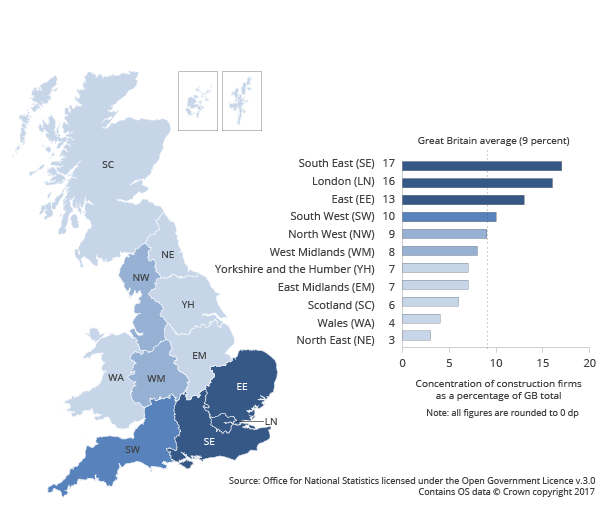
Figure 3 shows the concentration of construction firms as a percentage by region in Great Britain. Construction firms were concentrated around both London and the South East in 2016, with the East of England also proving popular.
Figure 3: Regional concentration of construction firms as a percentage, in Great Britain 2016
English regions, Scotland and Wales
Source: Office for National statistics
Download this image Figure 3: Regional concentration of construction firms as a percentage, in Great Britain 2016
.png (51.1 kB) .xls (19.5 kB)
The overall rise in firms was driven by increases in England, where the number of construction firms rose 20,136 in 2016. This increase stemmed from the consistently strong London and South East, alongside growth in the East of England and North West. The number of construction firms registered in Scotland and Wales increased marginally in 2016, but the number of firms operating in these regions remains small in comparison with the rest of Great Britain as a whole.
The volatility of the construction industry is also evident in the number of insolvencies seen in the industry. Figure 4 uses data from the Insolvency Service to show the number of new company insolvencies for the highest 10 industries in England and Wales in 2016.
Figure 4: Total new company insolvencies 2016, highest 10 industries
England and Wales
Source: The Insolvency Service
Download this chart Figure 4: Total new company insolvencies 2016, highest 10 industries
Image .csv .xlsAcross the top 10 highest industries in 2016, a total of 14,937 new companies entered insolvency. Of these firms, 2,557 were operating in the construction industry. Only administrative services contributed more to insolvencies than construction (due to a particular spike in that sector). Construction had been the highest contributing sector to new company insolvencies for the past five years prior to 2016.
Nôl i'r tabl cynnwys6. Trends in employment and the professions
This publication provides one table on employment within the industry:
- Table 3.3 shows employment by trade, size of firm and region of registration
The number of jobs provided by construction firms in the construction industry has been increasing since 2011; this has continued in 2016, with construction employment increasing by 4.6% compared with 2015. This makes construction the fastest growing sector when compared with agriculture, services and production.
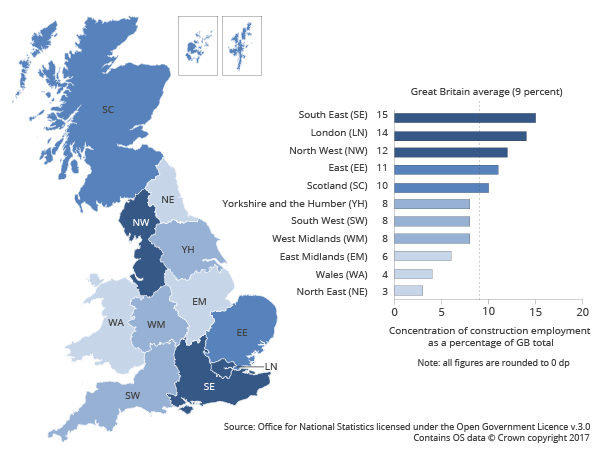
Figure 5 shows the concentration of construction employment by region in Great Britain in 2016. As expected, a large proportion of construction-specific employment is concentrated in London and the South East, whereas employment levels in more dispersed regions such as the North East and Wales remain relatively lower.
Figure 5: Regional concentration of construction-specific employment as a percentage, in Great Britain 2016
English regions, Scotland and Wales
Source: Office for National Statistics
Download this image Figure 5: Regional concentration of construction-specific employment as a percentage, in Great Britain 2016
.png (52.5 kB) .xls (27.1 kB)
The largest contributions to construction employment growth came from London and the South East, which together make up 29% of construction employment in 2016. Elsewhere, the most notable increase in 2016 came from Yorkshire and The Humber, which grew by 18.6% compared with 2015. Scotland also grew at an increasing rate, rising 13,500 in 2016 and now equates to 10% of all construction employment in Great Britain.
In comparison with Figure 3, which shows the regional concentration of firms, the number of employees and firms in each region are in most cases directly relatable, that is, a higher number of firms in a region results in a higher number of employees in the region. For example, the South East and London provide the most notable contributions to construction employment. However, in some regions, such as Scotland this is not the case. Scotland contributes 6% of all construction firms in Great Britain, while actually contributing 10% of all construction employment.
Aside from jobs provided by private contractors, self-employment in the construction industry is becoming increasingly popular. The rise in popularity in self-employment in the economy as a whole is broadly reflected in the services sector, which has risen rapidly since 2008. Self-employment in the construction sector equates to more than the agriculture and production sectors combined. We produce data with a more detailed breakdown of self-employment by industry.
Nôl i'r tabl cynnwys7. Output price indices (OPIs) and cost indices
Responsibility for output price indices was transferred to Office for National Statistics (ONS) on 1 April 2015, following the suspension of construction prices as a National Statistic in 2014. The quarterly output price indices (OPIs) since June 2015 have been produced using an interim solution while we have continued to develop appropriate methodologies for the long-term.
Improvements to our interim solution have been implemented in line with Blue Book 2017, on 29 September 2017. More information on the improvements being made to our construction output price indices is available. These improvements will be seen first in our monthly construction output series on 10 October 2017, while the improvements will be seen first in the OPIs on 14 November 2017. However, all data used in this section (7) is using the original interim method and therefore will be subject to change once the new price indices are implemented.
Quarterly data on output price indices is now available in the Construction output price indices publication. Figure 6 depicts the construction output price index, split by the all new work, and repair and maintenance indices. Construction prices have endured a gradual increase since 2014, driven mainly by the increase in the prices of new work.
Figure 6: Construction output price index, 2014 to 2016
Non-seasonally adjusted, Great Britain
Source: The Office for National Statistics
Download this chart Figure 6: Construction output price index, 2014 to 2016
Image .csv .xlsFollowing a fairly volatile year in 2015, output prices in the construction industry endured a gradual increase throughout the majority of 2016, but did fall in December 2016. The decrease in all construction prices came despite the prices of repair and maintenance work continuing their steady increase, with the fall in overall construction prices driven by the sharp fall in output prices of new work.
For a more in-depth breakdown on the trade of construction materials, as well as how construction price inflation compares with other industries, see sections 11 and 8 of this publication.
Nôl i'r tabl cynnwys8. Comparisons and contributions to the economy
Construction is a naturally volatile industry and is responsive to fluctuations in both confidence and economic variables, such as interest and exchange rates. Construction also influences some of the main economic indicators, including inflation and gross domestic product (GDP). This section will provide analysis on how the construction industry both compares and contributes to the wider economy.
Price inflation
Figure 7 shows the comparison between the Consumer Prices Index (CPI), the Construction Price Index and also the Services Producer Price Index (SPPI). Construction price inflation is historically more volatile than both the CPI and SPPI; experiencing periods of exceptionally high inflation whilst also periods of deflation as well. Please note that the Construction Price Index data is also using the interim price method, as detailed in section 7 and therefore may be revised when the improved indices are published in November 2017.
All three price indices dropped sharply in the midst of the economic downturn, but have since steadily recovered; with all three indices ending 2016 relatively close to the Bank of England’s (BoE) target level of 2%.
Figure 7: Inflation percentage change, 1999 to 2016
Consumer Price index, Construction price index, Services producer price index
Source: Office for National statistics
Notes:
- Q1 refers to Quarter 1 (Jan to Mar), Q2 refers to Quarter 2 (Apr to June), Q3 refers to Quarter 3 (July to Sept) and Q4 refers to Quarter 4 (Oct to Dec).
Download this chart Figure 7: Inflation percentage change, 1999 to 2016
Image .csv .xlsConstruction price inflation reached 2.2% in the last month of 2016, above both the CPI and SPPI, which both ended 2016 at 1.1%. The volatility of the construction industry relevant to other industries is again evident in Figure 4, with construction output prices more sensitive to fluctuations in erratic commodities such as oil. In addition, as a result of the EU referendum in June 2016, sterling dropped to a 31-year low against the US dollar, meaning import prices may rise in future when the effect of the devaluation of sterling filters through to prices.
Gross domestic product
The UK economy is made up of four main sectors: services, production, construction and agriculture. The services sector makes up 79.3% of GDP, construction contributes 6.1%, while production and agriculture equate to 14.0% and 0.7% respectively (these percentages sum to 100.1% due to rounding). GDP data is published quarterly by ONS.
Figure 8 compares the growth in the construction industry in comparison with GDP as a whole in volume terms. The volatility of the construction industry is evident, small fluctuations in GDP are exaggerated by expansions and contractions in construction. Since 2013, growth in the construction industry has been broadly positive, with only one quarter of negative growth coming in Quarter 3 (July to Sept) 2015.
Figure 8: GDP and construction output quarterly volume growth rates, 2010 to 2016
Chained Volume measure, Seasonally Adjusted, United Kingdom
Source: Office for National Statistics
Notes:
- Q1 refers to Quarter 1 (Jan to Mar), Q2 refers to Quarter 2 (Apr to June), Q3 refers to Quarter 3 (July to Sept) and Q4 refers to Quarter 4 (Oct to Dec).
Download this chart Figure 8: GDP and construction output quarterly volume growth rates, 2010 to 2016
Image .csv .xlsConstruction output grew consistently in real volume terms in every quarter of 2016, resulting in annual growth of 3.8% in 2016. This expansion in construction output comes after two years of relatively high growth in the industry, with construction output expanding by 4.4% in 2015 and 9% in 2014.
Nôl i'r tabl cynnwys9. Planning applications decisions and local authority expenditure
According to data published by the Department for Communities and Local Government (DCLG), district level planning authorities made 382,600 planning application decisions in 2016; a 3% rise from 2015. In terms of residential development, 49,100 decisions were made: 6,400 for major developments and 42,700 for minor, up by 7% and 5% respectively compared with 2015.
With regards to housing, the number of dwellings completed has actually fallen in 2016; albeit after very strong growth in 2015. This is depicted in Figure 9, which shows the number of permanent new dwelling completions in the UK from 1980 to 2016.
Figure 9: Number of permanent new dwelling completions, 1980 to 2016
UK
Source: Department for communities and local government
Download this chart Figure 9: Number of permanent new dwelling completions, 1980 to 2016
Image .csv .xlsFigure 9 also depicts the split in new permanent dwellings between dwellings provided by private enterprises, housing associations and local authorities. As can be seen, the contributions made by housing associations and local authorities are relatively small in comparison with the much larger contribution from private enterprises. The fall in all dwellings in 2016 has occurred despite the number of private enterprise dwellings rising to its highest level since 2008. In addition, the relatively small local authority new dwellings have also experienced a small rise. These increases have been more than offset by the fall in dwellings provided by housing associations, which fell by 6,020 in 2016.
Further data and information on English local authority expenditure can be found on the GOV.UK website.
Nôl i'r tabl cynnwys10. International comparisons
As part of the monthly construction bulletin, links are made to the European production in construction and also the US census bureau construction spending release. Like Office for National Statistics (ONS), both organisations also produce monthly figures on construction output in their respective regions.
Figure 10 compares construction growth rates for the UK, the European Union, and the US from 2014 until 2016. It is worth noting that while all data used is seasonally adjusted, the EU figures are also calendar adjusted.
Figure 10: Construction volume output growth rate comparison by region, 2014 to 2016
UK, United States of America, European Union, Seasonally Adjusted
Source: Office for National Statistics, Eurostat & US Census Bureau
Notes:
- Q1 refers to Quarter 1 (Jan to Mar), Q2 refers to Quarter 2 (Apr to June), Q3 refers to Quarter 3 (July to Sept) and Q4 refers to Quarter 4 (Oct to Dec).
Download this chart Figure 10: Construction volume output growth rate comparison by region, 2014 to 2016
Image .csv .xlsThroughout 2014 to 2016, the UK, US and EU all experienced broadly positive growth. The UK saw continuous construction growth, with the exception of Quarter 3 (July to Sept) 2015. Meanwhile the US and the EU also experienced broadly positive growth, with the US experiencing growth in all but two quarters across the two years, while the EU experienced just three quarters of negative growth.
The US and UK construction industries grew consistently throughout 2016, with the US exceeding 1% growth in every quarter. Growth in the UK was consistently lower than the US, with the exception of Quarter 2 (Apr to June) 2016, where growth peaked at 2.1%. Elsewhere, the EU was the only region to contract in 2016, falling by 0.4% in Quarter 2 2016. However, when making these comparisons, it must be noted that both the US and EU have considerably higher levels of both land and labour compared with the UK, which enhance the potential for construction growth.
Nôl i'r tabl cynnwys11. Building materials
Data on both the prices and quantities of building materials used, bought and sold in the UK are published by the Department for Business, Energy and Industrial Strategy (BEIS). The UK has operated a trade deficit in construction goods and components in the past six years of data provided by BEIS, with it consistently widening in each consecutive year.
Figure 11: The balance of trade in all building materials and components, 2011 to 2016
United Kingdom, £ Thousands, Current prices
Source: Office for National Statistics and Department for Business, Energy and Industrial Strategy
Download this chart Figure 11: The balance of trade in all building materials and components, 2011 to 2016
Image .csv .xlsThe widening of the trade deficit in the trade of building materials and components is depicted in Figure 11, which shows how the value of building materials and components imports have gradually increased between 2011 and 2016. The value of construction imports was more than double the value of exports in 2016, with the trade deficit in construction materials and components now £9,090 million.
Nôl i'r tabl cynnwys12. Key Performance Indicators and benchmarking
The construction industry Key Performance Indicators (KPIs) are produced in partnership with the Construction Industry Training Board (CITB) and endorsed by Department for Business, Energy and Industrial Strategy (BEIS) and Constructing Excellence using data from Office for National Statistics (ONS), Building Cost Information Service, Health and Safety Executive, Dun and Bradstreet and other third-party financial analysts.
The annual construction KPIs, relating to performance in 2016 are now available online from Glenigan.
The KPIzone website gives access to KPIs for economic, social and environmental performance as well as those for the construction sectors, allowing for the choice of relevant KPIs and to store and retrieve data to help benchmark effectively. Methods of measurement, data collection forms, trend charts, examples and links to improve performance are included for each KPI as well as calculators to obtain benchmark scores.
The KPI builder has the facility of being able to store performance information in a secure area called “My KPIs”, analyse and report results and then produce a tailored document called “My KPIs Handbook”. Other areas of the website include secondary and additional performance indicators, international KPIs and industry progress tables.
The website also includes supporting information including case studies, KPI best practice guide and masterclass information. The construction industry KPIs are intended for use by individual firms wishing to measure and compare their performance.
Nôl i'r tabl cynnwys13. External data sources and previously published tables
Insolvencies and bankruptcies:
The data previously published in Table 3.2 is now available from the Insolvency Service.
Planning applications:
Tables 10.1, 10.2, 10.3, 10.4 and 10.5, which were published up to the 2012 edition can now be accessed on the GOV.UK website.
Employment and the professions:
Data previously published as Table 11.10 is produced every five years by the Construction Industry Council.
Table 11.1 can now be found in the JOBS02 spreadsheet of the Labour market statistics publication.
Trainee numbers, previously published as Table 11.12, are produced by the Construction Industry Training Board and can be accessed on their website.
The number and turnover of construction service businesses, previously published as Table 11.18, can now be found in Section F of the Annual Business Survey results.
Data previously published as Table 11.19 is updated four times a year and can be found in the LABD03 Table of the Labour market statistics publication.
The data previously published as Tables 11.2 to 11.4 can be found in the Annual Survey of Hours and Earnings publication.
The Health and Safety Executive produces:
- data previously published as Table 11.20, showing the injuries in Great Britain by industry and severity of injury and are available in the RIDIND Table
- data previously published as Table 11.21, the number of injuries in Great Britain by industry and severity of injury and are available in the RIDKIND1 Table
- data previously published as Table 11.22, the rate of injury in Great Britain by industry and severity of injury and are available in the HISTRATE Table
Data previously published as Table 11.23, the number of proceedings instituted by Health and Safety Executive and, in Scotland, the Crown Office and Prosecutor Fiscal Service under specific regulations and acts by result at an offence level, are available in Table EF5.
Data on employment in the construction industry by sex, previously published as Table 11.5, can be found in the EMP14 spreadsheet of the Labour market statistics publication.
Northern Ireland, Wales and Scotland:
Table 12.1 and Table 12.2 previously contained data on the value of construction output and the index of construction output in Northern Ireland. Both are available on the Department for the Economy website.
Information relating to housing statistics in Northern Ireland, previously published in Tables 12.3 and 12.4, can be found in the Housing Statistics website section of the Department for Communities.
Table 12.5 and 12.6 previously contained the value of new orders and value of output obtained by contractors for Wales. This is updated on a quarterly basis and can be found in Table 6 of the Output in the construction industry and new orders publication.
The Welsh Government website contains:
- data previously published in Table 12.7, the Index of Construction for Wales, which can now be found in the latest release of the Index of Production and Construction
- data previously published in Table 12.8, relating to planning applications in Wales, is published on a quarterly basis in the Development Management Quarterly Survey
- data previously published in Table 12.9, relating to mineral planning applications in Wales
- data previously published in Table 12.10, providing the analysis of capital account expenditure for Wales
- data previously published in Table 12.11, showing household projections for Wales
The value of new orders obtained by contractors for Scotland, previously published in Table 12.12 and the value of output obtained by contractors for Scotland, previously published in Table 12.13, are updated on a quarterly basis and both can be found in Table 6 of the Output in the construction industry and new orders publication.
International comparisons:
Previously published Tables 14.1 to 14.8 contained information relating to international comparisons and are now produced by Gardiner and Theobald.
Nôl i'r tabl cynnwys14. Quality and methodology
The Output in the construction industry and New orders in the construction industry Quality and Methodology Information reports contain important information on:
- the strengths and limitations of the data
- the quality of the output: including the accuracy of the data and how it compares with related data
- uses and users
- how the output was created
15. Appendix 1: Notes and definitions for the construction industry
A methodology document containing Notes and definitions for the construction industry is available. This document lists the known sources of information on and related to the construction industry. These include information on employees, employment, enterprises, output and new orders in the construction industry as well as the contribution of the industry to the economy. Related information, for example, housing, is also included.
Construction statistics: sources and outputs
Nôl i'r tabl cynnwys