Cynnwys
- Introduction
- Overview of the Annual Survey of Goods and Services
- Questionnaire design
- Sampling procedure
- Data collection
- Converting respondent data into published estimates
- Publication and data dissemination
- Disclosure control and data confidentiality
- Revisions policy
- Future work
- Contact and other information
1. Introduction
This guide describes the methodological and technical procedures used by the Office for National Statistics (ONS) to produce the Annual Survey of Goods and Services (ASGS) estimates. The report is aimed at users who want to know more about the background and history, uses and users, concepts and statistical methods underlying the survey. It includes information about survey development, sample design, data collection, results processing, publications and quality issues.
This technical guide will be revised in line with any major future survey developments.
Nôl i'r tabl cynnwys2. Overview of the Annual Survey of Goods and Services
The Annual Survey of Goods and Services (ASGS) was launched by the Office for National Statistics (ONS) in summer 2017 (for reference period 2016), in response to one of the main recommendations from Professor Sir Charles Bean's independent review of economic statistics. This recommendation was to provide more comprehensive and detailed statistics of the services industries for the UK, which were not captured by existing surveys. The ASGS replaced the Services Turnover Survey (STS), which was last conducted in 2015. The STS only covered approximately 40% of total service industry turnover using data provided by 42 different services industries.
Comparatively, the ASGS is an online survey that samples approximately 40,000 businesses in the service sector, covering approximately 63% of the total service industry turnover using data from 51 service industries. The ASGS measures turnover, asking respondents to breakdown their turnover by individual services and goods, including a breakdown generated from both UK and overseas customers. As businesses are becoming more diverse, there is a need to measure both primary (within their main classification) and secondary (outside their main classification) activity.
The ASGS collects data from UK businesses in the service sector using the UK Standard Industrial Classification 2007: SIC 2007 – excluding construction, public administration and defence, compulsory social security, and banking. The public sector, non-profit making organisations, and government are also excluded from this survey.
The ASGS helps to improve the quality of product breakdowns in the supply and use tables, and in turn the quality of balancing and Gross Domestic Product (GDP), a main economic indicator. Additionally, ASGS data informs the Services Producer Price Index (SPPI), which provides a measure of inflation for the UK services sector. The SPPI are used as deflators in the Index of Services (IoS) and the output measure of GDP.
The Annual Survey of Goods and Services (ASGS) is conducted under the provisions of the Statistics of Trade Act 1947. Once selected, businesses are legally obliged to comply.
Main uses and users of the data
There are a range of users of ASGS data. Users include those from the government, both internal within the ONS and external in other government departments. The main users are:
devolved administrations including the Welsh Government and the Scottish Government
the Department for Business, Energy and Industrial Strategy (BEIS)
the Department for Culture, Media and Sport (DCMS)
the Prices team within the ONS
the Supply and Use team within the ONS
academics and research agencies
The data collected from the ASGS will feed into the Services Producer Price Index (SPPI) and the National Accounts supply and use tables. These are a central component of the National Accounts balancing process, setting the annual level of nominal Gross Domestic Product (GDP). ASGS data have improved the quality of balancing and GDP as a result of the detailed breakdown of service products provided in this survey.
Data are also delivered to the Prices division to ensure that legislative requirements are met.
Future ASGS data will be delivered to the UK National Accounts and feed into the Blue Book, which is an important annual publication for the ONS.
History
The Annual Survey of Goods and Services (ASGS) was launched in 2017, replacing the Services Turnover Survey (STS), which was last run in 2015. The STS was conducted biennially and collected turnover data for various services provided by 42 different services industries, with a sample size of 20,000. The STS only covered approximately 40% of total service industry turnover.
The ASGS was therefore developed to broaden service industries coverage. Consistent with the STS, the ASGS uses the Statistical Classification of Products by Activity (CPA code) harmonised with the Standard Industrial Classification (SIC), collecting information about products a business produces inside and outside its main industrial classification or activity. This helps to meet recommendations made in Professor Sir Charles Bean's independent review of economic statistics. The use of a harmonised product classification also enables comparisons with other national statistics institutes. To fully capture services industries turnover, the ASGS was developed to collect a detailed breakdown of the services provided by businesses and whether they were provided to customers inside or outside the UK.
Within the UK, the services industries represent a large proportion of Gross Domestic Product (GDP) (80%), in comparison with the manufacturing industries (10%). However, while a detailed survey exists for the manufacturing industries (UK Manufacturers' Sales by Product, also known as ProdCom), the services industries were not being measured in a sufficient level of detail to meet user requirements. An existing ONS survey, the International Trade in Services (ITIS) survey, measures UK services industries exports and imports; however, it does not measure the domestic supply of services.
Timeline
The ASGS process from sample selection through to the final data delivery is shown in Table 1.
Please note the staggered survey launch over a two-week period. This staggered launch was implemented in the 2017 reference period to reduce the impact on the call centre receiving a high influx of queries, which was the case for the 2016 reference period with one dispatch date.
The ASGS is currently dispatched in mid-June, asking businesses for information from the previous year. Table 1 shows the current timetable for business as usual.
| Month | ||||||||||
|---|---|---|---|---|---|---|---|---|---|---|
| February | ||||||||||
| March | Invite letters sign-off | |||||||||
| April | System testing and sample analysis | |||||||||
| May | Final sample selection | |||||||||
| June | Survey launch – Staggered invite letters dispatch | |||||||||
| July | First reminders | Validation and quality assurance | ||||||||
| August | Response chasing | |||||||||
| September | Second reminders | |||||||||
| October | ||||||||||
| November | ||||||||||
| December | Final data delivery | User testing | ||||||||
| January | ||||||||||
| February | ||||||||||
| March | Data delivery to customers |
Download this table Table 1: Summary of the Annual Survey of Goods and Services survey process
.xls .csvWe are currently reviewing the timeliness of the release of ASGS data, and our aim as the survey develops is to reduce the time taken to publish the data. The latest release of 2017 reference period data, collected in 2018, was published in September 2019. The time lag between collection and publication reflects the complexity of the survey. The aim is that publications will feed into the timetable for Blue Book publications. It is not possible to collect this large quantity of data more frequently, as this would place an unacceptable level of burden on businesses and would require a prohibitively large resource to process results.
Nôl i'r tabl cynnwys3. Questionnaire design
The Annual Survey of Goods and Services (ASGS) is an online survey currently consisting of 51 survey types. The survey type presented to a business is dependent upon the Standard Industrial Classification (SIC) a business is classified to on the Inter-Departmental Business Register (IDBR).
The survey questions were produced for the ASGS using the Statistical Classification of Products by Activity (CPA) version 2.1. The CPA is the classification of products (goods as well as services). Product classifications are designed to categorise products that have common characteristics.
The business' SIC classification determines the list of products a respondent is offered. The products offered are the on-diagonal products, most closely related to a business' specific industry and representing their main activities, if classified correctly. However, not wanting to restrict businesses to an assumed list of products, all other products are available in the search function for the respondent to select, providing the option to tailor the survey to their unique business activities.
Questionnaire types
There are 51 survey types for the ASGS. These are:
electricity, gas, steam and air conditioning
natural water
sewerage services
waste collection, treatment and disposal services; materials recovery services
remediation services
wholesale and retail trade and repair services of motor vehicles and motorcycles
wholesale trade
retail trade services, except of motor vehicles and motorcycles
land services of freight and transport services via pipelines
land transport services of passengers
water transport of freight
water transport of passengers
air transport services
warehousing and support services for transportation
postal and courier services
accommodation services
food and beverage serving services
publishing services
motion picture, video and television programme production services, sound recording and music publishing
programming and broadcasting services
telecommunication services
computer programming, consultancy and related services
information services
financial services, except insurance and pension funding
insurance services
real estate services
legal and accounting services
services of head offices; management consulting services
architectural and engineering services; technical testing and analysis services
scientific research and development services
advertising and market research services
other professional, scientific and technical services
veterinary services
rental and leasing services
employment services
travel agency, tour operator and other reservation services and related services
security and investigation services
services to buildings and landscape
office administrative, office support and other business support services
education services for higher education
education services for pre-higher education
human health services
residential care services and social work services without accommodation
creative, arts and entertainment services
library, archive, museum and other cultural services
gambling and betting services
sporting services and amusement and recreation services
services furnished by membership organisations
repair services including computers
repair services of personal and household goods
other personal services
The SIC a business is classified to determines the products they are offered. The products offered are all industry specific known as "on-diagonal" products; these are products assumed most closely related to the business' main activities, based on businesses' industrial classification (taken from the IDBR – see Section 4).
Table 2 provides an example for the veterinary services industry. In this example, the top three products are "on-diagonal", that is, within the SIC the business is classified to. However, the last three products are products that are most closely related to the industry, so predicted to be provided by businesses in the industry. These related products are listed to reduce respondent burden and attempt to facilitate the completion of the survey efficiently.
| Yes | No | |
|---|---|---|
| Veterinary services for pet animals [750011] | ||
| Veterinary services for livestock [750012] | ||
| Other veterinary services [750019] | ||
| Pet care services [960911] | ||
| Support services to animal production (including rental, leasing and hiring of agricultural equipment with operator) [016210] | ||
| Undertaking services [960312] |
Download this table Table 2: Example of the “products offered” grid
.xls .csvAll other products not listed are available in the search function. When respondents search for key words, all related products are shown, demonstrated in Table 3.
| research | |
| Hunting and trapping and related services [017010] | |
| Publishing of printed professional, technical and scholarly books [581112] | |
| Interdisciplinary basic research services [720011] | |
| Interdisciplinary applied research services [720012] | |
| Interdisciplinary research and development originals [720020] | |
Download this table Table 3: Example of the search function in the electronic survey
.xls .csvRespondents can select as many products as they wish from the search function, including off-diagonal products, that is, products outside the SIC the business is classified to. Once selected they are added to the product list, tailoring the product list to capture turnover breakdown by products selected by the respondent, reflecting the unique activities of each business. Table 4 provides an example of this.
| Veterinary services for pet animals [750011] | £ |
| Veterinary services for livestock [750012] | £ |
| Basic research services in chemistry and biology [721921] | £ |
Download this table Table 4: Example of turnover allocation grid between selected products
.xls .csvQuestionnaire development
The development of the ASGS was important for meeting the recommendations from Professor Sir Charles Bean's independent review of economic statistics, of more comprehensive and detailed statistics of the services industries for the UK, which were not captured by existing surveys. Subsequently, the requirements from internal stakeholders such as UK National Accounts, Prices, Trade and the Supply and Use teams, and external stakeholders, including the Welsh Government and Scottish Government, are met.
Before the first year the survey was launched, cognitive testing was undertaken to test the wording and understanding of the CPA product questions, the includes and excludes related to each question and the services definition. Conclusions from cognitive testing were implemented into the final design of the survey.
Questionnaire review
The 2016 reference period of the ASGS was a pilot of the new survey, whereby businesses were requested to provide a breakdown by 6-digit (most detailed) level CPA codes. This was consistent across all industries.
In response to respondent feedback, less detailed product codes were adopted for the wholesale, retail and waste management industries, and stakeholders were consulted. This was because of respondents in these industries reporting that it was very difficult to break down their turnover to such a detailed level. From the 2017 reference period onwards, the respondent burden was reduced for these industries after the products within the wholesale industry was reduced to the 3-digit level, and the products within the retail and waste management industries to the 5-digit level.
Other improvements included updating the key words in the search function, ensuring searches are more refined, removing the option for respondents to select government or banking product codes, and redesigning the survey so it was not possible to enter dates outside the required reporting period.
No amendments were made between the 2017 and 2018 reference periods. Following a "pause and review" of the ASGS after the 2018 reference period, further cognitive testing was conducted to test new includes for the top 3 SICs. These are the SICs that contributed the highest proportion to total turnover in the wholesale industry at the 3-digit level.
Based on qualitative research into the top 3 SICs, new includes were added hoping to improve understanding and provide more clarity on the most closely related product code in each of these SICs. The 3 SICs that underwent testing included:
wholesale of computers, computer peripheral equipment and software (4651)
wholesale of solid, liquid and gaseous fuels and related products (4671)
wholesale of wood, construction materials and sanitary equipment (4673)
Additionally, cognitive testing included a question asking respondents to provide a percentage of their total turnover generated from online sales. The feasibility of respondents providing online sales figures for customer's transactions from their direct website only was explored. Cognitive testing investigated the wording and location of this new question for ASGS. Based on respondent feedback, there were minor adjustments made to the survey. These comprised of more detailed includes for the three wholesale SICs specified previously, and the addition of an online sales section near the end of the survey. These changes were implemented in time for the 2019 reference period, dispatched in June 2020.
A balance needs to be struck between questions that businesses can respond accurately to and the detail required to underpin UK National Accounts estimates. Therefore, the ASGS will continue to be reviewed alongside stakeholder requirements, response rates, validation, sample design and the returned data in readiness for future publication, for use in the UK National Accounts supply and use tables.
Variables collected
The main variables collected in the ASGS are described in Table 5.
| Variable | Description |
|---|---|
| About this survey | Details for completing the survey, what information respondents will be asked to provide and a link for further information |
| Reporting period | Reporting period start and end dates; calendar year requested but option to input alternative dates |
| Total turnover | Total turnover figure and reporting where turnover was generated based on customer location; inside the UK, overseas or both |
| Service turnover | Selection of offered services the business provides from products within the business’ main SIC classification (industry specific products) |
| Other service turnover | Search function available for businesses to select any other services their business provides, outside their main SIC classification |
| Service turnover breakdown | Breakdown of turnover generated from inside the UK and overseas against the service products selected previously |
| Turnover from production | Turnover generated from the manufacture of goods |
| Turnover from online sales | A percentage of turnover generated from online sales. Estimated percentages accepted where precise percentages are unavailable. |
| Comments and contact details | Comments on turnover figures and/or survey, contact name, job title, email address, telephone number, time taken to complete in hours and minutes |
| Summary | Preview before submitting of products selected, turnover allocated to each product, split between UK and overseas. Option to print summary page. |
Download this table Table 5: Description of main survey variables
.xls .csv4. Sampling procedure
Sampling frame
Inter-Departmental Business Register
A sampling frame is a complete list of all the members of a population being studied, from which the sample is drawn. The Inter-Departmental Business Register (IDBR) is a comprehensive list of UK businesses, used as the sampling frame for the Annual Survey of Goods and Services (ASGS).
Businesses are added to the IDBR if they are:
registered for Value Added Tax (VAT) and Pay As You Earn (PAYE) with Her Majesty's Revenue and Customs (HMRC)
an incorporated business registered at Companies House
The IDBR covers businesses in all parts of the economy, except:
some very small businesses (those without employees, and with turnover below the tax threshold)
and some non-profit making organisations
There are approximately 2.7 million businesses on the IDBR; covering nearly 99% of UK economic activity. It is used by government departments, including the Office for National Statistics (ONS), as the sampling frame for most business surveys.
To keep the information on the IDBR up-to-date, administrative data from HMRC are supplemented by data from ONS surveys, such as the Business Register and Employment Survey (BRES). Any changes identified through survey submissions, such as changes to classification, address or contact details, or status of the company that arise during the ASGS are reported to the IDBR team to update the register.
Further information about the IDBR can be found on the ONS IDBR webpages.
Reporting units
The business unit to which surveys are sent is called the reporting unit. The response from the reporting unit can cover the enterprise as a whole or parts of the enterprise identified by lists of sub-units (called local units). Other than for a minority of larger businesses or businesses that have a more complex structure, the reporting unit is the same as the enterprise. For this reason, the ASGS reporting unit counts are presented as enterprise counts.
An enterprise may consist of one or more local units, located at a variety of sites. An enterprise may therefore have local units at different locations and may carry out more than one type of economic activity.
Currently, the ASGS does not produce regional estimates.
Standard Industrial Classification (SIC)
Each enterprise is classified according to the Standard Industrial Classification of Economic Activities (SIC) system. The UK is required to have a system of classification consistent with the International Standard Industrial Classification (ISIC) system. The ISIC underwent a review in 2007. ASGS data have been collected and published on the SIC 2007 system.
UK SIC 2007 is divided into 21 sections, each denoted by a single letter from A to U. The letters of the sections can be uniquely defined by the breakdown to the divisions (denoted by two digits), which are then broken down into groups (three digits), then into classes (four digits) and, in some but not all cases, again into subclasses (five digits).
For example, in SIC 2007:
section J: information and communication (comprising divisions 58 to 63)
division 62: computer programming, consultancy and related activities
group 62.0: computer programming, consultancy and related activities
class 62.01: computer programming activities
subclass 62.01/1: ready-made interactive leisure and entertainment software development
The full structure of SIC 2007 consists of:
21 sections
88 divisions
272 groups
615 classes
191 subclasses
Each local unit is assigned a single SIC code, which corresponds to the unit's principal activity. Where more than one type of economic activity is carried out by a local unit or enterprise, the dominant activity of a business is driven by the local unit employees (not employment). This is calculated using a "top down" method on a digit by digit basis for multiple activity enterprises.
The methodology considers units based on their SIC section letter, then works down 2-, 3-, 4- and 5-digit level until a clear classification is determined. For example, if a reference unit contains four local units (for example, four local shops), and each specialises in different activities then they would be classified in different SICs. Enterprise level information will provide the activity of most of the employees within the enterprise. There are detailed rules for determining SIC for multiple-activity economic units, including situations where measures of value added are not available.
Figure 1: Relationship between local units, enterprises, enterprise groups, and reporting and administrative units
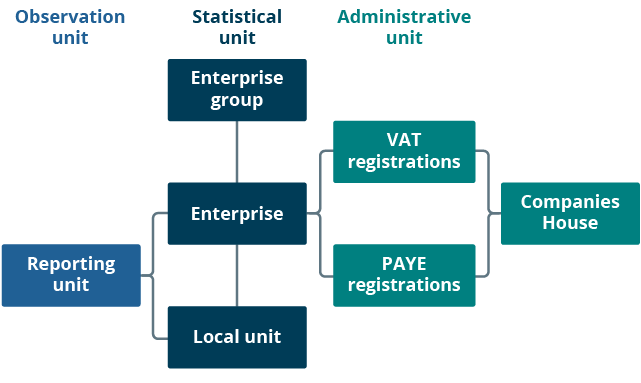
Source: Office for National Statistics – Annual Survey of Goods and Services
Notes:
Administrative Units: VAT trader and PAYE employer information supplemented with incorporated business data from Companies House.
Statistical Units: A group of legal units under common ownership is called an Enterprise Group.
Observation Units: Reporting Units hold the mailing address to which the surveys are sent. The survey can cover the enterprise as a whole, or parts of the enterprise identified by lists of local units.
Download this image Figure 1: Relationship between local units, enterprises, enterprise groups, and reporting and administrative units
.png (19.0 kB)Re-classification of a business can occur because of a relatively small change to the nature of its operation, and this can have a significant effect on ASGS estimates by industry. In addition, the correction of misclassification of businesses can lead to bias, particularly where there is systematic movement from one industry to another. This is because, where classification updates are identified through survey returns, it is only units in the survey sample that are updated.
The ASGS covers a large proportion of the service industry but excludes banks, public sector and non-profit making organisations. Some service sectors were not included, for example, some parts of financial, because these data are collected by the Bank of England or other ONS surveys.
All surveys that do not cover the whole business population, such as the ASGS, have the potential for some underestimation of output variables because of the re-classification of units moving out of the ASGS survey population, but never into it. However, such underestimation is likely to be small.
The exact inclusions and exclusions of sections in the ASGS are detailed in this section.
Inclusions
Electricity, gas, steam and air conditioning supply (section D)
Water supply; sewerage, waste management and remediation activities (section E)
Wholesale and retail trade; repair of motor vehicles and motorcycles (section G)
Transport and storage (section H)
Accommodation and food service activities (section I)
Information and communication (section J)
Financial and insurance activities (section K)
Real estate activities (section L)
Professional, scientific and technical activities (section M)
Administrative and support service activities (section N)
Education (section P)
Human health and social work activities (section Q)
Arts, entertainment and recreation (section R)
Other service activities (section S)
Exclusions
Agriculture, forestry and fishing (section A)
Mining and quarrying (section B)
Manufacturing (section C)
Construction (section F)
Administration and defence; Compulsory social security (section O)
Sample design
Data are collected by the ONS from approximately 40,000 businesses in the UK (excluding the Channel Islands and the Isle of Man). The area covered is in line with other business surveys produced by the ONS.
The ASGS uses a stratified random sample design. This is grouped by:
five employment size-bands: 0 to 9, 10 to 49, 50 to 99, 100 to 299 and 300 plus
industry class: four-digit UK Standard Industrial Classification 2007: SIC 2007
Sample selection occurs independently for each stratum. When the sample is designed, the size of the sample in each stratum is determined by an algorithm, which distributes the sample among the cells to give the lowest estimated variance (uncertainty). This design is significantly more efficient (that is, it gives a much more accurate estimate for the same sized sample) than a simple, unstratified random sample.
Reporting units will be selected twice for ASGS before being rotated out of the sample.
Exceptions arise for the strata within the largest and smallest employment size-bands. Businesses with fewer than 10 in employment are excluded because of Osmotherly rules. Businesses with 300 or more in employment are also excluded because they will be selected every year for the ASGS in fully enumerated cells (a combination of SIC 4-digits and size-band) and will not be rotated out of the sample. Both exceptions are explained.
All businesses with 300 employees or more will automatically be included in the sample to ensure that the businesses generating the highest turnover are selected every year. This is because these strata tend to have fewer enterprises in them, and yet, as they are large enterprises, they are dominant respondents to estimated total values. Including all the largest enterprises significantly reduces uncertainty on the estimated total values. For most businesses below this threshold, a simple random sampling method based on Permanent Random Numbers (PRN) is used for selection.
However, it is not only businesses with 300 or more employees that are automatically selected for ASGS and referred to as "key responders". A new rule introduced in the 2018 reference period was that businesses, with an employment between 10 and 299, contributing 20% or more of a product's total estimated turnover are "key responders". Also, businesses contributing the highest turnover within their industry are also clustered as key responders, so are included in the sample.
The top 10% of businesses from each 4-digit SIC based on turnover are selected, ensuring that a minimum of eight key responders are identified per industry based on this rule. As these were new rules for the 2018 reference period, the rules have been applied to businesses that are clean and were used for imputation in the 2017 reference period.
For most businesses with employment of 0 to 9, Osmotherly rules apply. These rules state that when a business with 0 to 9 employment has been selected for a survey, it will only be selected for a single year and it will not be reselected for at least three years following selection (provided they complete and return the survey). There are a few exceptions to these rules, but in general, they are implemented to reduce the burden on small businesses, which may not have much resource for completing surveys.
From the 2017 reference period onwards, the following rules applied for 0 to 9 businesses:
sample a maximum of five businesses when the universe for that cell is greater than 100
sample less than or equal to 5% of the cell when the universe is less than 100
A new rule has been added for the 2019 reference period, stated as follows:
- if the number of businesses required is greater than 5, and the universe count is greater than 10, then businesses will automatically be included in the sample
Additionally, the turnover per head value (TPH) is calculated for businesses with between 10 and 299 employment. The TPH value is based on the total ASGS turnover and the employment at the time of selection. The identified businesses for the reference list are compared with all other clean returned businesses with between 10 and 299 in employment, to confirm the identified businesses are not typical of the rest of the universe.
If the TPH value for those businesses identified to be forced into selection via a reference list has a much greater average TPH value than the rest of the universe, and if they have high turnover compared with businesses with similar employment, they are not representative of the universe. These businesses should therefore be treated differently in the estimation process, so their data are not used to estimate for the non-responders. Every year, this is re-run to ensure we are using the most up-to-date employment and SIC data to produce a new list of references to include in the selection.
For the private sector, industry coverage is 282 4-digit SICs covering the service sectors. This includes the Services Turnover Survey (STS) coverage plus 213 additional 4-digit SICs. However, this excludes agriculture, banking, construction and government.
Nôl i'r tabl cynnwys5. Data collection
Timetable of questionnaire dispatch
Invite letters are sent to businesses to inform them that they have been sampled and are legally obliged to complete the survey online. Invite letters detail the request of data relating to the previous calendar year, known as the reference period. Despite requesting data for the calendar year, there is an option available for reporting for alternative dates (providing that the year end is between specified dates). The letters contain the link to the survey and the business' unique access code required to login. The survey is obligatory to be completed and submitted online within six weeks.
Approximately 40,000 businesses are selected to take part in the Annual Survey of Goods and Services (ASGS). For the 2016 reference period, all invite letters were dispatched on the same day. However, from the 2017 reference period onwards, the sample has been split into four dispatch dates across a 10-day period to reduce the influx of queries allowing us to better respond to respondents.
Currency
The ASGS only allows respondents to report their turnover in pounds sterling (£). It is therefore assumed that respondents convert their turnover into pounds sterling before reporting, if the business uses an alternative currency.
Expected questionnaire receipt
To meet the minimum accuracy standards required by users, the Annual Survey of Goods and Services (ASGS) response rate target is a minimum of 75% by November (following the reference period and five months after the surveys are dispatched). The response rate will be the number of businesses that have returned data expressed as a percentage of the overall sample size. The clearance rate target is 80% of the achieved response rate. The clearance rate is the number of businesses that have provided clean data, including references manually cleaned during validation, expressed as a percentage of the number of responses.
The Office for National Statistics (ONS) also has specific targets for the most economically important businesses that are selected to complete the ASGS. These economically important businesses are referred to as "key responders" and are those businesses that are important to either an industry or a specific product. The target response rate for "key responders" is set at a minimum of 80%.
Key responders for the ASGS are businesses that have more than 300 employees, businesses contributing 20% or more of a product's total estimated turnover, and businesses contributing the highest turnover within their industry. The top 10% of businesses from each 4-digit Standard Industrial Classification (SIC) based on turnover are selected, ensuring that a minimum of eight key responders are identified per industry based on this rule. As the identified key responders, whose data potentially have the biggest impact on results, the clearance rate target is 90%.
Tables 6 and 7 show the response rate and clearance rate for the first three years of the ASGS. Table 6 shows the response and clearance rates obtained in all three reference periods to date, while Table 7 breaks down the information displayed in Table 6 by employment size band.
| 2016 reference period | 2017 reference period | 2018 reference period | ||||
|---|---|---|---|---|---|---|
| Response Rate | Clearance Rate | Response Rate | Clearance Rate | Response Rate | Clearance Rate | |
| Total | 78% | 81% | 78% | 86% | 76% | 83% |
| Key Responders | 80% | 72% | 85% | 89% | 79% | 90% |
Download this table Table 6: Response and clearance rates for the Annual Survey of Goods and Services, 2016, 2017 and 2018 reference periods
.xls .csv
| 2016 reference period | 2017 reference period | 2018 reference period | ||||
|---|---|---|---|---|---|---|
| Size-band | Returned % | Cleared % | Returned % | Cleared % | Returned % | Cleared % |
| 0 to 9 | 73% | 80% | 72% | 85% | 71% | 75% |
| 10 to 49 | 80% | 84% | 78% | 86% | 76% | 82% |
| 50 to 99 | 81% | 83% | 81% | 86% | 79% | 87% |
| 100 to 299 | 81% | 81% | 81% | 86% | 78% | 87% |
| 300 or more | 80% | 74% | 85% | 89% | 79% | 91% |
| Total | 78% | 81% | 78% | 86% | 76% | 83% |
Download this table Table 7: Response and clearance rates for the Annual Survey of Goods and Services by employment size-band, 2016, 2017 and 2018 reference periods
.xls .csvResponse rate by employment size-band for 2016 reference period
Smaller businesses with an employment size of 0 to 9 had the lowest response rate of 73%. The highest response rate was from businesses in the 50 to 99 and 100 to 299 employment size-bands, at 81%. This was closely followed by the largest businesses (300 or more employees) at 80%.
Response rate by employment size-band for 2017 reference period
By size-band, the response rate was lowest among smaller businesses of 0 to 9 employees (72%), and highest among those with 300 or more employees (85%).
Response rate by employment size-band for 2018 reference period
By size-band, the response rate was lowest among businesses with between 0 to 9 employees (71%), and highest among those with between 50 and 99 or 300 or more employees (79%).
Reminder letters
Up to two reminder letters and two reminder emails are sent to businesses who have not submitted a completed survey by mid-July, two weeks before the official deadline date. At the beginning of July, all non-responders are first sent an email reminder. A second letter and email reminder are sent starting at the end of August, shortly after the official completion deadline date.
Response chasing
During the data collection period, the ASGS response rates for returned surveys are monitored regularly to prioritise companies to response chase. Telephone response chasing starts immediately after the official deadline. It is intended to encourage the completion of the survey and address any respondent issues in a timely and efficient manner.
Enforcement strategy
The ASGS carries out enforcement action under the Statistics of Trade Act 1947. Enforcement action is used to maintain response rates, and so the quality of the survey. It is used only as a last resort, after attempts to encourage businesses to complete the survey following telephone calls and reminder letters and/or emails.
If enforcement action is carried out, the business will be issued with a summons to court. If this happens, the business can still choose to respond to the survey, and the case will be withdrawn. This option is only allowed once. If the business becomes subject to enforcement a second time the business will be prosecuted. Businesses can be fined up to a maximum of £2,500 for non-response.
Nôl i'r tabl cynnwys6. Converting respondent data into published estimates
Editing and validation
Invite letters containing the link to complete the Annual Survey of Goods and Services (ASGS), and login details, are sent out to businesses by post. Details enclosed on the invite letter include what information will be requested and how to register online to complete the survey. Once respondents log in, the first section "About this survey" provides further information on how to complete the survey, including contact details in the case of required assistance and a link for more information on ASGS.
There are 13 validation checks built into the survey that work in "real time", for example, too great a difference between survey turnover and the Inter-Departmental Business Register (IDBR) turnover. These checks produce error messages for any issues at the time of completion, attempting to reduce the number of validation call backs after submission. No checks are visible to respondents but are used to flag whether respondents need to be re-contacted during the validation process, or whether their data was already clear. Further validation is conducted by manual quality assurance checks involving desk research, such as year-on-year validation, and as a last resort, respondents are contacted to clarify erroneous responses.
Imputation
Before imputation, turnover is automatically adjusted for any companies where the sum of components (goods and services) has less than 10% discrepancy from reported total turnover. For these cases, the product breakdown is assumed more accurate than the total turnover. Therefore, the total turnover is adjusted to the sum of the product breakdown. Companies where the discrepancy is more than 10% are removed to be investigated in validation.
Imputation techniques are used to replace missing data as a result of unit non-response (no information available on the current period) or item non-response (partial information available: total turnover but not product breakdown). Imputation is carried out only for businesses with more than nine employees. All the non-responses not dealt with in imputation are accounted for in the estimation process.
Item non-response
The "item non-response" imputation method is used for companies that provide a total turnover figure but do not provide a product breakdown. This method involves creating imputation classes according to the 2-digit SIC and employment size-bands. New imputation groups are created each year, to more accurately reflect the most popular goods and services provided by businesses within a particular industry, ensuring product patterns do not become outdated and remain as accurate as possible. There are three steps in this method.
Firstly, the most common product pattern is identified per 2-digit SIC and within each employment size-band. Secondly, the proportion of turnover allocated to the most common products is calculated and the average of these proportions are calculated. Thirdly, the average proportions are applied to the businesses undergoing imputation, distributing their total turnover into the most popular products. The amounts assigned to each product depends on the mean proportions of turnover calculated from the complete submissions.
Unit non-response
The "unit non-response" imputation method is used for businesses who have not responded to the survey at all in the current year. In these cases, for those businesses who have responded in the previous year with a "clean" status marker, their previous response is used for the current year. A growth factor is applied to non-respondents and respondents in error with an employment of more than 10. This growth factor has been calculated using companies that have responded in the previous and current year. One growth factor is calculated for each industry-employment size-band combination. This imputation method has also been applied retrospectively further enhancing the quality of the 2016 reference period estimates.
For businesses who did not return a "clean" response, or those who did not respond at all, in the previous year, go through the estimation module, which will be detailed in this section.
Estimation of totals
It is not possible to collect data on every UK business every year (a census), because:
the burden on businesses would be too great
the cost of running such a census would be prohibitive
a well-designed sample survey can produce better estimates than a census with a poor response rate
Therefore, the ASGS collects information from a sample of the UK business population each year. The sample design is described in Section 4. This section describes how returns from the sample are used to estimate totals for the whole population.
ASGS uses a non-linear estimation method to estimate for non-sampled businesses; the Chamber-Cruddas estimation method. This method is composed of two parts. The first estimates the probability that a business provides a service, and the second conditionally models the service turnover as proportional to register employment.
The estimation procedure is based on the employment of the non-sampled units (obtained from the IDBR), along with the total per head (TPH) value by respondent industry and product propensity, both of which are obtained from the sampled units. These are defined as follows:
total per head (TPH): sales value of product divided by employment count in the business
product propensity (PP): proportion of businesses in the strata carrying out the service or number of businesses in the strata; this is the probability that a business within a particular stratum will carry out this service
Businesses with extreme TPHs are removed for the calculation of one of the parameters (beta) of the model (see outliers detailed in this section), and a TPH for the industry-product combination is calculated.
An estimate of the sales for the non-sampled units, including those that have never responded, is produced by multiplying the PP by the employment of the non-returned business.
The total UK services sales for the product is calculated by summing the total returned sales of the returned units (including imputed values), and the estimated sales of businesses that have never returned their survey or were not in the sample (non-sampled units).
Estimation working example with hypothetical
Estimate (SIC 4 digits, CPA 6 digits)
= SAMPLE + BETA * PP * (NON-REPRESENTED EMPLOYMENT)
Where:
SIC 4 digits: code classifying businesses to the type of economic activity they engage in or business' industry, for example, "3523" (trade of gas through mains)
CPA 6 digits: product codes available to respondents to select reflecting their business activities, for example, product "353012" (steam and hot water supply services through mains)
Sample: total turnover by SIC and product combination (all companies that have reported a particular product and are classified to a particular SIC)
Beta: parameters of the model. To calculate this parameter, this uses the total per head (TPH) sales and apply outliering (trimming) if number of companies is larger than 10 (see "outliering" section for an example of this)
product propensity (PP): number of companies that have reported a product within a cell divided by the number of companies that have returned within that cell (combination of SIC 4-digits and size-band)
Non-represented employment: employment in non-returned units in the population
Numerical example
This example explains the process that occurs for each 4-digit SIC and product combination, using SIC 3523 (trade of gas through mains) and product 353012 (steam and hot water supply services through mains) as an example.
| Company ID | SIC | Size-band | Employment | Cell | Product 353012 |
|---|---|---|---|---|---|
| 120.. | 3523 | 0-9 | 1 | 31 | 10 |
| 121.. | 3523 | 0-9 | 2 | 31 | 0 |
| 122.. | 3523 | 10-49 | 20 | 32 | 10 |
| 123.. | 3523 | 10-49 | 15 | 32 | 75 |
| 124.. | 3523 | 10-49 | 25 | 32 | 0 |
| 125.. | 3523 | 300+ | 10,000 | 35 | 50 |
| 126.. | 3523 | 300+ | 15,000 | 35 | 500 |
| 127.. | 3523 | 300+ | 27,881 | 35 | 100 |
| TOTAL (£000) | 745 | ||||
Download this table Table 8: Sample for SIC 3523 (trade of gas through mains) and product 353012 (steam and hot water supply services through mains)
.xls .csvTable 8 provides an example of the original sample, where the total turnover of the sample for this SIC and product combination equals £745,000.
Beta equation
| SIC | Size-band | Cell | 𝜋 Product propensity of offering a product |
|---|---|---|---|
| 3523 | 0 to 9 | 31 | 1/2 |
| 3523 | 10 to 49 | 32 | 2/3 |
| 3523 | 50 to 99 | 33 | 0 |
| 3523 | 100 to 299 | 34 | 0 |
| 3523 | 300 or more | 35 | 1 |
Download this table Table 9: Product propensity (PP) for SIC 3523 (trade of gas through mains) and product 353012 (steam and hot water supply services through mains)
.xls .csvIn Table 9, the product propensity is calculated per cell by calculating the number of companies that returned a non-zero turnover figure divided by the number of companies that returned data, including zero figures, within a cell. For example, referring to Table 8, to calculate the product propensity of cell 31 only one company returned a figure other than 0 and two companies returned data within this cell. Therefore, the product propensity for cell 31 is 0.5 (1/2).
| Counts and aggregates | |||||||
|---|---|---|---|---|---|---|---|
| SIC | Size-band | Cell | Number of businesses in Universe | Number of responders | Employment in Universe | Employment in Responder’s Sample (sum) | Non represented employment |
| 3523 | 0 to 9 | 31 | 15 | 2 | 60 | 3 | 60-3= 57 |
| 3523 | 10 to 49 | 32 | 9 | 3 | 186 | 60 | 126 |
| 3523 | 50 to 99 | 33 | 0 | 0 | 0 | 0 | 0 |
| 3523 | 100 to 299 | 34 | 1 | 0 | 130 | 0 | 130 |
| 3523 | 300 or more | 35 | 3 | 3 | 27,881 | 27,881 | 0 |
Download this table Table 10: Non-represented employment
.xls .csvThe non-represented employment is calculated by subtracting the sum of the employment in responder's sample from the employment in the universe. Please see the example in the "non-represented employment" column in Table 10 for cell 31.
Once all values are calculated, the relevant figures are input into the original equation as follows:
Estimate (SIC 3523, CPA 353012)
= SAMPLE + BETA * PP * (NON-REPRESENTED EMPLOYMENT)
Inputting calculated figures into equation:
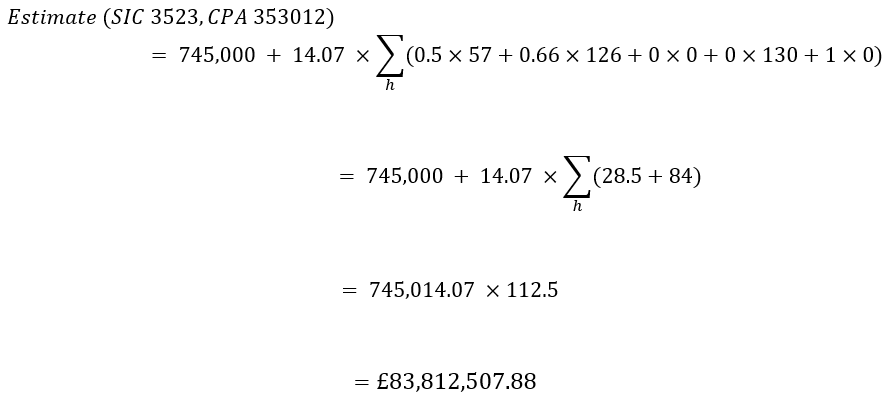
To conclude, the estimate for SIC 3523 and product 353012 is £83,812,507.88.
Outliering
An outlier is a business that reports valid data on the survey but is considered not to be representative of their business industry, because of an extreme value that differs significantly from other observations or unique circumstances. They are therefore excluded from the calculation of the total per head (TPH) sales figure for the businesses that are not sampled or have never returned figures. However, data from an outlier are still included in the total returned sales of businesses.
Once ranked, if the total per head (TPH) sales for a particular product falls into the top or bottom 5%, returns are trimmed. Outliers are trimmed when there are more than 10 responses by 4-digit SIC and CPA product. There are four main stages in the trimming process as explained in Tables 11, 12 and 13 and the equation that follows using the illustrated example.
| Company ID | Product 551010 | Employment | Total per head (TPH) |
|---|---|---|---|
| 120… | 10 | 5 | 2 |
| 121… | 13 | 10 | 1.3 |
| 122… | 10 | 255 | 0.04 |
| 123… | 75 | 64 | 1.17 |
| 124… | 25 | 30 | 0.83 |
| 125… | 50 | 47 | 1.06 |
| 126… | 500 | 9 | 55.56 |
| 127… | 100 | 300 | 0.33 |
| 128… | 150 | 25 | 6 |
| 129… | 1000 | 100 | 10 |
| 130… | 750 | 200 | 3.75 |
Download this table Table 11: Sample for product 551010, including emplyment and total per head value
.xls .csv
| Product 551010 | Employment | Total per head (TPH) |
|---|---|---|
| 10 | 255 | 0.04 |
| 100 | 300 | 0.33 |
| 25 | 30 | 0.83 |
| 50 | 47 | 1.06 |
| 75 | 64 | 1.17 |
| 13 | 10 | 1.3 |
| 10 | 5 | 2 |
| 750 | 200 | 3.75 |
| 150 | 25 | 6 |
| 1000 | 100 | 10 |
| 500 | 9 | 55.56 |
Download this table Table 12: Ranked sample for product 551010 including employment and total per head value
.xls .csv
| Product 551010 | Employment | Total per head (TPH) |
|---|---|---|
| 10 | 255¹ | 0.04¹ |
| 100 | 300 | 0.33 |
| 25 | 30 | 0.83 |
| 50 | 47 | 1.06 |
| 75 | 64 | 1.17 |
| 13 | 10 | 1.3 |
| 10 | 5 | 2 |
| 750 | 200 | 3.75 |
| 150 | 25 | 6 |
| 1000 | 100 | 10 |
| 500¹ | 9¹ | 55.56¹ |
Download this table Table 13: Example of trimming outliers for product 551010 including employment and total per head (TPH) value
.xls .csvStage 4 is to input all figures, excluding trimmed figures, into the following beta equation:
7. Publication and data dissemination
Publication of the Annual Survey of Goods and Services results
Estimates from the Annual Survey of Goods and Services (ASGS) are published on the Office for National Statistics' website. The first period of collecting data was for the 2016 reference period and these were published as proportions constrained to the Annual Business Survey (ABS) industry totals. ASGS data are published constrained to the ABS totals because the ABS is an established survey, which has a much larger sample than the ASGS (73,000 businesses compared with 40,000 businesses respectively). From 2017, data are published as levels rather than proportions using the ASGS industry and product totals.
Dissemination of the Annual Survey of Goods and Services results
Estimates from the ASGS are provided to the Prices and UK National Accounts Supply and Use team within the Office for National Statistics, and externally to the Scottish and Welsh Governments. These figures will be included as part of the calculations for the annual supply and use tables.
Nôl i'r tabl cynnwys8. Disclosure control and data confidentiality
Confidentiality protection requirement by law and Government Statistical Service (GSS) policy
The need to keep records of individuals, businesses or events used to produce official statistics confidential is enshrined in law. However, this does not prevent the release of anonymised or aggregated data.
The Code of Practice for Statistics guarantees confidentiality to those who provide private information to produce official statistics.
Furthermore, the Office for National Statistics (ONS) surveys are conducted on behalf of the UK Statistics Authority, and all outputs are subject to Section 39 of the Statistics and Registration Service Act 2007 (SRSA).
Business surveys operating within the UK are governed under the Statistics of Trade Act 1947. This makes participation in surveys compulsory, and confidentiality requirements that relate to published data are specified in Section 9 of the act. It also states that tables should not be published that would disclose any information relating to an individual business, unless there is expressed consent in writing from that business. In addition, data should not be published that would reveal the exact number of respondents contributing to a cell.
ONS confidentiality pledge
The confidentiality pledge is an assurance of confidentiality given to survey respondents and states:
"All the information you provide is kept strictly confidential. It is illegal for us to reveal your data or identify your business to unauthorised persons."
The Annual Survey of Goods and Services is conducted under the Statistics of Trade Act 1947. This act imposes restrictions on the way that data collected during the survey may be used, to ensure that information that can be attributed to an individual organisation is not disclosed in any publication. As the ASGS is outsourced to IFF Research, extra steps have been taken to ensure that respondents are reassured that their data is kept confidential. IFF adhere to ONS standards regarding the security of respondent's data and how they interact with businesses taking part in the survey.
Statistical disclosure control and the ONS
The ONS employ consistent disclosure control procedures ahead of publication. The Statistical Disclosure Control Policy sets out the standards for safeguarding the information provided in confidence to the ONS. The Government Statistical Service defines statistical disclosure control as follows:
"Statistical disclosure control (SDC) is the term used to cover the many methods of safeguarding the confidentiality of the information about individuals and businesses. Information obtained from surveys or administrative data is usually given in confidence. SDC is applied to ensure that individuals, businesses or other statistical units cannot be identified from published data, whether record-level data or tables. This will involve modifying data so that the risk of identification is reduced to an acceptable level."
These methods are applied if ethical, practical or legal considerations require the data to be protected. Statistical disclosure control is applied to the Annual Survey of Goods and Services (ASGS) data before publication.
Identifying disclosive data for the Annual Survey of Goods and Services
Disclosure is a particularly sensitive issue in business surveys, given the commercial confidentiality of the data collected. The flowchart in Figure 2 demonstrates how to identify disclosive data for publishing.
Figure 2: Identifying disclosive data for publishing

Source: Office for National Statistics – Annual Survey of Goods and Services
Notes:
“Cell” refers to an element of a published table, in the case of ASGS this is the combination of 4-digit SIC and employment size-band.
“Enterprise groups” – see “Reporting units” in Section 4 for full details on enterprise groups.
Download this image Figure 2: Identifying disclosive data for publishing
.png (49.4 kB)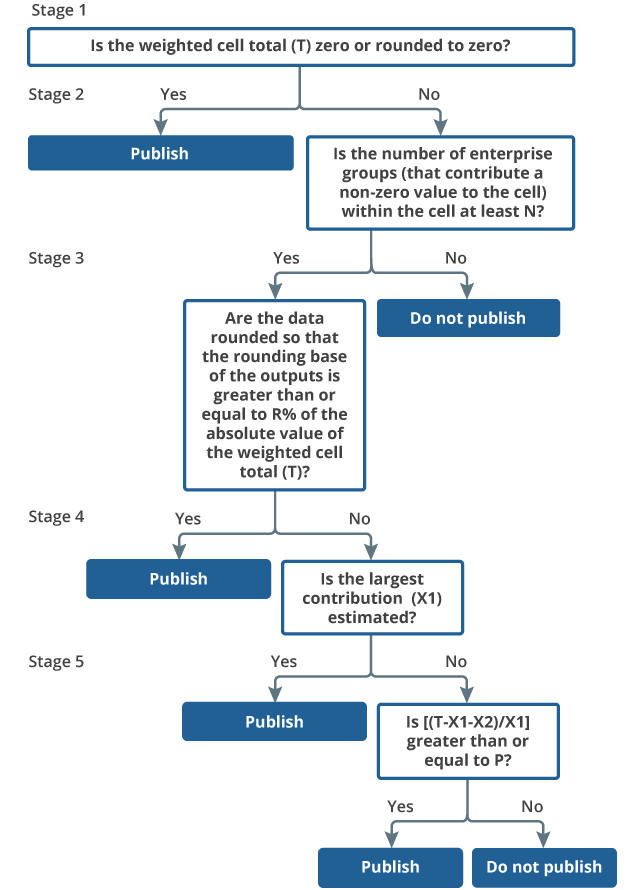
Disclosure control methods
Disclosure is a particularly sensitive issue in business surveys, given the commercial confidentiality of the data collected. The following rules are applied to ASGS estimates (except where the respondent is willing to allow the data to be published):
minimum threshold rule: this rule states that there must be at least *n* reporting units (businesses) in a cell
P% rule: the total contribution of the *m* largest contributors to the cell aggregated total must be less than *p%* of the total in that cell; sometimes this rule can be applied multiple times, with different values of *m* and *p*
dominance rule: the estimated total of all the units in the cell (including those not included in the sample), without the *d* largest units from the sample, must be at least *s%* if the largest *b* units in the sample
Businesses whose data have been suppressed, because of the level of disclosure, may be contacted following publication of the data to request permission to publish disclosed data.
Tau-Argus is the software used to disclose values. The Tau-Argus manual is available.
Nôl i'r tabl cynnwys9. Revisions policy
The Office for National Statistics (ONS) ensures that published estimates are as accurate as possible. However, if significant changes are made to source data after publication, then estimates will be revised. The ONS has a clear policy on how revisions are handled across the organisation and the specific procedure for the Annual Survey of Goods and Services (ASGS) is outlined in this section.
Planned revisions
While the ASGS is still in the development phase it will continued to be monitored and revised, if needed.
Unplanned revisions
In addition to planned revisions to the current and previous survey years, additional unplanned revisions may be published if they are considered to be large enough and of sufficient interest to users, such that a delay until the next standard release is not justifiable or if they effect data in more than just the current and previous survey years. The timing with which these revisions are released will consider:
the need to make the information available to users as soon as is practicable
the need to avoid two or more revisions (to the same data items) in quick succession, where this might cause confusion to users
All unplanned revisions will be released in compliance with the same principles as other new information.
Nôl i'r tabl cynnwys10. Future work
Questionnaire review
The ASGS will continue to be reviewed based on respondent feedback.
Regional estimates
Currently, the ASGS does not produce regional estimates. However, an investigation to conduct the feasibility of doing this is included within our workplan for the future, once the survey has fully developed at a national level.
Nôl i'r tabl cynnwys11. Contact and other information
A full analysis of the Development of the Annual Survey of Goods and Services was published in August 2018.
Quality and Methodology Information for the Annual Survey of Goods and Services was published in October 2019.
For further information, please contact the Annual Survey of Goods and Services (ASGS) team at ASGS@ons.gov.uk.
Nôl i'r tabl cynnwys