Cynnwys
- Main points
- Overview
- Your views matter
- Interactive wheel for the UK non-financial business economy
- UK non-financial business economy, sections A to S (part)
- Non-financial service industries, sections H to S (part)
- Production industries, sections B to E
- Distribution industries, section G
- Construction industries, section F
- Agriculture (part), forestry and fishing, section A
- Revisions to 2012 and 2013 ABS data
- European comparison
- Background notes
- Methodoleg
1. Main points
In 2013 the approximate Gross Value Added at basic prices (aGVA) of the UK Non-Financial Business Economy reached £1 trillion for the first time, with an estimated value of £1,001.1 billion. This amount represents the income generated by businesses in the UK, less the cost of goods and services used to create this income
Between 2012 and 2013, aGVA increased by 6.8% (£64.1 billion), the largest annual percentage increase following the recession in 2008. This increase is a continuation of the recovery seen between 2009 and 2012 and takes aGVA to a level 10.1% (£91.5 billion) above that seen in 2008, at the start of the recession
For the first year since the start of the recession in 2008 all sectors of the UK Non-Financial Business Economy, as measured by the Annual Business Survey (ABS), saw growth in aGVA between 2012 and 2013
The Non-Financial Service sector, which accounts for over half (55.0%) of aGVA in the UK Non-Financial Business Economy, contributed most to the increase in aGVA. The sector’s increase of 9.6% (£48.2 billion) between 2012 and 2013 was the fourth consecutive annual increase, taking it 24.3% (£107.6 billion) above the level seen in 2008
The Production sector, which accounts for just over a fifth (21.9%) of aGVA in the UK Non-Financial Business Economy, saw an increase in aGVA of 1.8% (£3.9 billion) between 2012 and 2013. The increase sees Production sector aGVA just £3.6 billion below the level in 2008
The Distribution sector, which accounts for 15.1% of aGVA in the UK Non-Financial Business Economy, also saw an increase in aGVA of 4.7% (£6.8 billion) between 2012 and 2013. Following two consecutive annual decreases between 2010 and 2012, aGVA in 2013 remains £6.5 billion below the level seen in 2008
The Construction sector, which accounts for 7.9% of aGVA in the UK Non-Financial Business Economy, saw an increase in aGVA of 6.5% (£4.8 billion) between 2012 and 2013. This is the third consecutive year of growth, which leaves Construction aGVA £6.2 billion lower than the level in 2008
The revised results show small revisions for the UK Non-Financial Business Economy compared with the previous estimate published on 13 November 2014. There were downward revisions of 0.4% (£13.7 billion) in turnover, 0.2% (£4.3 billion) in purchases and 1.1% (£11.5 billion) in aGVA. aGVA for 2012 was revised up by 0.1% (£0.7 billion)
2. Overview
Estimates of the size and growth of the UK Non-Financial Business Economy for 2013 as measured by the Annual Business Survey (ABS), are presented in this release. It is the key resource for understanding the detailed structure, conduct and performance of businesses across the UK. These figures are revised from those published as part of the November 2014 release as more data has become available. Revisions are an inevitable consequence of the trade-off between timeliness and accuracy. The release covers the following sectors:
-non-financial services (includes professional, scientific, communication, administrative, transport, accommodation and food, private health and education, entertainment services)
distribution (includes retail, wholesale and motor trades)
production (includes manufacturing, oil and gas extraction, energy generation and supply)
construction
parts of agriculture (includes agricultural support services, forestry and fishing)
Together these industries represent the UK Non-Financial Business Economy and account for around two thirds of the whole economy of the UK in terms of Gross Value Added. Public administration and defence, public sector health and education, finance and farming make up the difference between the UK Non-Financial Business Economy and the whole economy.
Estimates published in this release include turnover, purchases, approximate Gross Value Added at basic prices (aGVA) and employment costs. All data are reported at current prices (effect of price changes included).
Where the recession is mentioned it refers to the contraction of Gross Domestic Product (GDP) that started in 2008, the year from which a consistent ABS time series is available. For more information about the survey see the background notes.
The ABS has a wide range of uses: for example, ABS statistics are essential contributors to the UK National Accounts, including the measurement of GDP, they are supplied to Eurostat to meet the requirements of the European Structural Business Statistics (SBS) Regulation, and are used by the devolved administrations and central and local government to monitor and inform policy development.
ABS data are also used to produce adhoc analyses such as the recently published Median Value Added Per Registered Business, 2013 release. For other uses see background note 4.
Questions often asked of the ABS release are 'What is aGVA?' and ‘How does the measure of aGVA differ from the GVA measure in the National Accounts?’. For an overview of aGVA please see our new infographic 'What is aGVA?'. National Accounts carry out coverage adjustments, conceptual adjustments and coherence adjustments. The National Accounts estimate of GVA uses input from a number of sources, and covers the whole UK economy, whereas ABS does not include farming, financial or public sectors. ABS total aGVA is around two thirds of the National Accounts whole economy GVA because of these differences. For further information on aGVA, see background note 9. There is also a recently published article ‘A Comparison between ABS and National Accounts Measures of Value Added’ (462.3 Kb Pdf) which provides more detail.
ONS makes every effort to provide informative commentary on the data in this release. Where possible, the commentary draws on evidence from businesses or other sources of information to help explain possible reasons behind the observed changes. However, in some places it can prove difficult to elicit detailed reasons for movements, for example, businesses may state a ‘change in the nature of business activity’. Consequently, it is not possible for all data movements to be fully explained.
Nôl i'r tabl cynnwys3. Your views matter
We are interested in your views of our data and publication. Please take time to complete a short survey before 14 August 2015.
We constantly aim to improve this release and its associated commentary. We would welcome any feedback you might have, and would be particularly interested in knowing how you make use of these data to inform your work. Please contact us via email: abs@ons.gov.uk or telephone Jon Gough on +44 (0)1633 456720.
Nôl i'r tabl cynnwys4. Interactive wheel for the UK non-financial business economy
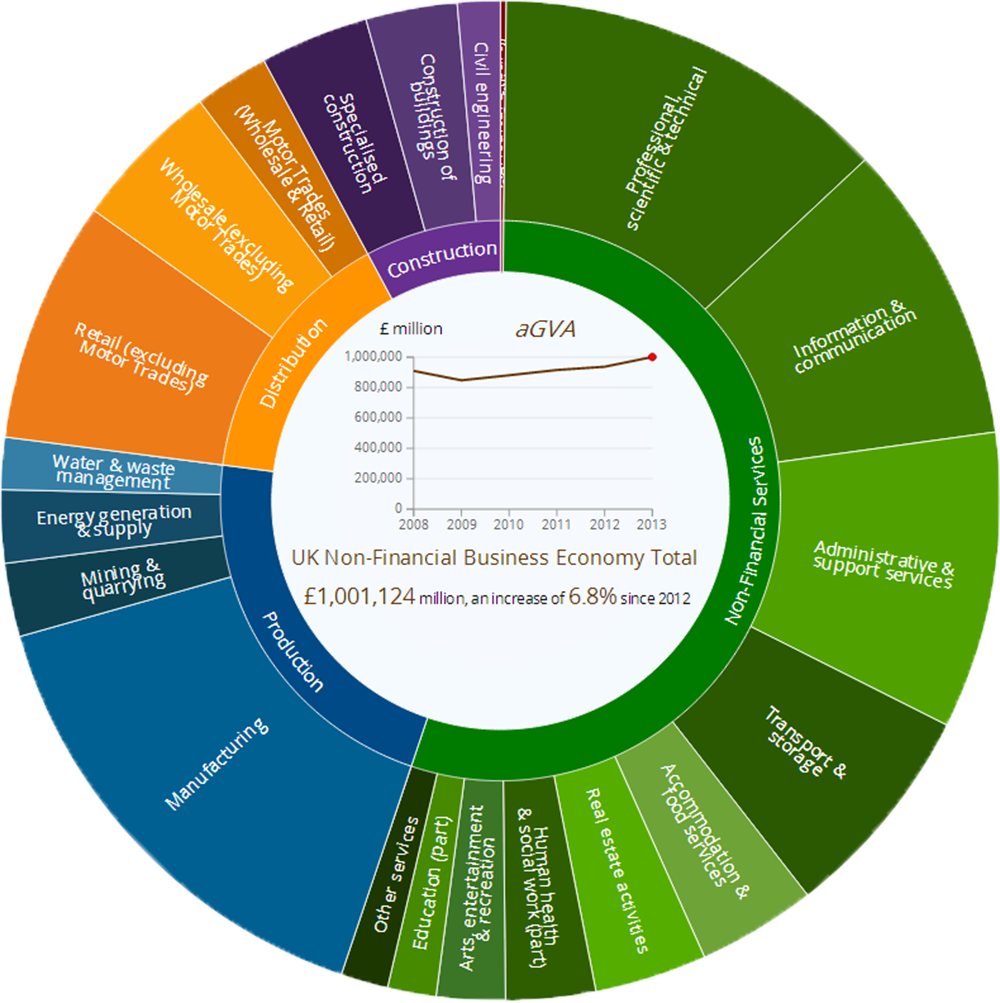
Use the Interactive Wheel updated with the latest figures for 2012 and 2013 to investigate which sectors contribute most to the UK Non-Financial Business Economy. Focus on the Business Economy as a whole or each sector and switch between aGVA, Turnover and Purchases.
5. UK non-financial business economy, sections A to S (part)
In 2013, the income generated by businesses in the UK, less the cost of goods and services used to create this income was estimated to be £1,001.1 billion. This amount represents the approximate Gross Value Added at basic prices (aGVA) of the UK Non-Financial Business Economy. Between 2012 and 2013 aGVA increased by 6.8% (£64.1 billion); a continuation of the recovery seen between 2009 and 2012. This increase resulted in aGVA for 2013 reaching £1 trillion for the first time, at a level 10.1% (£91.5 billion) above that seen in 2008, at the start of the recession.
The main components of aGVA are:
turnover (the main component of income)
purchases (the main component of the consumed goods and services)
The consecutive annual increases seen in aGVA follow a similar pattern of increases in both turnover and purchases. Turnover increased by 6.2% (£207.2 billion) between 2012 and 2013, while purchases of goods, materials and services increased at a similar rate of 6.4% (£150.2 billion), resulting in a 6.8% growth in aGVA. As with aGVA, turnover and purchases were above levels seen in 2008 at the start of the recession for the third consecutive year (see Figure 1).
The recession and recovery described by the ABS between 2008 and 2013 is broadly in line with Gross Domestic Product (GDP) figures published in the National Accounts. Both the ABS aGVA estimates and the latest National Accounts GDP estimates (taken from the Second Estimate for Quarter 1 (Jan to Mar) 2015) show a fall between 2008 and 2009 and now four consecutive annual increases from 2009 to 2013 led by the Service sector.
Due to the need to balance timeliness of the data with the accuracy, in-line with the ABS Revisions Policy, ABS Provisional results are published in November with further quality assurance then leading to planned revisions to the data in subsequent releases.
These revisions usually arise from the receipt of additional data and the revision of existing data by businesses responding to the ABS, which may include restructures that can result in data being reallocated to a different industry.
When compared with the ABS Provisional results published on 13 November 2014, the revised 2013 results show minimal revision for the UK Non-Financial Business Economy. There were downward revisions to the 2013 estimates of 0.4% (£13.7 billion) in turnover, 0.2% (£4.3 billion) in purchases and 1.1% (£11.5 billion) in aGVA. The majority of the aGVA downward revisions were in Production and Non-financial services, which together accounted for 71% of the overall revision.
Estimates of aGVA in 2012 have been revised up by 0.1% (£0.7 billion), as a result of upward revisions in Construction, Production and Distribution, with a balancing downwards revision in Non-financial services.
Despite the revisions, the direction of movements of aGVA between 2012 and 2013 for the broad industry groups remains unchanged to that published in November 2013.
For details of the revisions to each sector see the later chapter on Revisions.
A list of industries which are included in the ABS measure of the UK Non-Financial Business Economy, can be found in background note 9.
Figure 1: UK non-financial business economy, turnover and purchases and resulting aGVA
2008 to 2013
Source: Office for National Statistics
Notes:
- A list of industries which are included in the ABS measure of the UK Non-Financial Business Economy, can be found in background note 9
Download this chart Figure 1: UK non-financial business economy, turnover and purchases and resulting aGVA
Image .csv .xlsFor the first year since the start of the recession in 2008 all sectors of the UK Non-Financial Business Economy, as measured by ABS, saw growth in aGVA between 2012 and 2013 (see Figures 2 and 3).
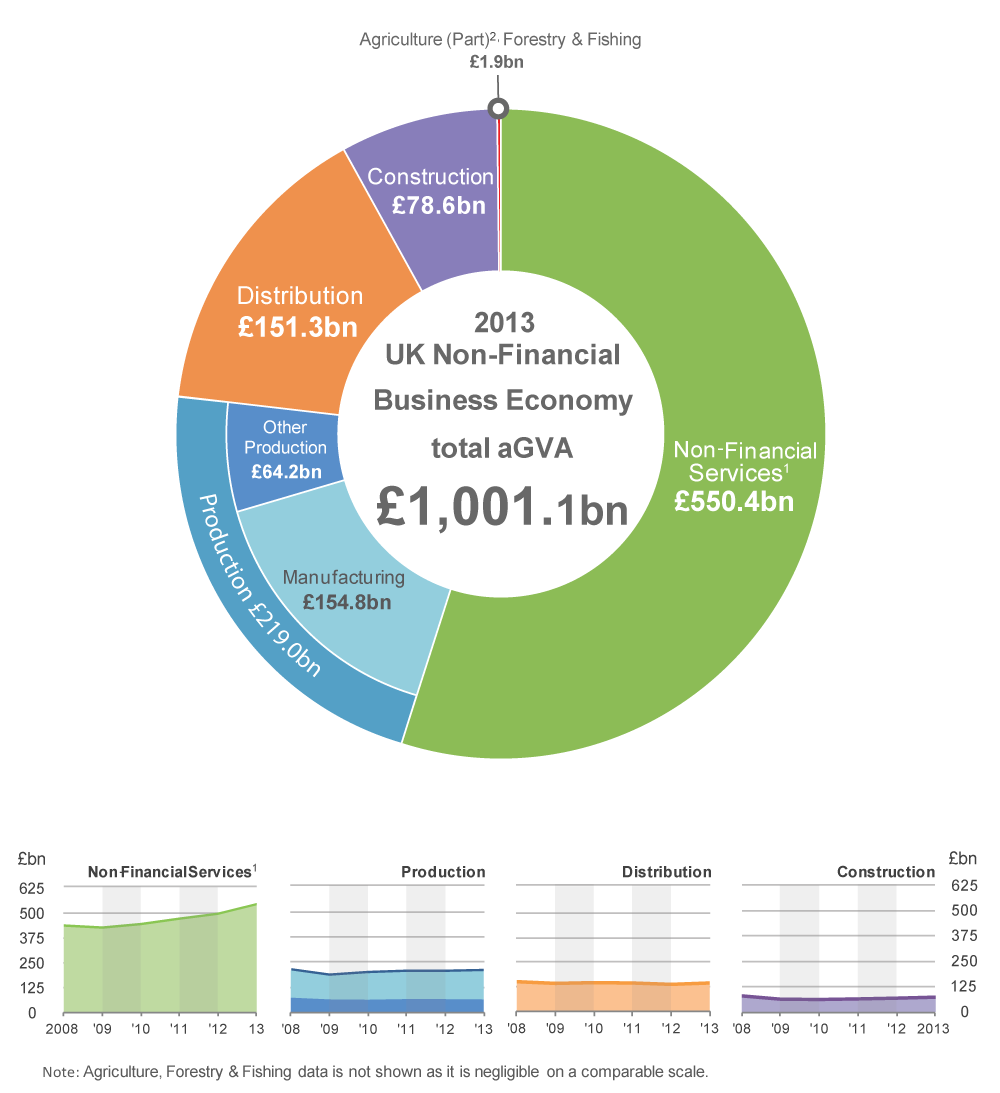
Non-Financial Services, the largest industry sector of the UK Non-Financial Business Economy contributed most to the increase in aGVA. The Non-Financial Service sector aGVA rose by 9.6% (£48.2 billion) between 2012 and 2013, the fourth consecutive annual increase, taking aGVA to £550.4 billion.
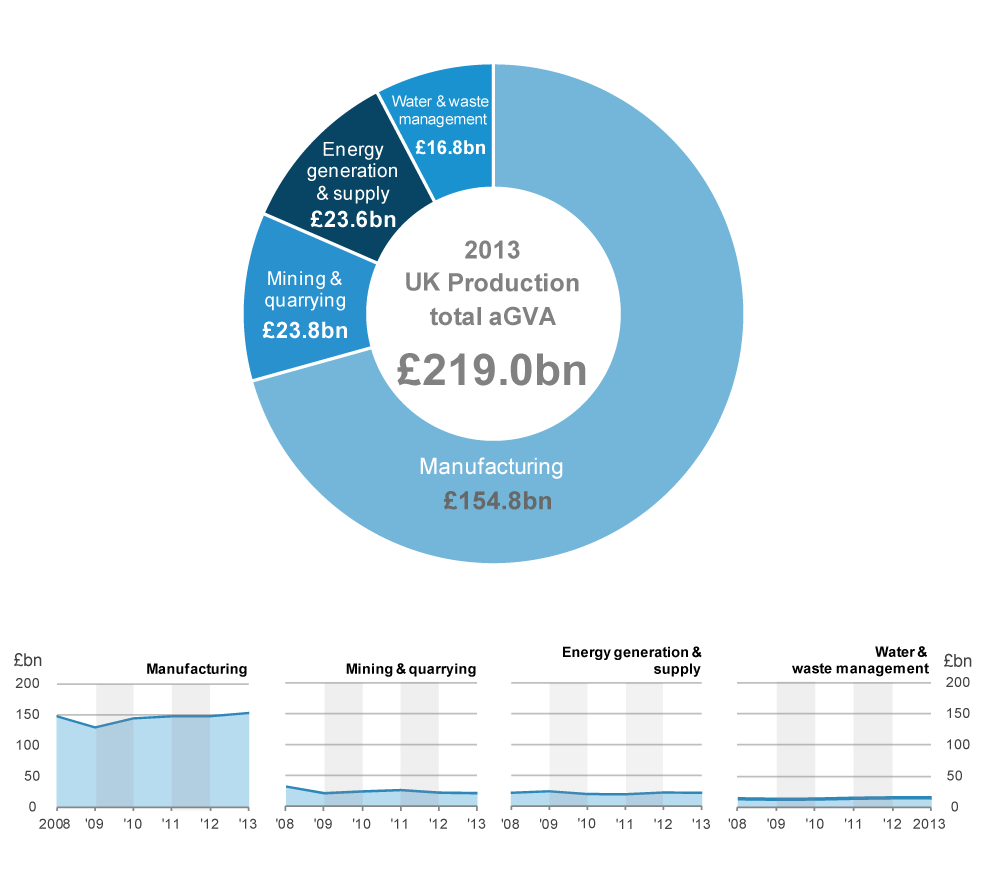
The Production sector saw an increase of 1.8% (£3.9 billion) in aGVA following a slight fall between 2011 and 2012. This increase sees aGVA for the Production sector at £219.0 billion, just below the £222.5 billion seen in 2008, at the start of the recession.
The Distribution sector experienced an increase in aGVA for the first time since 2010, with a rise of 4.7% (£6.8 billion) between 2012 and 2013. This increase took aGVA to £151.3 billion, which is still below the £157.8 billion seen in 2008.
The Construction sector experienced growth in aGVA for the third consecutive year, increasing by 6.5% (£4.8 billion) from £73.8 billion in 2012 to £78.6 billion in 2013. However, as with the Distribution sector, aGVA still remains below the level seen in 2008 (£84.8 billion).
The Agriculture (part), Forestry & Fishing sector experienced the largest percentage rise in aGVA of all the sectors, with a 32.4% (£0.5 billion) increase between 2012 and 2013. At £1.9 billion, aGVA for the industry is now above the level seen in 2008 for the first time.
Figure 2: UK Non-Financial Business Economy, aGVA by sector, 2008 to 2013
Source: Office for National Statistics
Notes:
- Excludes Financial and insurance; Public administration and defence; Public provision of Education; Public provision of Health and all medical and dental practice activities
- Excludes crop and animal production
Figure 3: UK non-financial business economy, aGVA change by sector
2008 to 2013
Source: Office for National Statistics
Notes:
- A list of industries which are included in the ABS measure of the UK Non-Financial Business Economy, can be found in background note 9
Download this chart Figure 3: UK non-financial business economy, aGVA change by sector
Image .csv .xls
Figure 4: UK non-financial business economy, aGVA by section
2013
Source: Office for National Statistics
Notes:
- A list of industries which are included in the ABS measure of the UK Non-Financial Business Economy, can be found in background note 9
Download this chart Figure 4: UK non-financial business economy, aGVA by section
Image .csv .xlsWhen analysing those sections which have made the largest contributions to aGVA growth between 2012 and 2013 (see Figure 5), two sections stand out, with a combined contribution of nearly 40% of the aGVA growth:
Professional, scientific & technical activities (Section M)
Administrative & support service activities (Section N)
Only 3 sections (all in the Production sector) are showing a fall in aGVA for 2013, compared with 2012.
Figure 5: UK non-financial business economy, aGVA change by section
2012 to 2013
Source: Office for National Statistics
Notes:
- A list of industries which are included in the ABS measure of the UK Non-Financial Business Economy, can be found in background note 9
Download this chart Figure 5: UK non-financial business economy, aGVA change by section
Image .csv .xlsFurther detail on these industry sections can be found in the subsequent chapters which describe the Non-Financial Services sector (Sections H to S), the Production sector (Sections B to E including Manufacturing), the Distribution sector (Section G), the Construction sector (Section F) and the Agriculture (part), Forestry & Fishing sector (Section A).
Nôl i'r tabl cynnwys6. Non-financial service industries, sections H to S (part)
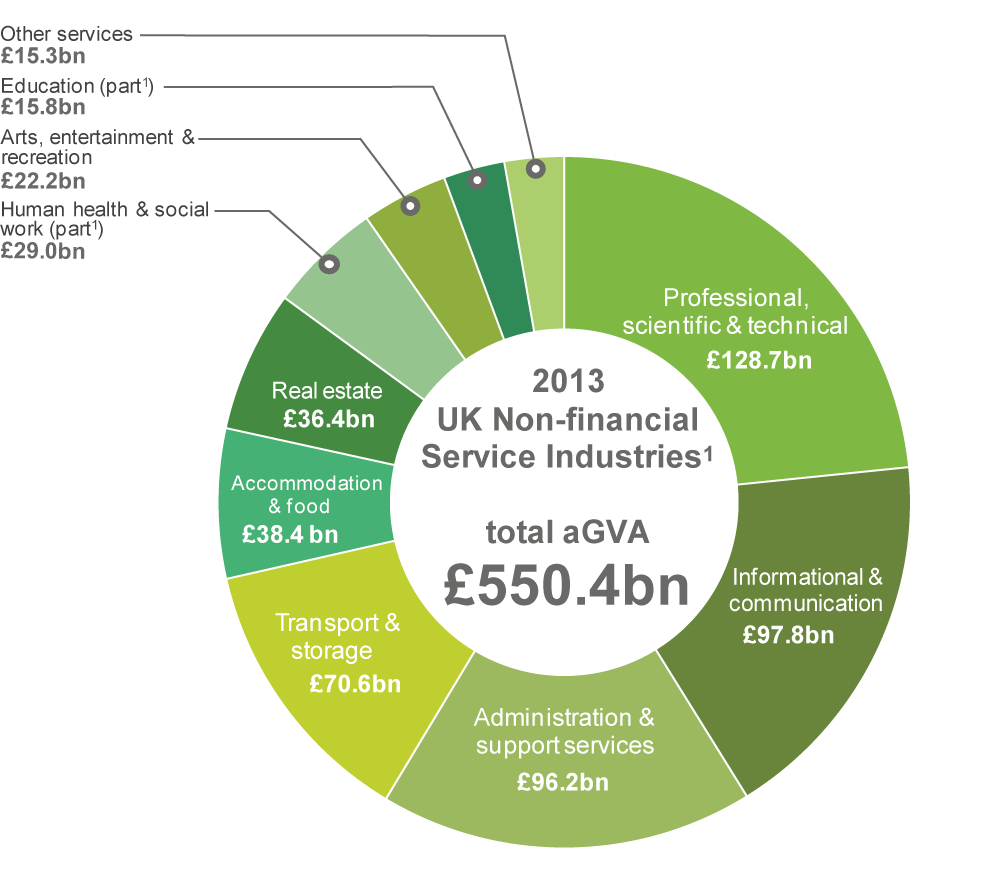
Non-Financial Services sector contributed £550.4 billion, over a half (55.0%) of the estimated aGVA total of £1,001.1 billion in 2013 for the UK Non-Financial Business Economy.
Between 2012 and 2013 Non-Financial Service turnover increased at a higher rate than purchases, 6.8% (£71.9 billion) compared with 4.8% (£27.0 billion). Together with a rise in stock levels and changes in subsidies and taxes, this resulted in aGVA rising by 9.6% (£48.2 billion). This is the fourth consecutive year of growth in aGVA for the sector, following the fall between 2008 and 2009. Turnover, purchases and aGVA are now well above the level seen in 2008 at the start of the recession (see Figure 6).
For details of revisions to 2012 and 2013 Non-Financial Service data see the later chapter on Revisions.
Figure 6: Non-financial services, turnover and purchases and resulting aGVA
2008 to 2013
Source: Office for National Statistics
Notes:
- A list of industries which are included in the ABS measure of the UK Non-Financial Business Economy, can be found in background note 9
Download this chart Figure 6: Non-financial services, turnover and purchases and resulting aGVA
Image .csv .xlsAll of the industry sections within the Non-Financial Service sector continued to see increases in aGVA between 2012 and 2013 (see Figures 7 and 8).
Those industries which have made the largest contributions to growth are:
professional, scientific and technical activities (Section M)
administrative and support service activities (Section N)
arts, entertainment and recreation (Section R)
information and communication (Section J)
transport and storage (Section H)
These industries, which together accounted for an increase in aGVA of £38.6 billion, are described in more detail after Figure 7b.
Figure 7a: Non-financial services, aGVA by section, 2013
Source: Office for National Statistics
Notes:
- Excludes Financial and insurance; Public administration and defence; Public provision of Education; Public provision of Health and all medical and dental practice activities
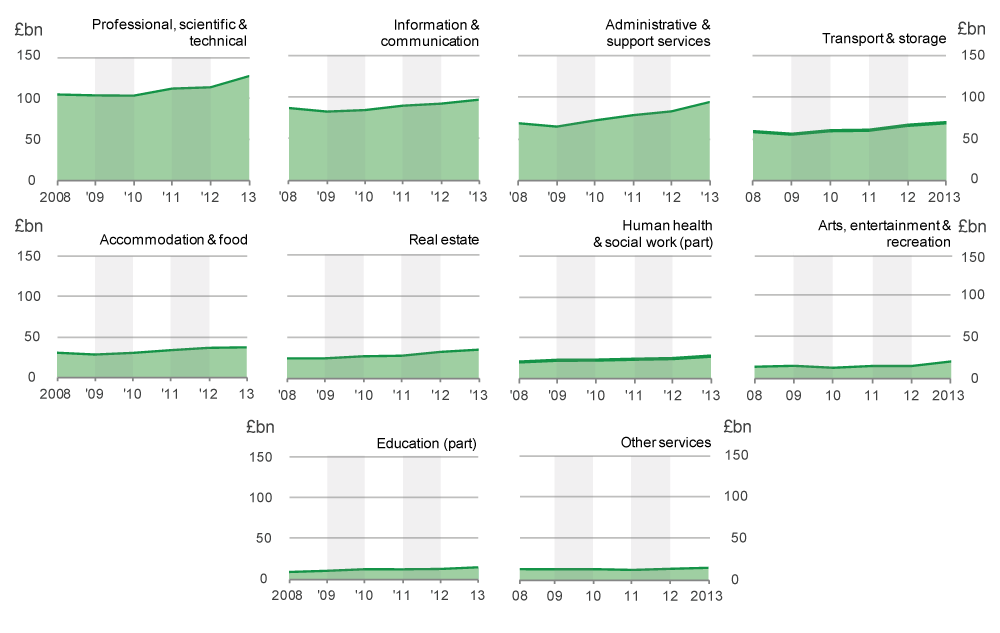
Figure 7b: Non-financial services, aGVA by section, 2008 to 2013
Source: Office for National Statistics
Notes:
- Excludes Financial and insurance; Public administration and defence; Public provision of Education; Public provision of Health and all medical and dental practice activities
Professional, scientific & technical activities (section M)
Turnover in Professional, scientific & technical activities increased by 9.7% (£20.2 billion) between 2012 and 2013, with purchases increasing by 8.6% (£8.0 billion). The resulting growth in aGVA of 11.9% (£13.7 billion), meant aGVA remained above the level reported in 2008 for the third consecutive year.
This broad section, which covers a range of industries from Legal & accounting activities to Advertising & market research and Veterinary activities, saw increases in aGVA in almost all its divisions between 2012 and 2013. Those having the largest impact on aGVA growth were Activities of head offices; management consultancy (Division 70) and Architectural & engineering activities; technical testing & analysis (Division 71) which between them contributed £8.5 billion to the increase in aGVA. However, Scientific Research & Development (Division 72) showed a decrease of £1.3 billion in aGVA over this period.
Administrative & support services (section N)
Between 2012 and 2013 Administrative & support services saw turnover rise by 8.8% (£15.2 billion), while purchases increased by 5.2% (£4.6 billion) leading to an aGVA increase of 13.3% (£11.3 billion).
The main industries contributing to growth within Administrative & support services were Employment activities (Division 78) where aGVA increased by 16.4% (£4.0 billion). Office administrative, office support & other business support activities (Division 82) also made a substantial contribution with a 15.7% (£3.2 billion) increase in aGVA.
Arts, entertainment & recreation (section R)
Turnover in Arts, entertainment & recreation increased by 8.0% (£8.9 billion) between 2012 and 2013, while purchases increased by 3.2% (£3.0 billion) leading to a 34.5% (£5.7 billion) rise in aGVA. This growth was driven by Gambling & betting (Division 92) where aGVA increased by 67.4% (£3.5 billion). The growth in this industry could in part be attributed to the types and geographical spread of the interactive entertainment industry and increase in internet usage in recent years.
Information & communication (section J)
Turnover in Information & communication increased by 3.8% (£7.3 billion) between 2012 and 2013 which, coupled with a smaller 3.8% (£3.7 billion) increase in purchases, resulted in an increase in aGVA of 5.1% (£4.8 billion) between 2012 and 2013.
The main division causing the growth in aGVA within this section was Computer programming, consultancy & related activities (Division 62), with an increase of 7.7% (£3.1 billion) between 2012 and 2013. The development of mobile phone applications are included in this division. The addition of mobile phone applications to the CPI basket in 2011 and increase in internet use on mobile devices indicates this activity has been increasing in importance in recent years.
Transport & storage (section H)
Turnover in Transport & storage increased by 3.5% (£5.3 billion) between 2012 and 2013, with purchases rising by 2.6% (£2.3 billion) resulting in a 4.6% (£3.1 billion) increase in aGVA.
The main divisions contributing to aGVA growth within Transport & storage were Warehousing & support activities for transportation (Division 52) and Air transport (Division 51). Increases in this sector may be related to the effect of the internet economy. Data on the retail sector indicates that turnover from mail order and via the internet continued to increase at a higher rate than turnover from shops. An increase seen in Warehousing & support activities for transportation is likely to partly result from the storage of items ordered from the internet.
Figure 8: Non-financial services, aGVA growth by section
2008 to 2013
Source: Office for National Statistics
Notes:
- A list of industries which are included in the ABS measure of the UK Non-Financial Business Economy, can be found in background note 9
Download this chart Figure 8: Non-financial services, aGVA growth by section
Image .csv .xlsWithin these sections, at a division level, Computer programming, consultancy & related activities (Division 62) made the largest contribution to Non-Financial Services aGVA with £42.9 billion in 2013, followed by Legal & accounting services (Division 69) with £40.0 billion (see Figure 9).
Figure 9: Non-financial services, aGVA by division
2013
Source: Office for National Statistics
Notes:
- A list of industries which are included in the ABS measure of the UK Non-Financial Business Economy, can be found in background note 9
Download this chart Figure 9: Non-financial services, aGVA by division
Image .csv .xlsActivities of head offices, management consultancy (Division 70) showed the largest aGVA growth at 20.3% (£4.9 billion) between 2012 and 2013, followed by Employment activities (Division 78) with 16.4% (£4.0 billion) increase in aGVA (see Figure 10).
Computer programming (which made the largest overall divisional contribution to Non-financial services in Figure 9) also showed the sixth largest growth in aGVA of 7.7% (£3.1 billion) in 2013. This division includes the development of mobile phone applications which has been increasing in importance in recent years.
The largest fall in aGVA during 2013 was in Scientific research & development (Division 72) which showed a decrease of 27.3% (£1.3 billion).
Figure 10: Non-financial services, aGVA change by division
2012 to 2013
Source: Office for National Statistics
Notes:
- A list of industries which are included in the ABS measure of the UK Non-Financial Business Economy, can be found in background note 9
Download this chart Figure 10: Non-financial services, aGVA change by division
Image .csv .xls7. Production industries, sections B to E
The Production sector in 2013 provided £219.0 billion, just over a fifth (21.9%) of the estimated aGVA total of £1,001.1 billion for the UK Non-Financial Business Economy.
Between 2012 and 2013 Production sector turnover and purchases increased by 1.4% (£9.6 billion) and 1.7% (£8.0 billion) respectively. Together with rises in stock levels and changes in taxes, this led to an increase in aGVA of 1.8% (£3.9 billion), which followed a slight fall between 2011 and 2012. The increase sees Production sector aGVA just £3.6 billion below the level in 2008, at the start of the recession (see Figure 11).
For details of revisions to 2012 and 2013 Production data see the later chapter on Revisions.
Figure 11: Production, turnover and purchases and resulting aGVA
2008 to 2013
Source: Office for National Statistics
Download this chart Figure 11: Production, turnover and purchases and resulting aGVA
Image .csv .xlsManufacturing (Section C), which contributes 70.7% of Production sector aGVA, saw a rise in aGVA of 3.5% (£5.3 billion) between 2012 and 2013, and was the reason for overall growth.
Over the same period the other sections in the Production sector: B (Mining & quarrying), E (Water & waste management) and D (Energy generation & supply), saw decreases in aGVA of 3.1% (£0.8 billion), 0.3% (£0.1 billion) and 2.4% (£0.6 billion) respectively (see Figures 12 and 13).
Figure 12: Production, aGVA by section, 2008 to 2013
Source: Office for National Statistics
Figure 13: Production, aGVA change by section
2008 to 2013
Source: Office for National Statistics
Download this chart Figure 13: Production, aGVA change by section
Image .csv .xlsManufacturing (section C)
There are five divisions that contribute almost a half (46.6%) of the overall Manufacturing aGVA in 2013 which are (see Figure 14):
manufacture of food products (Division 10)
manufacture of fabricated metal products, except machinery & equipment (Division 25)
manufacture of motor vehicles, trailers & semi-trailers (Division 29)
manufacture of machinery & equipment n.e.c. (Division 28)
manufacture of other transport equipment (Division 30)
Figure 14: Manufacturing, aGVA by division
2013
Source: Office for National Statistics
Notes:
- Information for Beverages and Tobacco products, suppressed to avoid disclosure
Download this chart Figure 14: Manufacturing, aGVA by division
Image .csv .xlsBetween 2012 and 2013 Manufacturing saw increases of 1.1% (£5.4 billion) in turnover and 0.3% (£0.9 billion) in purchases which, together with rises in stock levels and changes in taxes, contributed to an increase in aGVA of 3.5% (£5.3 billion).
The increase in Manufacturing aGVA was mainly in:
manufacture of motor vehicles, trailers & semi-trailers (Division 29)
manufacture of other transport equipment (Division 30)
Together these two divisions contributed £4.5 billion to the overall £5.3 billion increase in Manufacturing aGVA (see Figure 15).
Accounting for 45.3% of the overall manufacturing aGVA growth in 2013 was Manufacture of motor vehicles, trailers & semi-trailers (Division 29), where the aGVA increase of £2.4 billion can be largely attributed to the increase in sales and, in particular, export of high-end vehicles. The Society of Motor Manufacturers and Traders (SMMT) reported in 2013 that the number of vehicles produced in the UK fell rapidly during the recession, from 1.8 million in 2007 to 1.1 million in 2009. The industry has now partially recovered with 1.5 million vehicles being produced in 2013.
New overseas contracts awarded to businesses in Manufacture of other transport equipment (Division 30), which includes manufacture of air and space craft, contributed to the aGVA increase of £2.1 billion. As detailed in a short story released by ONS (What does the UK aerospace industry look like today?), the importance of Aerospace to the UK economy has been increasing for a number of years. A House of Commons economic and statistics policy paper (The aerospace industry: statistics and policy) states “The UK Government consider the aerospace industry a “phenomenal success story” and a sector that offers “tremendous opportunities for growth”.
Across Manufacturing almost 60% (14 out of 24) of the divisions contributing to this sector experienced increases in aGVA between 2012 and 2013.
Other reasons cited by businesses as contributing to the rise in Manufacturing aGVA were businesses restructuring, the take-over of a similar business, the gaining of new contracts and reduction in purchases.
The 58.5% (£1.3 billion) decrease in aGVA for Manufacture of coke & refined petroleum products (Division 19) is caused by decreases in both turnover and purchases resulting from restructuring of businesses within the Industry. There is also an 11.2% (£1.6 billion) decrease in aGVA for Manufacture of machinery and equipment (Division 28). Due to the small size of these divisions in terms of Manufacturing aGVA, annual changes should be viewed with care.
Figure 15: Manufacturing, aGVA change by division
2012 to 2013
Source: Office for National Statistics
Notes:
- Information for Beverages and Tobacco products, suppressed to avoid disclosure
Download this chart Figure 15: Manufacturing, aGVA change by division
Image .csv .xlsThe recession and recovery in the Manufacturing sector described by the ABS, between 2008 and 2013, is broadly in line with movements in comparable industries of 'UK Manufacturers' sales by product (PRODCOM)' figures published by ONS. PRODCOM 's 'Total Sales of Businesses Classified to this Industry' figure is broadly comparable with the ABS total turnover figures. Both the ABS turnover estimates and the PRODCOM industry total sales estimates show a fall between 2008 and 2009 and then annual increases from 2009 to 2013, with ABS showing a slight fall in 2012.
Other production (sections B, D to E)
This sector consists of Mining & quarrying (Section B, which includes oil and gas extraction), Energy generation & supply (Section D) and Water & waste managements (Section E). The sector saw larger increases in purchases than turnover, 1.4% (£7.1 billion) and 0.3% (£4.2 billion) respectively, which resulted in a decrease in aGVA of 1.7% (£1.4 billion).
The industry contributing the most to this decrease was Mining & quarrying.
Mining & quarrying (section B, which includes oil and gas extraction)
Turnover in Mining & quarrying decreased by 3.0% (£1.5 billion) while purchases increased by 2.6% (£0.7 billion). The main contributor was Extraction of crude petroleum and natural gas (Division 06). A possible reason for these changes is the reduction in oil extraction. North Sea oil and gas reserves are becoming increasingly difficult to extract, in part due to ageing extraction equipment which has required extensive repairs and maintenance. Also natural declines in the reserves in older fields were further exacerbated in 2013 by an increased amount of time lost to unplanned shutdowns. Despite increased levels of investment, production efficiency has declined, as there is expected to be a time lag in the investment being reflected in increased production. This has resulted in a 3.1% (£0.8 billion) decrease in aGVA.
Energy generation & supply (section D)
Electricity generation & supply also saw an increase between 2012 and 2013. Turnover increased by 3.9% (£4.2 billion) and purchases by 6.1% (£5.1 billion), which resulted in an aGVA decrease of 2.4% (£0.6 billion).
The continuing population rise of micro-businesses (those with less than 10 employees) in this sector is thought to be due to the growth of small producers of renewable energy encouraged by various green grants, subsidies and "feed in tariffs". Between 2012 and 2013 the number of micro-businesses in this area increased by 42.8% (to over 2,300).
Notes for Production industries, sections B to E
Manufacturing (Section C)
Please note that the ABS figures for the Manufacturing industries should not be compared directly with PRODCOM 's 'Total Sales of Businesses Classified to this Industry' figure because:
- PRODCOM publish a calendar year figure whereas ABS figures are based on annual responses from businesses cover a range of financial years
- PRODCOM focuses on products whilst ABS focuses on activities. The total value of production, in a particular industry, may differ from the turnover reported by ABS as an enterprise might carry out other activities, in addition to production, that contribute to its turnover
- PRODCOM and ABS produce estimates using different sampling and statistical methodologies
- PRODCOM publish industrial classes excluding HMRC Duty, while ABS publishes turnover inclusive of Duty
8. Distribution industries, section G
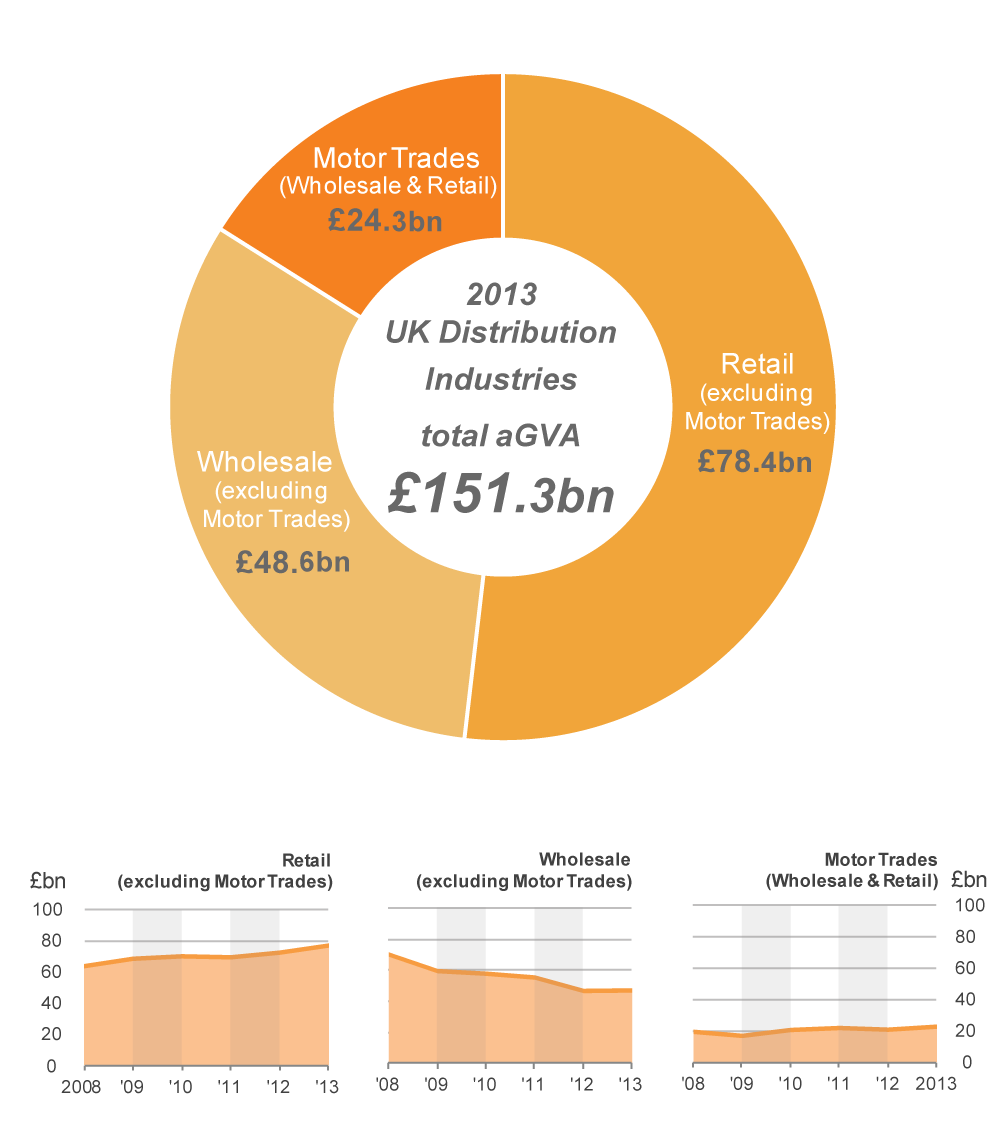
The Distribution industries in 2013 contributed £151.3 billion, 15.1% of the estimated aGVA total of £1,001.1 billion for the UK Non-Financial Business Economy in 2013.
This sector saw an 8.5% (£116.2 billion) rise in turnover and a 9.2% (£110.5 billion) increase in purchases between 2012 and 2013 (see Figure 16). This contributed to the increase in aGVA of 4.7% (£6.8 billion). This is the first annual increase in aGVA since 2010.
For details of revisions to 2012 and 2013 Distribution data see the later chapter on Revisions.
Figure 16: Distribution, turnover and purchases and resulting aGVA
2008 to 2013
Source: Office for National Statistics
Download this chart Figure 16: Distribution, turnover and purchases and resulting aGVA
Image .csv .xlsIncreases in aGVA were seen in all three divisions within Distribution (see Figures 17 and 18), with the largest increase between 2012 and 2013 seen in Retail (excluding Motor Trades - Division 47).
Figure 17: Distribution, aGVA by division, 2008 to 2013
Source: Office for National Statistics
Retail (excluding motor trades) (division 47)
Retail aGVA saw an increase of 6.2% (£4.6 billion) between 2012 and 2013. This growth in aGVA was a result of a 2.8% (£9.8 billion) increase in turnover and a smaller 2.2% (£6.2 billion) increase in purchases.
The increases in aGVA were driven by a 7.4% (£2.3 billion) rise in Retail sale in non-specialised stores (Group 47.1) which includes retail sales in super-stores and department stores.
Reports from businesses continued to indicate that turnover from mail orders and via the internet increased at a higher rate than turnover from shops. Although increasing, retail sales from mail order and the internet remains a small share of total turnover.
Motor trades (wholesale and retail) (division 45)
Between 2012 and 2013 both purchases and turnover increased, by 7.2% (£8.7 billion) and 6.7% (£9.6 billion) respectively. This resulted in aGVA increasing by 8.7% (£1.9 billion), following a decrease last year.
Within Motor Trades, Sale of motor vehicles (Group 45.1) contributed most to the growth with an 11.8% (£1.4 billion) increase in aGVA between 2012 and 2013. This increase comes after a slight fall of 1.6% (£0.2 billion) in aGVA between 2011 and 2012.
Wholesale (excluding motor trades) (division 46)
Wholesale experienced similar increases in both turnover of 11.0% (£96.8 billion) and purchases of 11.9% (£95.6 billion) between 2012 and 2013 which resulted in a small increase in aGVA of 0.6% (£0.3 billion).
Figure 18: Distribution, aGVA change by division
2008 to 2013
Source: Office for National Statistics
Download this chart Figure 18: Distribution, aGVA change by division
Image .csv .xlsNotes for Distribution industries, section G
Retail (excluding motor trades) (division 47)
Please note that the ABS figures for the Retail industry should not be compared directly with the annual 'value non seasonally adjusted’ figures in the monthly 'Retail Sales Inquiry' release because:
- the ABS figures cover the United Kingdom, while the 'Retail Sales Inquiry' covers Great Britain only
- the ABS ‘total’ turnover figures in the main results tables represent sales to both business and the public and are published excluding VAT, while those in the 'Retail Sales Inquiry' represent sales to the public only and are published including VAT
The ABS does publish ‘retail’ turnover figures (for sales to the public only) in its Retail Commodities tables in the June release which are inclusive of VAT and will be closer to 'Retail Sales Inquiry' figures, however
- the ABS ‘retail’ turnover figures includes data for National Health Service receipts and commissions whereas the 'Retail Sales Inquiry' do not
- Retail Sales Inquiry does not cover household spending on services bought from the retail sector as it is designed to only cover goods
- although both quote figures for a calendar year, the 'Retail Sales Inquiry' produce monthly output measures which include average weekly value and volume estimates. The value estimates reflect the average total turnover that businesses have collected over a standard reporting period, while the volume estimates are calculated by taking the value estimates and adjusting to remove the impact of price changes. ABS figures are based on annual responses from businesses covering a range of financial years
9. Construction industries, section F
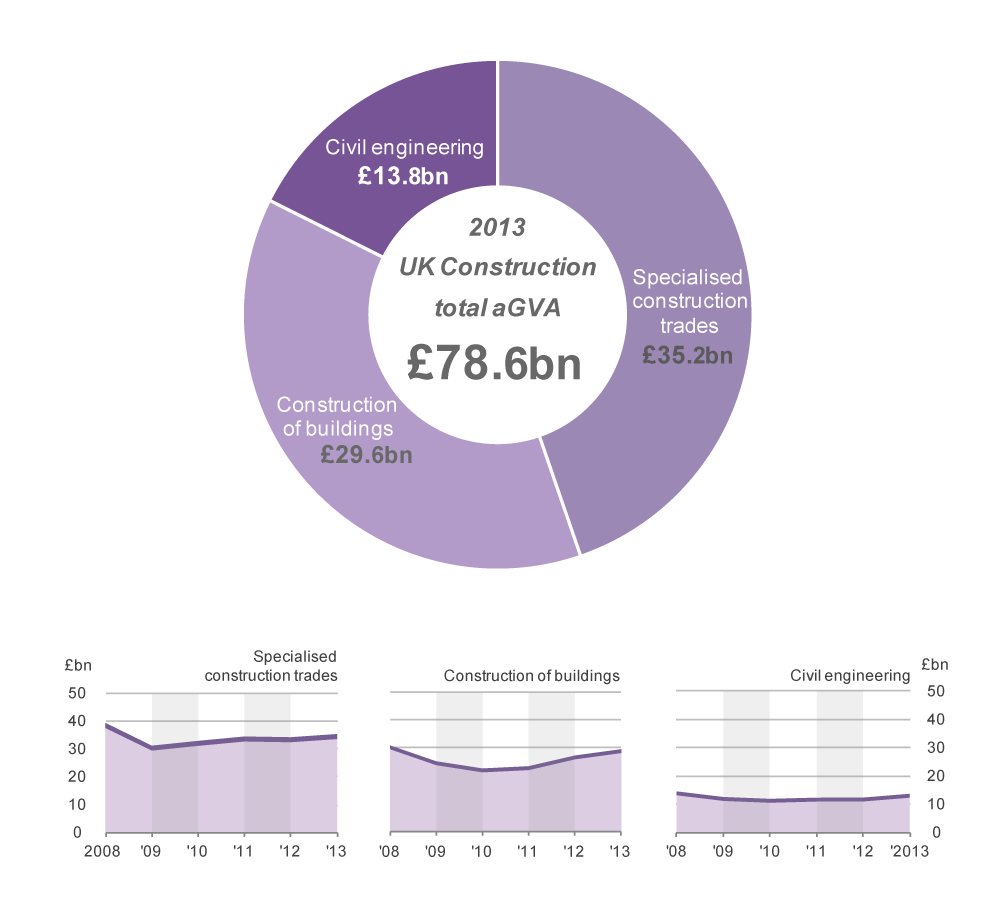
The Construction industries contributed £78.6 billion, 7.9% of the estimated aGVA total of £1,001.1 for the UK Non-Financial Business Economy in 2013.
Construction turnover increased by 4.5% (£8.6 billion) between 2012 and 2013 with purchases increasing by 3.7% (£4.3 billion) to give overall growth in aGVA of 6.5% (£4.8 billion). This is the third consecutive year of growth and, which leaves Construction aGVA £6.2 billion lower than the level in 2008, at the start of the recession (see Figure 19).
For details of revisions to 2012 and 2013 Construction data see the later chapter on Revisions.
Figure 19: Construction, turnover and purchases and resulting aGVA
2008 to 2013
Source: Office for National Statistics
Download this chart Figure 19: Construction, turnover and purchases and resulting aGVA
Image .csv .xlsAs in the previous year, the growth in Construction was mainly in Construction of buildings (Division 41), see Figures 20 and 21. However, the other two divisions which make up the Construction sector also contributed to the rise for 2013; aGVA in Civil engineering (Division 42) rose by 10.8% (£1.4 billion) and Specialised construction activities (Division 43) increased by 3.4% (£1.1 billion).
Figure 20: Construction, aGVA by section, 2008 to 2013
Source: Office for National Statistics
Construction of buildings (division 41)
Construction of buildings, contributed most to the growth in the Construction sector, with an increase in aGVA of 8.4% (£2.3 billion) between 2012 and 2013. This was a result of a 6.2% (£4.6 billion) increase in turnover and a 6.5% (£3.1 billion) increase in purchases, coupled with a rise in stock levels.
The aGVA growth between 2012 and 2013 for this division has fallen from the 19.1% (£4.9 billion) increase reported in the Provisional Results in November 2014, to 8.4% (£2.3 billion) in these Revised Results. This is due mainly to a number of quality improvements to the data, because of further survey responses and validation including some reclassifications.
As was the case in 2012, the main reason for the increase in aGVA was in Development of building projects (Group 41.1).
Figure 21: Construction, aGVA change by division
2008 to 2013
Source: Office for National Statistics
Download this chart Figure 21: Construction, aGVA change by division
Image .csv .xlsNotes for Construction industries, section F
Please note that the ABS figures for the Construction industries should not be compared directly with annual figures in the monthly ‘Output in the Construction Industry’ release because:
- the ABS figures cover the United Kingdom, while the 'Output in the Construction Industry' covers Great Britain only
- the two surveys measure different concepts of this industry
- while both quote figures for a calendar year, the ‘Output in the Construction Industry’ are based on the aggregate of the responses to 12 monthly surveys, whereas ABS figures are based on annual responses covering a range of business years
- the ABS figures will always be larger than those in the ‘Output in the Construction Industry’ because the latter excludes: Property developers (SIC 41.1); Payment on purchased services (architects, technical engineering, etc.); Payment to subcontractors, unless the subcontractors are not classified to construction and therefore are not part of the survey; Value of land; Value of materials sold (which are not part of a structure); and Fixtures, equipment and tools that are sold
- the ABS figures include secondary activities related to businesses classified within the construction sector, while the ‘Output in the Construction Industry’ covers only the construction activity of the businesses
10. Agriculture (part), forestry and fishing, section A
The ABS covers only hunting, forestry, fishing and the support activities to agriculture. Commentary is therefore limited because the sector’s size in terms of economic output, as measured by the ABS, is small in comparison to the other sectors of the UK Non-Financial Business Economy. However, data for these parts of Section A can be found in the reference tables linked to this bulletin.
Note that the values quoted below for Section A are in £ millions.
The part of Section A covered by ABS showed rises in turnover of 24.2% (£862 million) between 2012 and 2013 and in purchases of 16.5% (£389 million) which led to an increase of 32.4% (£454 million) in aGVA between 2012 and 2013. The main contributor to this increase was Silviculture and other forestry activities (Group 02.1) which covers the cultivation of trees for timber and pulp.
This rise means that, at £1,856 million, aGVA is now higher than the level in 2008, at the start of the recession.
Comparable GVA figures for the rest of Agriculture (which includes crop and animal production) are available in Chapter 3 (Table 3.2) of the 'Agriculture in the United Kingdom' release published annually by the Department for Environment, Food and Rural Affairs (DEFRA), and shows a value of £9,222 million for 2013.
Nôl i'r tabl cynnwys11. Revisions to 2012 and 2013 ABS data
Due to the need to balance timeliness of the data with the accuracy, in-line with the ABS Revisions Policy, ABS Provisional results are published in November with further quality assurance then leading to planned revisions to the data in subsequent releases.
These revisions usually arise from the receipt of additional data and the further validation and revision of existing data by businesses responding to the ABS, which may include restructures that can result in data being reallocated to a different industry.
When compared with the ABS Provisional results published on 13 November 2014, the revised 2013 results show minimal revision for the UK Non-Financial Business Economy. There were downward revisions to the 2013 estimates of 0.4% (£13.7 billion) in turnover, 0.2% (£4.3 billion) in purchases and 1.1% (£11.5 billion) in aGVA. The majority of the aGVA downward revisions were in Production and Non-financial services, which together accounted for 71% of the overall revision.
Estimates of aGVA in 2012 have been revised up by 0.1% (£0.7 billion), as a result of upward revisions in Construction, Production and Distribution, with a balancing downwards revision in Non-financial services.
Despite the revisions, the direction of movements of aGVA between 2012 and 2013 for the broad industry groups remains unchanged to that published in November 2013.
Figure 22: UK non-financial business economy, aGVA revisions
2013
Source: Office for National Statistics
Download this chart Figure 22: UK non-financial business economy, aGVA revisions
Image .csv .xlsIn the Production sector the final 2012 results show an upward revision to aGVA of £1.5 billion, while the revised 2013 results show a downward revision of £4.6 billion. These revisions were driven by Manufacturing (Section C) and Energy generation & supply (Section D).
The Non-Financial Service sector showed downward revisions to aGVA for the final 2012 and revised 2013 results of £2.8 billion and £3.5 billion respectively. These revisions were driven by downward revisions to Professional, scientific & technical activities (Section M) in 2012 and Information and Communication (Section J) in 2013.
In the Distribution sector the final 2012 results show an upward revision of £0.4 billion in aGVA, driven by an upward revision within Retail (excluding Motor Trades) (Division 47). The revised 2013 results show a downward revision in aGVA of £2.1 billion. These revisions were driven by a downward revision within Wholesale (excluding Motor Trades) (Division 46).
The Construction sector showed an upward revision to aGVA of £1.6 billion in the final 2012 results, while the revised 2013 results show a downward revision of £1.3 billion.
In the Agriculture (part), Forestry and Fishing sector showed downward revisions to aGVA for the final 2012 of £2 million and an upward revision to 2013 results of £52 million.
All of the above revisions were the result of different combinations of the receipt of additional data, the further validation and revision of existing data, and the restructuring of businesses responding to the ABS that can result in data being reallocated to a different industry. The magnitude of the revisions is in line with revisions made in previous years.
Nôl i'r tabl cynnwys12. European comparison
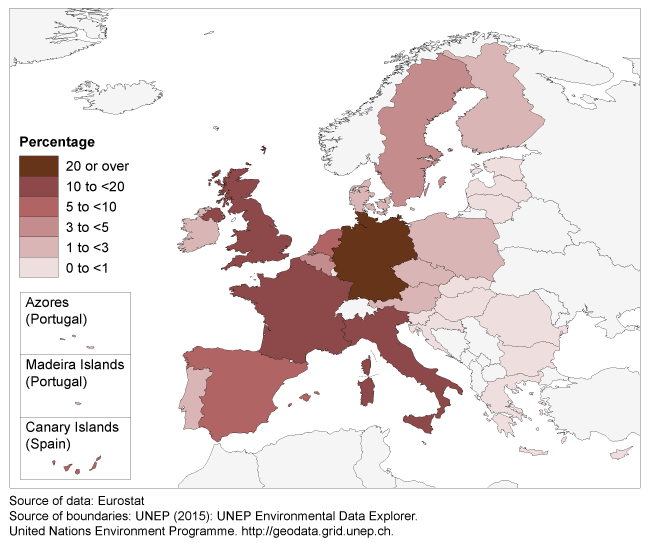
Map 1 shows the share of the total value of EU-28 aGVA in the business economy of each member state in 2012 (the latest figures available). The UK makes the second largest contribution with 16.8% of total EU aGVA. Germany accounts for 22.4% of EU aGVA. France and Italy are the only other member states that contribute more than 10% of EU business economy aGVA.
Map 1: Percentage share of the aGVA for the business economy in the EU-28, 2012
Notes:
- aGVA presented here is at factor costs, not at basic prices
- Industry coverage for the European comparisons is SIC Sections B–N, excluding Section K. This is the business economy excluding ‘Agriculture, Education, Human health and social work activities, Arts, entertainment and recreation, Other service activities’
- Data are included for all of the EU-28 countries. Croatia joined the European Union on 1 July 2013
- Data for Ireland have been estimated and data provided for Macedonia are provisional