Cynnwys
- Main points
- Overview
- User engagement
- Interactive Wheel for the UK Non-Financial Business Economy
- UK Non-Financial Business Economy, Sections A-S (part)
- Non-Financial Service Industries, Sections H-S (part)
- Production industries, Sections B-E
- Distribution industries, Section G
- Construction industries, Section F
- Agriculture (part), forestry and fishing, Section A
- Background notes
- Methodoleg
1. Main points
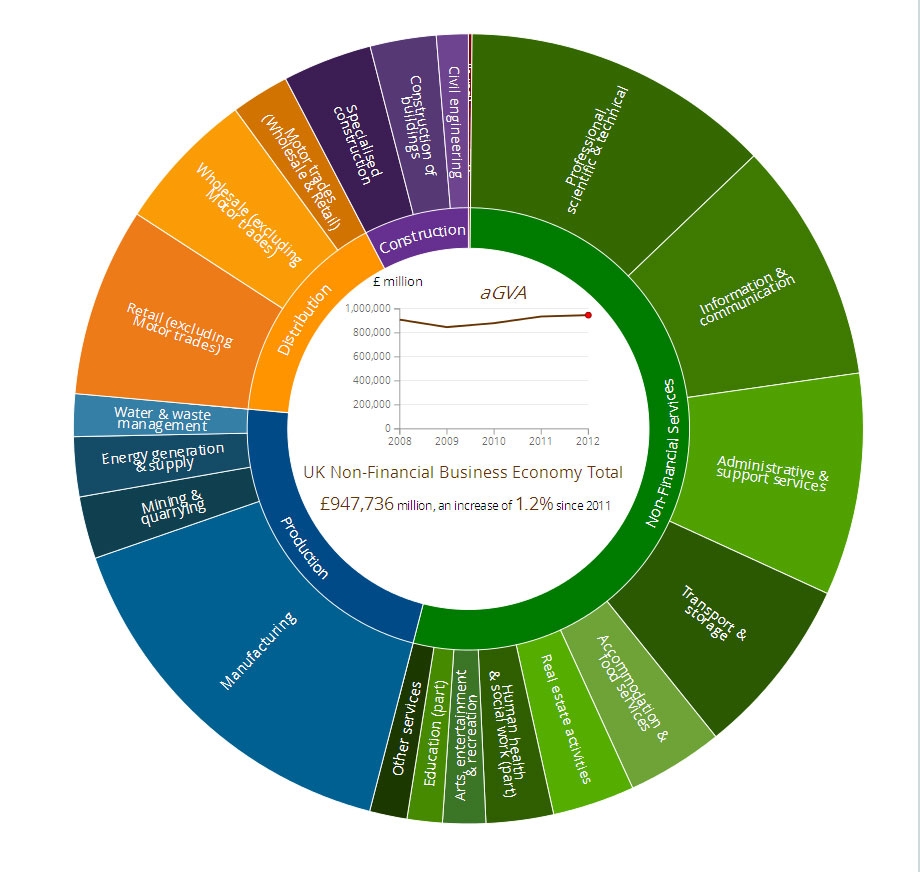
In 2012, the income generated by businesses in the UK, less the cost of goods and services used to create this income was estimated to be £947.7 billion. This amount represents the approximate Gross Value Added at basic prices (aGVA) of the UK Non-Financial Business Economy
Between 2011 and 2012, aGVA increased by 1.2% (£11.3 billion). This increase is a continuation of the recovery seen between 2009 and 2011 and takes aGVA to a level 4.2% (£38.1 billion) above that seen in 2008, at the start of the recession
The Non-Financial Service sector, which accounts for over half of aGVA in the UK Non-Financial Business Economy, contributed most to the increase in aGVA rising 6.4% (£30.5 billion) between 2011 and 2012. This is the third consecutive annual increase, taking it to £67.8 billion above the level seen in 2008
In Distribution and Production there was a fall in aGVA between 2011 and 2012, for the first time since 2009, due to purchase costs increasing at a higher rate than turnover
Data for the Insurance and Reinsurance industries have been removed from this release following discussions with key users. This experimental series was previously included in the results for reference years 2008 to 2011 and covered a small part of the Financial and insurance sector. It has been removed due to ongoing volatility while a more detailed quality assessment is undertaken. As such results in this release cover the UK Non-Financial Business Economy rather than the UK Business Economy. This does not affect other industries
2. Overview
This release provides an estimate of the size and growth of the UK Non-Financial Business Economy for 2012 as measured by the Annual Business Survey (ABS). It is the key resource for understanding the detailed structure, conduct and performance of businesses across the UK.
The release covers:
Non-Financial Services
Distribution
Production
Construction
Parts of Agriculture
Together these industries represent the UK Non-Financial Business Economy and account for around two thirds of the whole economy of the UK in terms of Gross Value Added. Public administration and defence, public sector health and education, finance and parts of agriculture make up the difference between the UK Non-Financial Business Economy and the whole economy.
The ABS has included estimates for the Insurance & Reinsurance industries (SIC 2007 Groups 65.1 and 65.2 respectively) in its UK National releases since 2008. This is the only part of Financial and Insurance Activities (Section K) covered by the survey. As with any new time-series, estimates for these industries have remained experimental while ongoing quality assurance has taken place. This quality assurance has led the figures to be revised substantially in recent years with a resulting break in the series between 2009 and 2010. Due to ongoing volatility the estimates for this series have been removed to allow for a more detailed quality assessment to be undertaken. The removal of these series does not affect other industries published as part of this release and has no impact on any other financial statistics published by ONS.
Estimates published in this release include turnover, purchases, approximate Gross Value Added at basic prices (aGVA) and employment costs. All data are reported at current prices (effect of price changes included).
Where the recession is mentioned it refers to the contraction of GDP that started in 2008, the year from which a consistent ABS time series is available from. For more information about the survey see the background notes.
The ABS has a wide range of uses: for example, ABS statistics are essential contributors to the UK National Accounts, including the measurement of Gross Domestic Product (GDP), they are supplied to Eurostat to meet the requirements of the European Structural Business Statistics (SBS) Regulation, and are used by the Devolved Administrations and central and local government to monitor and inform policy development. For other uses see background note 3.
One question often asked of the ABS release is ‘how does the measure of aGVA differ from the GVA measure in the National Accounts?’. The difference is that the ABS measure does not fully allow for some National Accounts concepts such as taxes, subsidies or income earned in kind and is therefore only approximate. Adjustments for these components are made in the calculation of GVA in the National Accounts, which also cover parts of the economy not included in ABS such as the public sector, financial services and parts of agriculture. For further information on aGVA see background note 8.
ONS makes every effort to provide informative commentary on the data in this release. Where possible, the commentary draws on evidence from businesses or other sources of information to help explain possible reasons behind the observed changes. However, in some places it can prove difficult to elicit detailed reasons for movements, for example, businesses may state a ‘change in the nature of business activity’. Consequently, it is not possible for all data movements to be fully explained.
Nôl i'r tabl cynnwys3. User engagement
We constantly aim to improve this release and its associated commentary. We would welcome any feedback you might have, and would be particularly interested in knowing how you make use of these data to inform your work. Please contact us via email: abs@ons.gov.uk or telephone Heather Bovill on +44 (0)1633 455107.
Nôl i'r tabl cynnwys4. Interactive Wheel for the UK Non-Financial Business Economy
Interactive wheel for the UK Non-Financial Business Economy
Use the Interactive Wheel to investigate which sectors contribute most to the UK Non-Financial Business Economy. Focus on the Business Economy as a whole or each sector and switch between aGVA, Turnover and Purchases.
5. UK Non-Financial Business Economy, Sections A-S (part)
In 2012, the income generated by businesses in the UK, less the cost of goods and services used to create this income was estimated to be £947.7 billion. This amount represents the approximate Gross Value Added at basic prices (aGVA) of the UK Non-Financial Business Economy. Between 2011 and 2012 aGVA increased by 1.2% (£11.3 billion); a continuation of the recovery seen between 2009 and 2011 although at a slower rate. This increase resulted in aGVA being above the level seen at the start of the recession, in 2008, for the second consecutive year.
The main drivers of aGVA are:
Turnover (the main component of income)
Purchases (the main component of the consumed goods and services)
The consecutive annual increases seen in aGVA are a result of similar consecutive increases in both turnover and purchases. Turnover increased by 3.1% (£101.9 billion) between 2011 and 2012, while purchases of goods, materials and services increased at a higher rate of 3.4% (£78.1 billion), resulting in aGVA growth that was lower than growth for turnover. As with aGVA, turnover and purchases were above levels seen at the start of the recession for the second consecutive year (see Figure 1).
The recession and recovery described by the ABS between 2008 and 2012 is broadly in line with Gross Domestic Product (GDP) figures published in the National Accounts. Both the ABS aGVA estimates and the National Accounts GDP estimates show a fall between 2008 and 2009 and then three consecutive annual increases from 2009 to 2012.
A list of industries which are included in the ABS measure of the UK Non-Financial Business Economy, can be found in background note 8.
Figure 1: UK Non-Financial Business Economy, details of income and expenditure and resulting aGVA, 2008-2012
Source: Office for National Statistics
Notes:
- A list of industries which are included in the ABS measure of the UK Non-Financial Business Economy, can be found in background note 8
Download this chart Figure 1: UK Non-Financial Business Economy, details of income and expenditure and resulting aGVA, 2008-2012
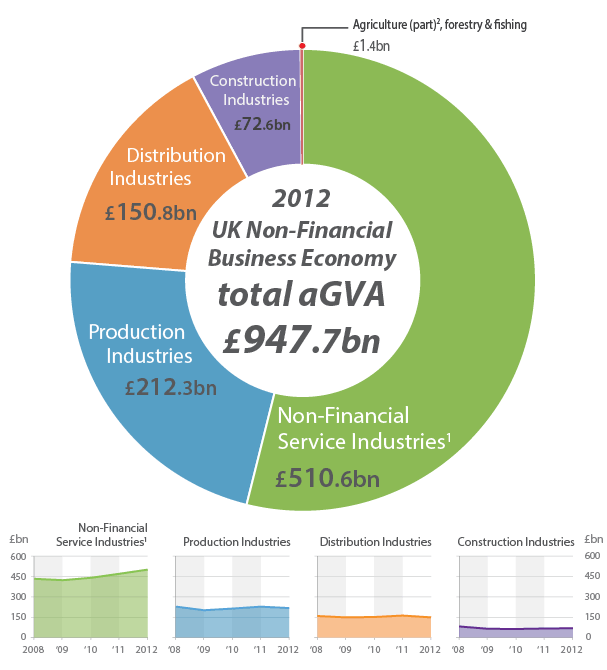
Image .csv .xlsBoth the Non-Financial Services and the Construction sectors saw increases in aGVA between 2011 and 2012, while aGVA in the Production, Distribution and Agriculture sectors experienced decreases.
Non-Financial Services, the largest industry sector of the UK Non-Financial Business Economy contributed most to the increase in aGVA. Non-Financial Service sector aGVA rose by 6.4% (£30.5 billion) between 2011 and 2012, the third consecutive annual increase, taking aGVA to £510.6 billion. The Non-Financial Service sector is the only sector where aGVA is above the level seen in 2008, at the start of the recession.
The Construction sector also experienced growth in aGVA between 2011 and 2012 for the second consecutive year, increasing by 2.8% (£2.0 billion), however, aGVA still remains below that seen in 2008.
The Distribution sector experienced a decrease in aGVA, following two consecutive annual increases, with a fall of 6.9% (£11.2 billion) between 2011 and 2012 taking it back below the level in 2008, at the start of the recession.
Production saw a decrease in aGVA for the first time in three years, falling by 4.4% (£9.8 billion) between 2011 and 2012. This fall has seen aGVA for the Production sector fall further below that in 2008, at the start of the recession.
The Agriculture (part), forestry and fishing sector experienced a fall in aGVA of 12.3% (£0.2 billion) between 2011 and 2012, and at £1.4 billion, aGVA for the industry also remains lower than the level in 2008.
Figure 2: UK Non-Financial Business Economy, details of aGVA by sector, 2008-2012
Source: Office for National Statistics
Notes:
- Excludes Financial and insurance; Public administration and defence; public provision of Education; public provision of Health and all medical and dental practice activities
- Agriculture (part: excluding crop and animal production), forestry & fishing data are excluded from the line charts as the values are negligible on a comparable scale
Figure 3: UK Non-Financial Business Economy, details of aGVA growth by sector, 2008-2012
Source: Office for National Statistics
Notes:
- A list of industries which are included in the ABS measure of the UK Non-Financial Business Economy, can be found in background note 8
Download this chart Figure 3: UK Non-Financial Business Economy, details of aGVA growth by sector, 2008-2012
Image .csv .xls6. Non-Financial Service Industries, Sections H-S (part)
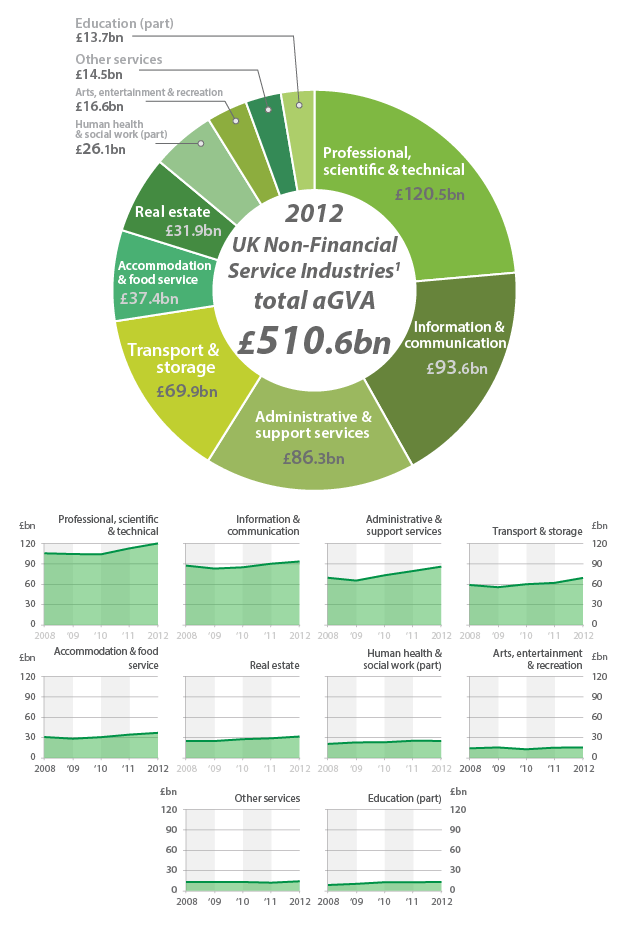
Just over half (53.9%) of the estimated aGVA total of £947.7 billion in 2012 for the UK Non-Financial Business Economy was generated by the Non-Financial Service industries.
Between 2011 and 2012 Non-Financial Service turnover increased at a higher rate than purchases, 5.8% (£58.5 billion) compared to 5.4% (£28.7 billion), resulting in aGVA rising by 6.4% (£30.5 billion).
This is the third consecutive year of growth in aGVA for the sector, following the fall between 2008 and 2009. Turnover, purchases and aGVA are now well above the level seen in 2008 at the start of the recession (see Figure 4).
Figure 4: Non-Financial Service Industries, details of income and expenditure and resulting aGVA, 2008-2012
Source: Office for National Statistics
Notes:
- A list of industries which are included in the ABS measure of the UK Non-Financial Business Economy, can be found in background note 8
Download this chart Figure 4: Non-Financial Service Industries, details of income and expenditure and resulting aGVA, 2008-2012
Image .csv .xlsAll of the industry sections within the Non-Financial Service sector saw increases in aGVA between 2011 and 2012 with the exception of Human health & social work activities (part of Section Q) which saw a small decrease (see Figures 5 and 6).
Those industries which have made the largest contributions to growth are Professional, scientific & technical activities (Section M), Transport & Storage (Section H), Administrative & support service activities (Section N) and Information & communication (Section J). Together these industries accounted for an increase in aGVA of £23.7 billion.
Figure 5: Non-Financial Service Industries, details of aGVA by section, 2008-2012
Source: Office for National Statistics
Notes:
- Excludes Financial and insurance; Public administration and defence; public provision of Education; public provision of Health and all medical and dental practice activities
Professional, scientific & technical activities (Section M)
Turnover in Professional, scientific & technical activities increased by 4.5% (£8.9 billion) between 2011 and 2012, with purchases showing an increase of only 2.5% (£2.2 billion). This resulted in growth of 6.3% (£7.1 billion) in aGVA, resulting in aGVA remaining above that reported for 2008 for the second consecutive year.
This broad section, which covers a range of industries from Legal & accounting activities to Advertising & market research and Veterinary activities, saw increases in aGVA in almost all its divisions between 2011 and 2012. Those making the largest impact on aGVA growth were Architectural & engineering activities & technical testing & analysis (Division 71) and Advertising & market research (Division 73).Both divisions showed increases in turnover coupled with either a decrease or a smaller increase in purchases.
Transport & storage (Section H)
Turnover in Transport & storage increased by 8.0% (£11.3 billion) between 2011 and 2012, with purchases only rising by 5.8% (£4.7 billion) resulting in an 11.2% (£7.0 billion) increase in aGVA.
The main industries driving growth within Transport & storage were Warehousing & support activities for transportation (Division 52), Land transport & transport via pipelines (Division 49) and Postal & courier activities (Division 53). Increases in this sector may be related to the effect of the internet economy. Data on the retail sector indicates that turnover from mail order and via the internet continued to increase at a higher rate than turnover from shops. Increases seen in Warehousing & support activities for transportation and Postal & courier activities are likely to partly result from the delivery and storage of items ordered from the internet.
Administrative & support services (Section N)
Between 2011 and 2012 Administrative & support activities saw turnover rise by 5.9% (£9.7 billion), while purchases increased by 4.0% (£3.5 billion) leading to an aGVA increase of 7.9% (£6.3 billion).
The main industries driving growth within Administrative & support activities were Employment activities (Division 78) where aGVA increased by 14.7% (£3.3 billion). The growth has been driven by Temporary employment agency activities (Group 78.2) which may be a result of businesses being more likely to recruit temporary rather than permanent staff as a result of continued economic uncertainty. Rental & Leasing Activities (Division 77) and Office Administration, office support & other business support activities (Division 82) also made substantial contributions to the increase in aGVA.
Information & communication (Section J)
Information & communication experienced a 0.6% (£1.1 billion) rise in turnover, which, coupled with a 1.7% (£1.7 billion) fall in purchases, resulted in growth in aGVA of 3.5% (£3.2 billion) between 2011 and 2012.
The majority of industries within Section J showed an increase in aGVA between 2011 and 2012, with the biggest driver of growth coming from Computer programming, consultancy & related activities (Division 62) with 5.7% (£2.2 billion). Some businesses in this sector reported that they were undergoing cost cutting measures to try to make themselves more profitable under the current market conditions.
Finance & insurance (Section K)
The ABS has included estimates for the Insurance & Reinsurance industries (SIC 2007 Groups 65.1 and 65.2 respectively) in its UK National releases since 2008. This is the only part of Financial and Insurance Activities (Section K) covered by the survey. As with any new time-series, estimates for these industries have remained experimental while ongoing quality assurance has taken place. This quality assurance has led the figures to be revised substantially in recent years with a resulting break in the series between 2009 and 2010. Due to ongoing volatility the estimates for this series have been removed to allow for a more detailed quality assessment to be undertaken. The removal of these series does not affect other industries published as part of this release and has no impact on any other financial statistics published by the ONS.
Figure 6: Non-Financial Service Industries, details of aGVA growth by section, 2008-2012
Source: Office for National Statistics
Notes:
- H Transport and storage
- I Accommodation and food service activities
- J Information and communication
- L Real estate activities
- M Professional, scientific and technical activities
- N Administrative and support service activities
- P (Part) Education
- Q (Part) Human health and social work activities
- R Arts, entertainment and recreation
- S Other service activities
- A list of industries which are included in the ABS measure of the UK Non-Financial Business Economy, can be found in background note 8
Download this chart Figure 6: Non-Financial Service Industries, details of aGVA growth by section, 2008-2012
Image .csv .xls7. Production industries, Sections B-E
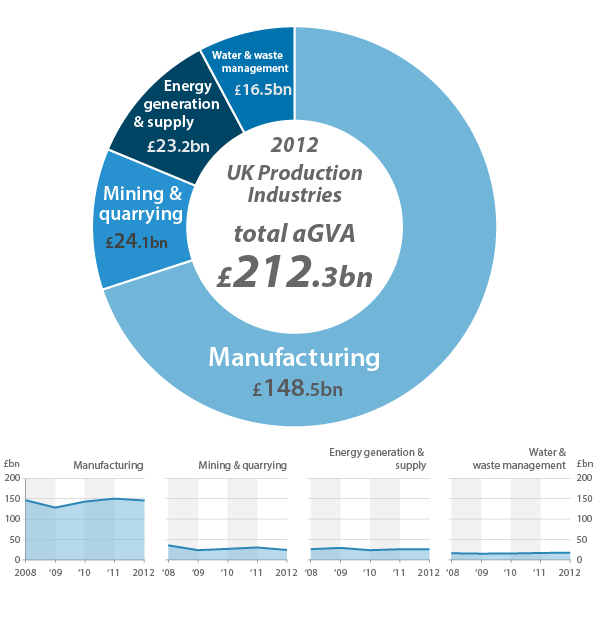
The Production sector in 2012 provided just under a quarter (22.4%) of the estimated aGVA total of £947.7 billion for the UK Non-Financial Business Economy.
Turnover increased by 1.0% (£7.1 billion) over the period, but unlike the Non-Financial Service sector, purchases in the Production sector increased at a higher rate (2.2%, £10.0 billion) leading to a decrease in aGVA of 4.4% (£9.8 billion). This fall in aGVA follows two consecutive annual increases and sees aGVA drop further below the level seen in 2008 before the recession (see Figure 7).
Figure 7: Production industries, details of income and expenditure and resulting aGVA, 2008-2012
Source: Office for National Statistics
Download this chart Figure 7: Production industries, details of income and expenditure and resulting aGVA, 2008-2012
Image .csv .xlsAll sections within Production saw falls in aGVA between 2011 and 2012 with the exception of Water & waste management (Section E), which saw an increase of 3.7% (£0.6 billion) in aGVA.
The decrease in aGVA within Production was jointly driven by Mining and quarrying, with a fall of 18.3% (£5.4 billion) and Manufacturing with a decrease of 3.1% (£4.7 billion) (see Figures 8 and 9).
Figure 8: Production industries, details of aGVA by section, 2008-2012
Source: Office for National Statistics
Mining & quarrying (Section B, which includes oil and gas extraction)
Turnover in Mining & quarrying decreased by 9.6% (£5.3 billion) while purchases increased by 1.6% (£0.4 billion) resulting in an 18.3% (£5.4 billion) decrease in aGVA. This decrease was almost entirely driven by Extraction of crude petroleum and natural gas (Division 06) which saw a 23.2% (£5.9 billion) decrease in aGVA which may be a result of prolonged periods of maintenance to offshore oil rigs.
Manufacturing (Section C)
For Manufacturing there were increases of 1.1% (£5.7 billion) in turnover and 1.0% (£3.3 billion) in purchases. Despite turnover increasing at a higher rate than purchases aGVA decreased by 3.1% (£4.7 billion) largely as a result of decreases in stock levels and increases in taxes.
The picture within Manufacturing was mixed: while the majority of divisions saw decreases in aGVA between 2011 and 2012, around a third of the twenty four divisions experienced increases.
Across the Production sector many divisions have been affected by a trend among multinational companies towards restructuring on an international basis. Such restructuring has caused companies to be classified under different sectors to those they have historically occupied, with movements from traditional production industries towards wholesalers and toll processors.
The decrease in manufacturing aGVA was driven primarily by Manufacture of basic pharmaceutical products & pharmaceutical preparations (Division 21), Manufacture of basic metals (Division 24) and Manufacture of chemicals & chemical products (Division 20). Together these three divisions account for a decrease of £3.7 billion.
The £2.0 billion decrease in aGVA for Manufacture of basic pharmaceutical products and pharmaceutical preparations (Division 21) can be attributed to a reduction in turnover alongside an increase in purchases, cited by some businesses as a result of decreased exclusivity of some previously patented products.
Of the divisions showing growth between 2011 and 2012 the largest growth was in the Manufacture of fabricated metal products, except machinery & equipment (Division 25) which showed a rise in aGVA of 8.5% (£1.1 billion).
Energy generation & supply (Section D)
Electricity generation & supply saw purchases increase at a higher rate than turnover between 2011 and 2012 (8.3% (£6.4 billion) and 6.6% (£6.6 billion respectively), resulting in aGVA decreasing by 1.3% (£0.3 billion). Rises in turnover and purchases are thought to be influenced by increased price of raw materials influenced by international events such as the closing of Japan’s nuclear program and Middle East unrest.
Figure 9: Production industries, details of aGVA growth by section, 2008-2012
Source: Office for National Statistics
Download this chart Figure 9: Production industries, details of aGVA growth by section, 2008-2012
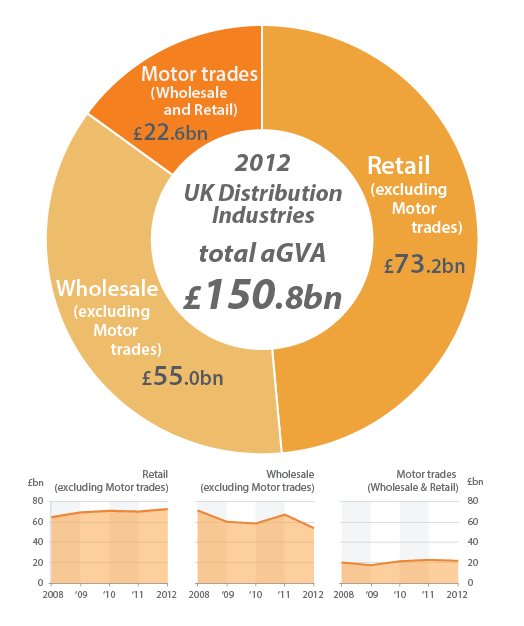
Image .csv .xls8. Distribution industries, Section G
The Distribution industries in 2012 provided 15.9% of the estimated aGVA total of £947.7 billion for the UK Non-Financial Business Economy.
This sector saw a 2.6% (£34.9 billion) rise in turnover and a larger 3.5% (£40.7 billion) increase in purchases between 2011 and 2012. This contributed to the decrease in aGVA of 6.9% (£11.2 billion). This fall follows two consecutive years of growth and takes Distribution aGVA to a level lower than in 2008 at the start of the recession (see Figure 10).
Figure 10: Distribution industries, details of income and expenditure and resulting aGVA, 2008-2012
Source: Office for National Statistics
Download this chart Figure 10: Distribution industries, details of income and expenditure and resulting aGVA, 2008-2012
Image .csv .xlsPerformance within Distribution was mixed (see Figures 11 and 12), with the decrease in aGVA between 2011 and 2012 driven by Wholesale (excluding Motor trades).
Figure 11: Distribution industries, details of aGVA by division, 2008-2012
Source: Office for National Statistics
Wholesale (excluding Motor trades) (Division 46)
Wholesale experienced an increase in turnover of 2.5% (£21.3 billion) and purchases of 3.8% (£29.4 billion) between 2011 and 2012. However, aGVA saw a large decrease of 18.9% (£12.8 billion), although the change without industry restructures and reclassification changes would be less pronounced.
The fall between 2011 and 2012 was driven by changes to Other specialised wholesale (Group 46.7). Performance for this industry group is volatile as it is heavily influenced by changes in oil prices. The high oil prices seen in 2011 have continued into 2012 and wholesalers may have been reluctant to pass the higher prices onto their customers.
Motor trades (Wholesale and Retail) (Division 45)
Motor trades also contributed to the fall in aGVA in Distribution between 2011 and 2012, with a decrease of 3.8% (£0.9 billion), as purchases increased at a higher rate than turnover, 5.3% (£6.2 billion) and 4.4% (£6.0 billion) respectively. This fall follows two consecutive annual increases.
Within Motor trades, Maintenance & repair of motor vehicles (Group 45.2) contributed most to the fall in aGVA between 2011 and 2012, decreasing by 7.4% (£0.5 billion). This is perhaps a result of consumers putting off car repairs in response to the uncertain economic climate and falling real incomes.
The last few years have seen noticeable changes in the drivers within this division between sales of new vehicles and maintenance of old vehicles. For example, the Sale of motor vehicles (Group 45.1) saw strong growth between 2009 and 2010, followed by a small fall in aGVA between 2010 and 2011 suggesting that consumers could have brought forward purchases of new cars to take advantage of the Government car scrappage scheme (which ran from May 2009 to April 2010). The group experienced slight growth in aGVA between 2011 and 2012, which may show the start of increasing demand for new cars, which would align with the increase in car registrations seen between 2011 and 2012.
On the other hand Maintenance and repair of motor vehicles (Group 45.2) saw very little growth between 2009 and 2010, followed by much stronger growth between 2010 and 2011 when the scrappage scheme had ended. Between 2011 and 2012 aGVA in this group has fallen.
Retail (excluding Motor trades) (Division 47)
In contrast, aGVA in Retail saw an increase of 3.5% (£2.5 billion) between 2011 and 2012. This growth in aGVA was a result of a 2.2% (£7.6 billion) increase in turnover and a smaller 1.9% (£5.1 billion) increase in purchases.
The increases in turnover and purchases were driven by Retail sale of other goods in specialised stores (Group 47.7) and Retail sale in non-specialised stores (Group 47.1) which includes superstores and department stores. Perhaps unsurprisingly, reports from businesses indicate that turnover from mail orders and via the internet increased at a higher rate than turnover from shops. Although increasing, retail sales from mail order and the internet remain a small share of total turnover.
Figure 12: Distribution Industries, details of aGVA growth by division, 2008-2012
Source: Office for National Statistics
Download this chart Figure 12: Distribution Industries, details of aGVA growth by division, 2008-2012
Image .csv .xlsNotes for distribution industries, Section G
Please note that the ABS figures for the Retail industry should not be compared directly with the annual ‘value non seasonally adjusted’ figures in the monthly 'Retail Sales Inquiry' release because
- the ABS figures cover the United Kingdom, while the 'Retail Sales Inquiry' covers Great Britain only
- the ABS ‘total’ turnover figures in the main results tables represent sales to both business and the public and are published excluding VAT, while those in the 'Retail Sales Inquiry' represent sales to the public only and are published including VAT
The ABS does publish ‘retail’ turnover figures (for sales to the public only) in its Retail Commodities tables which are inclusive of VAT and will be closer to 'Retail Sales Inquiry' figures, however;
- the ABS ‘retail’ turnover figures includes data for National Health Service receipts and commissions whereas the 'Retail Sales Inquiry' do not
- Retail Sales Inquiry does not cover household spending on services bought from the retail sector as it is designed to only cover goods
- although both quote figures for a calendar year, the 'Retail Sales Inquiry' produce monthly output measures which include average weekly value and volume estimates. The value estimates reflect the average total turnover that businesses have collected over a standard reporting period, while the volume estimates are calculated by taking the value estimates and adjusting to remove the impact of price changes. ABS figures are based on annual responses from businesses covering a range of financial years
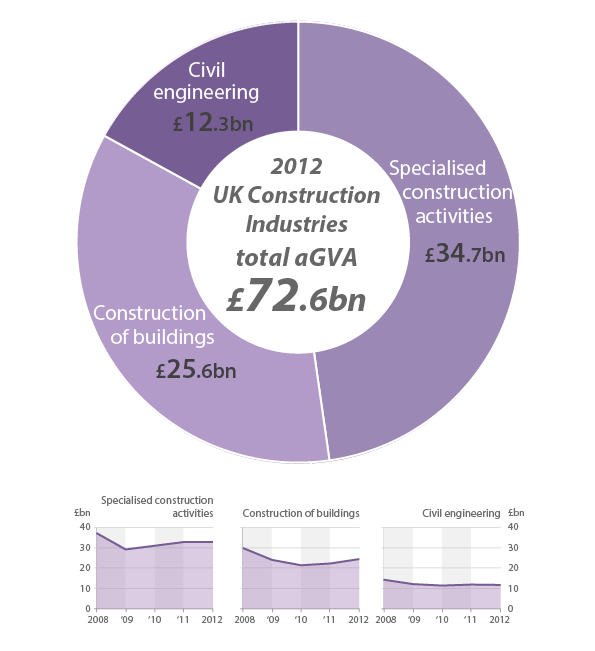
9. Construction industries, Section F
Construction turnover increased by 0.7% (£1.3 billion) in 2012 with purchases decreasing by 1.4% (£1.6 billion) to give overall growth in aGVA of 2.8% (£2.0 billion). This is the second consecutive year of growth, but still leaves Construction aGVA £12.2 billion lower than the level in 2008 before the recession (see Figure 13).
Figure 13: Construction industries, details of income and expenditure and resulting aGVA, 2008-2012
Source: Office for National Statistics
Download this chart Figure 13: Construction industries, details of income and expenditure and resulting aGVA, 2008-2012
Image .csv .xlsOnly one division within Construction, Construction of buildings (Division 41), saw increases in aGVA between 2011 and 2012, while the other two divisions saw small falls.
Only one division within Construction, Construction of buildings (Division 41), saw increases in aGVA between 2011 and 2012, while the other two divisions saw small falls.
Figure 14: Construction industries, details of aGVA by division, 2008-2012
Source: Office for National Statistics
Construction of buildings (Division 41)
Construction of buildings experienced an increase in aGVA of 9.1% (£2.1 billion) between 2011 and 2012 as a result of a 3.5% (£2.5 billion) increase in turnover and a 1.1% (£0.5 billion) fall in purchases. The main driver of the change was an increase in Development of building projects (Group 41.1).
Figure 15: Construction industries, details of aGVA growth by division, 2008-2012
Source: Office for National Statistics
Download this chart Figure 15: Construction industries, details of aGVA growth by division, 2008-2012
Image .csv .xlsNotes for construction industries, Section F
Please note that the ABS figures for the Construction industries should not be compared directly with annual figures in the monthly ‘Output in the Construction Industry’ release because:
- the ABS figures cover the United Kingdom, while the 'Output in the Construction Industry' covers Great Britain only
- the two surveys measure different concepts of this industry
- while both quote figures for a calendar year, the ‘Output in the Construction Industry’ are based on the aggregate of the responses to 12 monthly surveys, whereas ABS figures are based on annual responses covering a range of business years
- the ABS figures will always be larger than those in the ‘Output in the Construction Industry’ because the latter excludes: Property developers (SIC 41.1); Payment on purchased services (architects, technical engineering, etc.); Payment to subcontractors, unless the subcontractors are not classified to construction and therefore are not part of the survey; Value of land; Value of materials sold (which are not part of a structure); and Fixtures, equipment and tools that are sold
10. Agriculture (part), forestry and fishing, Section A
The ABS covers only hunting, forestry, fishing and the support activities to agriculture. Commentary is therefore limited because its size in terms of economic output, as measured by the ABS, is small in comparison to the other sections of the UK Business Economy. However, data for these parts of Section A can be found in the reference tables linked to this bulletin.
The other parts of agriculture, which include crop and animal production, are covered by the Department for Environment, Food and Rural Affairs (DEFRA).
The part of Section A covered by ABS showed rises in turnover of 2.9% (£0.1 billion) between 2011 and 2012 and purchases of 18.1% (£0.4 billion) which led to a decrease of 12.3% (£0.2 billion) in aGVA between 2011 and 2012. This fall means that, at £1.4 billion, aGVA still remains lower than the level in 2008, at the start of the recession.
Validation of data returns for 2011 highlighted a small number of businesses within agriculture (Division 01) which needed to be reclassified resulting in revisions to the 2010 and 2011 figures. In line with the ABS revisions policy previous years (2008 and 2009) have not been revised and users should therefore take caution when comparing figures overtime.
Nôl i'r tabl cynnwys