1. Main points
Purchasing patterns of UK businesses have remained consistent in 2017 in comparison with 2016 across all industry groups.
Production was the least diverse industry group with 76.6% of its total intermediate consumption being spent on production-related products.
Other services was the most diverse industry group with 27.5% of its total intermediate consumption being spent on other services-related products.
Annual Purchases Survey data show businesses within the distribution, transport, hotels and restaurants industry group purchased the most energy in relation to their total intermediate consumption (16.4%).
The top 15 products purchased by businesses across all industries remained consistent in 2017 in comparison with 2016 and equate to almost half (46.7%) of all products purchased.
2. Things you need to know about this release
Survey background
The primary aim of the Annual Purchases Survey (APS) is to provide a comprehensive picture of the products (energy, goods and services) purchased in the production process and running of UK businesses, otherwise referred to as intermediate consumption.
This level of detail is required to feed into the supply and use tables (SUTs) and ultimately the compilation of gross domestic product (GDP). The APS will help the Office for National Statistics (ONS) adhere to international best practice outlined in the European System of Accounts 2010: ESA 2010 and Balance of Payments Manual: BPM6.
The APS collects information on businesses' intermediate consumption, a national accounts concept defined within the ESA 2010 manual as:
“Intermediate consumption consists of goods and services consumed as inputs by a process of production, excluding fixed assets whose consumption is recorded as consumption of fixed capital. The goods and services are either transformed or used up by the production process.”
The APS covers a large part of the economy with some exceptions such as public administration and certain elements of financial industries. The exact inclusions or exclusions of industries are detailed in the Quality and Methodology Information report. It is also worth noting that the 2017 APS estimates are based on Standard Industrial Classification 2007: SIC 2007.
Link to supply and use tables
From Blue Book 2019 onwards, the APS will be the primary source for the breakdown of products purchased within industries. Additional sources will feed into this, including the use of the Annual Business Survey for the industry totals, as is currently the procedure.
Methodological features
At present, the estimates produced from the APS are still regarded as experimental. This will be the case until a formal assessment with the UK Statistics Authority ensures compliance with the Code of Practice for Statistics. Alongside this release, detailed quality, methodological and technical information is now available from the Annual Purchases Survey Quality and Methodology Information report and the Annual Purchases Survey Technical Report.
The product values published are constrained to Annual Business Survey data where equivalent industries are available. Revisions have been made to the 2015 and 2016 data, therefore differences in proportions can be seen when comparing with previous releases.
We are keen to hear your views and would welcome your feedback on the contents of this report. If you have any comments, please email purchases.survey@ons.gov.uk.
Nôl i'r tabl cynnwys3. What is the overall picture of businesses’ purchasing patterns in 2017?
A breakdown of energy, goods and services
Businesses within the distribution, transport, hotels and restaurants industry group purchased the most energy products, including water and waste services (16.4% of their total intermediate consumption), followed by businesses within the production industry group (16.1%) and the agriculture industry group (11.0%).
Businesses within the finance and insurance industry group purchased the most services products (96.6% of their total intermediate consumption), while businesses within the production industry group purchased the least (23.3%).
For goods products, businesses within the production industry group purchased the most (60.7% of their total intermediate consumption) and businesses within the finance and insurance industry group purchased the least (2.1%).
Figure 1 shows industry groups’ total intermediate consumption split between purchases on energy, goods and services.
Figure 1: Most industry groups spend the highest proportion of their total intermediate consumption on services
Industry groups' total intermediate consumption split between purchases on energy, goods and services, as proportions (%)
UK, 2017
Source: Office for National Statistics – Annual Purchases Survey
Download this chart Figure 1: Most industry groups spend the highest proportion of their total intermediate consumption on services
Image .csv .xlsSome examples of the most purchased energy products include:
waste collection services, waste treatment and disposal services and material recovery services; the professional and support activities industry group spent £0.7 billion on this product
coke oven products, diesel, petrol, gas oils, lubricating petroleum oils, liquified petroleum gas, other refined petroleum products and other fuel oils; the construction industry group spent £3.6 billion on this product
electricity; the information and communication industry group spent £2.1 billion on this product
Some examples of the most purchased services products include:
support services to financial and insurance activities; the finance and insurance industry group spent £2.4 billion on this product
warehousing and transportation support services; the distribution, transport, hotels and restaurants industry group spent £13.9 billion on this product
building and landscape services; the real estate industry group spent £1.7 billion on this product
Some examples of the most purchased goods products include:
forestry, logging and related products and services; the agriculture industry group spent £0.5 billion on this product
pharmaceutical products and preparations; the government, health and education industry group spent £1.0 billion on this product
motor vehicles, trailers and semi-trailers; the production industry group spent £22.9 billion on this product
Further investigation suggests that businesses predominantly purchase products relating to their own industry group. For example, construction businesses’ largest purchases are for construction-related products.
Spread of intermediate consumption
Figure 2 shows the proportion of total intermediate consumption spent on products within each industry group, at a 10 industry by 10 industry product groupings breakdown (the A10 matrix table, which can be downloaded from the accompanying supplementary datasets). Within Figure 2, darker colours represent higher percentages.
Figure 2: Most industry groups spend a higher proportion of their intermediate consumption on production, and professional and support activities
The proportion of total intermediate consumption (%) spent on products within each industry group
UK, 2017
Embed code
The production industry group purchased the largest proportion of production-related products, spending 76.6% of their total intermediate consumption on these products. This was followed by the agriculture industry group and the distribution, transport, hotels and restaurants industry group, who spent 43.8% and 41.0% of their total intermediate consumption on production-related products respectively.
Additionally, the largest proportion of intermediate consumption for 5 out of the 10 industry groups was spent on products relating to professional and support activities. This was due predominantly to three specific products within this category:
advertising and market research
head office and management consulting services
accounting, bookkeeping and auditing services
Considering professional and support activities-related products was the largest intermediate consumption spend for five industry groups, the industry group that bought the most of these products was the professional and support activities industry group itself. The same can be said about production-related products, where the largest proportion of intermediate consumption spent on these products was within the production industry group itself. Further analysis is conducted in Section 4.
Nôl i'r tabl cynnwys4. Intermediate consumption patterns for 2017
Purchases within and outside industry groups
Figure 3 summarises the spread of intermediate consumption, showing how businesses within a given industry purchase products within their own industry group (for example, a production business, such as one manufacturing basic metals, purchasing production-related products).
Figure 3: The percentage of purchases within the same industry group is consistent year-on-year
Summary of the spread of intermediate consumption, as proportions (%), showing how businesses within a given industry purchases products within their own industry group
UK, 2016 to 2017
Source: Office for National Statistics – Annual Purchases Survey
Notes:
- Within an industry group means businesses are purchasing products mapped to this group based on both the Standard Industrial Classification 2007: SIC 2007 and Statistical Classification of Products by Activity (CPA) version 2.1.
- Outside of an industry group means businesses are purchasing products not directly mapped to their industry group.
Download this chart Figure 3: The percentage of purchases within the same industry group is consistent year-on-year
Image .csv .xlsFigure 3 shows that the spread of intermediate consumption has remained relatively consistent between 2016 and 2017.
Production was the least diverse industry group in terms of its purchasing patterns, as 76.6% of its total intermediate consumption was spent purchasing products from production itself.
Finance and insurance showed the highest increase in the percentage spent on products relating to its own industry group, moving from 18.2% of total intermediate consumption in 2016 to 20.5% in 2017. This suggests that the diversity of products purchased by businesses within the finance and insurance industry group has decreased.
Real estate showed the largest decrease in the percentage spent on products relating to its own industry group, moving from 22.2% of total intermediate consumption in 2016 to 21.0% in 2017. This suggests that the diversity of products purchased by businesses within the real estate industry group has increased.
Other services remained the most diverse industry group in terms of its purchasing patterns, as 92.5% of its intermediate consumption was spent purchasing products from outside its industry group.
On- and off-diagonal intermediate consumption patterns
As previously mentioned in Section 2, the Annual Purchases Survey (APS) collects and can produce estimates at a much more granular level than is available from other Office for National Statistics (ONS) business surveys.
On-diagonal intermediate consumption means businesses are purchasing a product mapped directly to their industry based on both the Standard Industrial Classification 2007: SIC 2007 and Statistical Classification of Products by Activity (CPA) version 2.1. Off-diagonal intermediate consumption means businesses are purchasing products not mapped directly to their industry.
An example of on-diagonal intermediate consumption would be a business in car manufacturing (industry 29) purchasing a car manufacturing-related product (CPA 29); both specifically refer to car manufacturing (SIC and CPA 29).
An example of off-diagonal intermediate consumption, in this context, would be a business within car manufacturing (industry 29) purchasing a product within paints and varnishes (CPA 20.3). Although both industry and product are within production, they are not the same industry.
Using the 109 industry by 107 industry product groupings breakdown (the A110 matrix table, which can be downloaded from the accompanying supplementary datasets), on- and off-diagonal intermediate consumption can be identified.
Figure 4 provides a visual representation to demonstrate the concept of on- and off-diagonal intermediate consumption.
Figure 4: Example matrix demonstrating on-diagonal and off-diagonal purchases
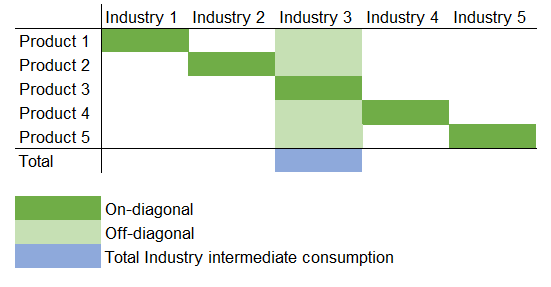
Source: Office for National Statistics
Notes:
- Due to the size of the table it is not possible to show it in its entirety within this release, but it can be found in the accompanying supplementary datasets (A110 matrix table).
Download this image Figure 4: Example matrix demonstrating on-diagonal and off-diagonal purchases
.png (12.1 kB)
Using these definitions, Figure 5 summarises the proportion of purchases as on- or off-diagonal products within each industry group.
Figure 5: UK businesses purchase more off-diagonal products than on-diagonal
Summary of the proportion of purchases (%) as on- or off-diagonal products within each industry group
UK, 2017
Source: Office for National Statistics – Annual Purchases Survey
Notes:
This excludes industry groups wholesale, retail and pension funding for the following reasons:
wholesale and retail: you cannot buy the wholesale or retail product – since that is going to be an intangible mark-up on products sold by wholesalers or retailers
pension funding: pensions are not a cost of production – they are an employer’s social contribution – so spending on pensions is not a purchase; it is part of compensation of employees, which is not included in intermediate consumption
Download this chart Figure 5: UK businesses purchase more off-diagonal products than on-diagonal
Image .csv .xlsOverall, businesses purchased more off-diagonal products (those not directly related to their industry classification), accounting for 78.6% of total intermediate consumption in 2017.
The construction industry had the highest percentage of on-diagonal intermediate consumption (31.5% of total intermediate consumption), while the other services industry had the lowest (5.8%).
At high-level industry groupings (Figure 3), businesses within the production industry group appear to be predominantly purchasing production-related products (76.6% of total intermediate consumption). However, Figure 5 shows that this does not map to the more detailed level. At this more detailed industry and product level, businesses within the production industry are purchasing a smaller proportion of products directly related to their own industry classification (27.5% of total intermediate consumption).
For example, car manufacturing businesses (SIC 29) spend 87.0% of their total intermediate consumption on production-related products. However, only 44.5% of their total intermediate consumption is spent on products relating directly to car manufacturing (CPA 29), with the remaining percentage being spent on other non car manufacturing-related products, such as rubber, plastic and basic metals.
Nôl i'r tabl cynnwys5. Most purchased products year-on-year comparison
Figure 6 shows the top 15 products purchased by businesses across all industries as proportions of total intermediate consumption, comparing 2016 and 2017.
Figure 6: The top 15 products have remained the same year-on-year, with only their positions changing
The top 15 products purchased by businesses across all industries as proportions of total intermediate consumption (%), comparing 2016 and 2017
UK, 2016 and 2017
Embed code
The total spent on the top 15 products across all industries equates to almost a half (46.7%) of all products purchased.
The top 15 products have remained consistent between 2016 and 2017, with only their relative positions changing.
In 2017, products relating to the construction of buildings accounted for the highest proportion of all purchased products (4.8% of total intermediate consumption, £56.9 billion), moving up from position 2 in 2016 to position 1 in 2017.
The industries that purchased the most of these products were the construction of buildings, civil engineering, and specialised construction industries. These industries accounted for 79.3% of all the products relating to the construction of buildings that were purchased.
The second-highest proportion of all purchased products in 2017 was accounted for by products relating to the buying and selling, renting and operating of own or leased real estate (4.7% of total intermediate consumption, £55.0 billion), moving down from position 1 in 2016 to position 2 in 2017.
Unlike products relating to the construction of buildings, the industries purchasing most of the products relating to the buying and selling, renting and operating of own or leased real estate were from a non-related industry group. These industries were:
retail trade, except of motor vehicles and motorcycles
food and beverage service activities
wholesale trade, except of motor vehicles and motorcycles.
This is probably related to businesses, shops and restaurants renting space and buildings.
Beyond the top 15 most purchased products, there were three significant moves in position:
postal and courier services moved down from position 27 to position 36, decreasing by 0.2 percentage points (£1.0 billion)
real estate services on a fee or contract basis moved down from position 77 to position 86, decreasing by 0.1 percentage points (£0.4 billion)
office administration, office support and other business support services increased rank from position 38 to position 29, increasing by 0.1 percentage points (£2.7 billion)
6. Quality and methodology
Detailed quality and methodology information is available from the Annual Purchases Survey Quality and Methodology Information report, which contains important information on:
the strengths and limitations of the data and how it compares with related data
uses and users of the data
how the output was created
the quality of the output including the accuracy of the data
You will also find detailed information on the methods used in the calculation of the APS in the Annual Purchases Survey Technical Report.
Nôl i'r tabl cynnwys