Cynnwys
- Other pages in this release
- Main points
- Weighted data
- Current trading status of businesses
- Businesses’ financial performance
- Comparison with monthly GDP estimates across waves
- Workforce
- Homeworking
- Business resilience
- Site closures
- Government schemes
- Business Impact of Coronavirus (COVID-19) Survey data
- Glossary
- Measuring the data
- Strengths and limitations
- Related links
1. Other pages in this release
More commentary on the impacts of the coronavirus (COVID-19) pandemic on the UK economy and society is available on the following pages:
- Coronavirus and the latest indicators for the UK economy and society: 8 October 2020
- Coronavirus and the social impacts on Great Britain: 2 October 2020
2. Main points
- In Wave 14 (7 to 20 September 2020), 86% of businesses were currently trading, compared with 66% in Wave 7 (1 June to 14 June 2020).
- In Wave 14 (7 to 20 September 2020), 47% of businesses experienced a decrease in turnover, compared with 65% in Wave 7 (1 to 14 June 2020).
- Of businesses currently trading, 43% experienced a decrease in profits compared with what is normally expected for this time of year, while 7% experienced an increase.
- In Wave 14 (7 to 20 September 2020), 9% of the workforce were on furlough leave, compared with 30% in Wave 7 (1 June to 14 June 2020).
- Of businesses not permanently stopped trading, 26% had more staff working from home as a result of the coronavirus (COVID-19) pandemic and 19% intended to use increased homeworking as a permanent business model going forward.
- Of businesses not permanently stopped trading, 3% intended to permanently close business sites in the next three months.
3. Weighted data
The majority of the data available in this publication are weighted estimates. A detailed description of the weighting methodology and its differences to unweighted estimates is available in Business Impact of Coronavirus (COVID-19) Survey (BICS): preliminary weighted results.
Whether a variable has been weighted is available in the footnotes of every graph and table.
The weighted estimates in this publication include time series graphs from Wave 7 (1 to 14 June 2020) to Wave 14 (7 to 20 September 2020) for three of the main variables collected by the BICS – current trading status of businesses, the impact of turnover for the business’ financial performance and the proportions of workforce status. Weighted data are only available from Wave 7 onwards because of a sample redesign that occurred in Wave 7 that improved BICS’ coverage for small businesses.
For an estimates time series analysis on how the unweighted estimates changed between Wave 2 (23 March to 5 April 2020) and Wave 7 (1 to 14 June 2020), please see Insights of the BICS: 23 March to 5 April (Wave 2) to 1 to 14 June (Wave 7) 2020.
More about coronavirus
- Find the latest on coronavirus (COVID-19) in the UK.
- All ONS analysis, summarised in our coronavirus roundup.
- View all coronavirus data.
- Find out how we are working safely in our studies and surveys.
4. Current trading status of businesses
Final results from Wave 14 of the Business Impact of Coronavirus (COVID-19) Survey (BICS) are for the period 7 to 20 September 2020, which closed on 4 October 2020.
For presentational purposes,
- has been trading for more than the last two weeks and started trading within the last two weeks after a pause in trading have been combined to currently trading
- paused trading but intends to restart in the next two weeks and paused trading and does not intend to restart in the next two weeks have been combined to temporarily closed or paused trading
The breakdowns of these categories are available in the dataset in Section 12: Business Impact of Coronavirus (COVID-19) Survey data.
Figure 1: Across all industries, 86% of businesses were currently trading
Percentage of businesses, current trading status, broken down by industry, weighted, UK, 7 to 20 September 2020
Source: Office for National Statistics – Business Impact of Coronavirus (COVID-19) Survey
Notes:
- Final weighted results, Wave 14 of the Office for National Statistics (ONS) Business Impact of Coronavirus (COVID-19) Survey (BICS).
- Bars may not sum to 100% because of rounding and percentages less than 1% being removed for disclosure purposes.
- Other services and Mining and quarrying have been removed for presentational purposes, but their totals are included in "All Industries".
- Businesses were asked for their current trading status and so responses will be from the point of completion of the questionnaire (21 September to 4 October 2020).
Download this chart Figure 1: Across all industries, 86% of businesses were currently trading
Image .csv .xlsAcross all industries:
- 82% of businesses had been trading for more than the last two weeks
- 4% of businesses had started trading within the last two weeks after a pause in trading
- 3% of businesses had paused trading but intended to restart in the next two weeks
- 10% of businesses had paused trading and did not intend to restart in the next two weeks
- 1% of businesses had permanently ceased trading
The information and communication industry and the arts, entertainment and recreation industry had the highest percentages of businesses that were temporarily closed or paused trading, at 25% and 20% respectively.
Figure 2 shows how the weighted trading status estimates have changed between Wave 7 (1 to 14 June 2020) and Wave 14 (7 to 20 September 2020).
Figure 2: In Wave 14 (7 to 20 September 2020), 86% of businesses were currently trading, compared with 66% in Wave 7 (1 to 14 June 2020)
Percentage of businesses, current trading status, broken down by Wave, weighted, UK, 1 June to 20 September 2020
Source: Office for National Statistics – Business Impact of Coronavirus (COVID-19) Survey
Notes:
- Final weighted results, Wave 7 to Wave 14 of the Office for National Statistics (ONS) Businesses Impact of Coronavirus (COVID-19) Survey (BICS).
- Bars may not sum to 100% because of rounding, percentages less than 1% being removed for disclosure purposes, and those permanently ceased trading being removed.
- Businesses were asked for their experiences for the reference period. However, for questions regarding the last two weeks, businesses may respond from the point of completion of the questionnaire.
Download this chart Figure 2: In Wave 14 (7 to 20 September 2020), 86% of businesses were currently trading, compared with 66% in Wave 7 (1 to 14 June 2020)
Image .csv .xlsIn Wave 14 (7 to 20 September 2020), 86% of businesses were currently trading, compared with 66% in Wave 7 (1 to 14 June 2020). This was a steady increase.
Table 1 shows how the weighted trading status estimates for Wave 14 are broken down between employment size bands of businesses. This shows how the distribution of trading statuses in smaller businesses (such as those with employment of fewer than 10) is different to that of larger businesses and how weighting means better representation of these smaller businesses.
| Size Band | Currently trading | Temporarily closed or paused trading | Permanently ceased trading |
|---|---|---|---|
| 0 - 9 | 85.3% | 13.5% | 1.2% |
| 10 - 49 | 94.9% | 3.8% | 1.2% |
| 50 - 99 | 96.0% | 3.1% | * |
| 100 -249 | 98.7% | 1.0% | * |
| 250 + | 98.1% | 1.4% | * |
| All Size Bands Excluding 0 - 9 | 95.3% | 3.5% | 1.1% |
| All Size Bands | 86.3% | 12.4% | 1.2% |
Download this table Table 1: Percentage of businesses, current trading status, broken down by size band, weighted, 7 to 20 September 2020
.xls .csvAdditional data and breakdowns on the current trading status of businesses can be found in the dataset in Section 12: Business Impact of Coronavirus (COVID-19) Survey data.
Nôl i'r tabl cynnwys5. Businesses’ financial performance
For presentational purposes, in Figure 3 decreased turnover categories and increased turnover categories have been combined. The breakdowns of these categories are available in the dataset in Section 12: Business Impact of Coronavirus (COVID-19) Survey data.
Figure 3: There were four industries where more than half of their businesses experienced a decreased in turnover compared with what is normally expected for this time of year
Impact on turnover, businesses that are currently trading, broken down by industry, weighted, UK, 7 to 20 September 2020
Source: Office for National Statistics – Business Impact of Coronavirus (COVID-19) Survey
Notes:
- Final weighted results, Wave 14 of the Office for National Statistics (ONS) Business Impact of Coronavirus (COVID-19) Survey; businesses currently trading.
- Bars may not sum to 100% because of rounding and percentages less than 1% being removed for disclosure purposes.
- Other services and Mining and quarrying have been removed for presentational purposes, but their totals are included in "All Industries".
- Businesses were asked for their experiences for the reference period 7 to 20 September 2020. However, for questions regarding the last two weeks, businesses may respond from the point of completion of the questionnaire (21 September to 4 October 2020).
Download this chart Figure 3: There were four industries where more than half of their businesses experienced a decreased in turnover compared with what is normally expected for this time of year
Image .csv .xlsAcross all industries, of businesses currently trading:
- 47% experienced a decrease in turnover compared with what is normally expected for this time of year
- 35% experienced no impact on turnover
- 11% experienced an increase in turnover compared with what is normally expected for this time of year
There were four industries where more than half of their businesses experienced a decrease in turnover compared with what is normally expected for this time of year. These were the accommodation and food service activities industry (70%), the arts, entertainment and recreation industry (67%), the education industry (private sector and higher education businesses only) (59%), and the administrative and support service activities industry (52%).
Figure 4 shows how the weighted turnover estimates have changes between Wave 7 (1 to 14 June 2020) and Wave 14 (7 to 20 September 2020).
Figure 4: In Wave 14 (7 to 20 September 2020), 47% of businesses experienced a decreased in turnover, compared with 65% in Wave 7 (1 to 14 June 2020)
Impact on turnover, businesses that are currently trading, broken down by Wave, weighted, UK, 1 June to 20 September 2020
Source: Office for National Statistics – Business Impact of Coronavirus (COVID-19) Survey
Notes:
- Final weighted results, Wave 7 to Wave 14 of the Office for National Statistics (ONS) Businesses Impact of Coronavirus (COVID-19) Survey (BICS); businesses currently trading.
- Bars may not sum to 100% because of rounding and percentages less than 1% being removed for disclosure purposes.
- Businesses were asked for their experiences for the reference period. However, for questions regarding the last two weeks, businesses may respond from the point of completion of the questionnaire.
Download this chart Figure 4: In Wave 14 (7 to 20 September 2020), 47% of businesses experienced a decreased in turnover, compared with 65% in Wave 7 (1 to 14 June 2020)
Image .csv .xlsIn Wave 14 (7 to 20 September 2020), 47% of businesses experienced a decrease in turnover, compared with 65% in Wave 7 (1 to 14 June 2020). This was a steady decrease.
Additional data and breakdowns on the impact of turnover for businesses’ financial performance can be found in the dataset in Section 12: Business Impact of Coronavirus (COVID-19) Survey data. These include unweighted data broken down by region.
In Wave 14, businesses that were currently trading were also asked how the coronavirus pandemic had affected their profits in the last two weeks, compared with normal expectations for this time of year.
For presentational purposes, in Figure 5 decreased profits categories and increased profits categories have been combined. The breakdowns of these categories are available in the dataset in Section 12: Business Impact of Coronavirus (COVID-19) Survey data.
Figure 5: Of businesses currently trading, 43% reported a decrease in profits compared with what is normally expected for this time of year, while 7% reported an increase
Impact on profit, businesses that are currently trading, broken down by industry, weighted, UK, 7 to 20 September 2020
Source: Office for National Statistics – Business Impact of Coronavirus (COVID-19) Survey
Notes:
- Preliminary weighted results, Wave 14 of the Office for National Statistics (ONS) Business Impact of Coronavirus (COVID-19) Survey; businesses currently trading.
- Bars may not sum to 100% because of rounding and percentages less than 1% being removed for disclosure purposes.
- Other services and Mining and quarrying have been removed for presentational purposes, but their totals are included in "All Industries".
- Businesses were asked for their experiences for the reference period 7 to 20 September 2020. However, for questions regarding the last two weeks, businesses may respond from the point of completion of the questionnaire (21 September to 4 October 2020).
Download this chart Figure 5: Of businesses currently trading, 43% reported a decrease in profits compared with what is normally expected for this time of year, while 7% reported an increase
Image .csv .xlsAcross all industries, of businesses currently trading:
- 43% experienced a decrease in profits compared with what is normally expected for this time of year
- 34% experienced no impact on profits
- 7% experienced an increase in profits compared with what is normally expected for this time of year
The accommodation and food service activities industry and the arts, entertainment and recreation industry had the highest percentages of businesses experiencing a decrease in profits, at 61% and 58% respectively.
Meanwhile, the wholesale and retail trade industry had the highest percentage of businesses experiencing an increase in profits, at 14%. Additional information on the wholesale and retail trade industry is available in Retail sales, Great Britain: August 2020.
Nôl i'r tabl cynnwys6. Comparison with monthly GDP estimates across waves
The introduction of weighted estimates for the Business Impact of Coronavirus (COVID-19) Survey (BICS) for Wave 7 to Wave 14 now allows the comparison of trends in the BICS data with other economic indicators published by the Office for National Statistics (ONS).
Figure 6 shows how the fortnightly turnover estimates from BICS broadly reflects the published UK monthly gross domestic product (GDP) estimates. This is despite the fact that BICS is published much earlier than the official monthly GDP estimates.
Figure 6: Fortnightly turnover estimates from BICS broadly reflect the published UK monthly GDP estimates
Net balances of businesses currently trading against GDP monthly estimates, UK, 9 March to 20 September 2020
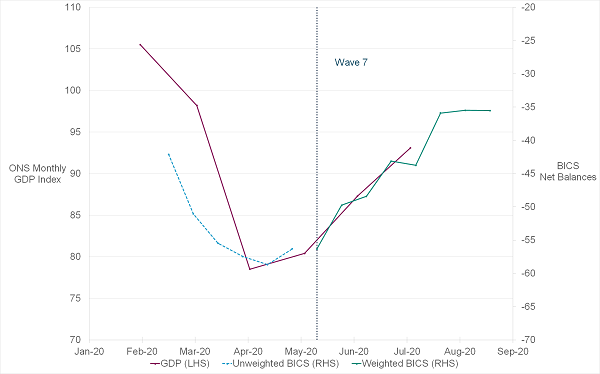
Source: Office for National Statistics – Business Impact of Coronavirus (COVID-19) Survey
Notes:
- Final unweighted results, Wave 1 to Wave 6, and preliminary weighted results, Wave 7 to Wave 14, of the Office for National Statistics (ONS) Business Impact of Coronavirus (COVID-19) Survey (BICS).
- Weighted net balances have been calculated from Wave 7 onwards only. The sample redesign in Wave 7 improves our coverage for the small sized businesses, allowing for weighted results to be truly reflective of all businesses.
- Monthly gross domestic product (GDP) publications are available.
- Net balances have been calculated by subtracting the weighted by turnover number of businesses who have reported a decrease in turnover from the weighted by turnover number of businesses with an increase in turnover, all divided by the total weighted number of businesses currently trading for that wave.
Download this image Figure 6: Fortnightly turnover estimates from BICS broadly reflect the published UK monthly GDP estimates
.png (30.8 kB) .xlsx (26.4 kB)
7. Workforce
From 1 September, the furlough scheme changed such that all employers must contribute 10% on top of the government’s 70% contribution. Our estimate for the proportion of businesses providing top-ups is 56%, with the likely interpretation of businesses being that they are providing top-ups above what they are obliged to provide under the new terms of the furlough scheme.
Figure 7: Of businesses not permanently stopped trading, 9% of the workforce were on partial or full furlough leave
Working arrangements, businesses that have not permanently stopped trading, broken down by industry, weighted, UK, 7 to 20 September 2020
Source: Office for National Statistics – Business Impact of Coronavirus (COVID-19) Survey
Notes:
- Final weighted results, Wave 14 of the Office for National Statistics (ONS) Business Impact of Coronavirus (COVID-19) Survey; businesses that have not permanently stopped trading.
- Bars may not sum to 100% because of rounding, percentages less than 1% being removed for disclosure purposes, and those off sick or in self-isolation due to coronavirus (COVID-19), permanently made redundant or 'other' have being removed.
- Other services and Mining and quarrying have been removed for presentational purposes, but their totals are included in “All Industries”.
- Businesses were asked for their experiences for the reference period 7 to 20 September 2020. However, for questions regarding the last two weeks, businesses may respond from the point of completion of the questionnaire (21 September to 4 October 2020).
Download this chart Figure 7: Of businesses not permanently stopped trading, 9% of the workforce were on partial or full furlough leave
Image .csv .xlsAcross all industries, of businesses not permanently stopped trading:
- 9% of the workforce were on partial or full furlough leave
- 28% of the workforce were working remotely instead of at their normal place of work
- 59% of the workforce were working at their normal place of work
The arts, entertainment and recreation industry and the accommodation and food service activities industry had the highest proportions of their workforce on partial or full furlough leave under the terms of the UK government’s Coronavirus Job Retention Scheme (CJRS), at 32% and 27% respectively
Meanwhile, the information and communication industry and the professional, scientific and technical activities industry had the highest proportions of their workforce working remotely instead of at their normal place of work, at 74% and 62% respectively.
For a more detailed outline of “Other” working arrangements across waves, please see the Coronavirus and the experiences of UK businesses, textual analysis: March 2020 to July 2020 article, which outlines how these “Other” working arrangements have changed over Waves 2 to 9.
Figure 8 shows how the weighted workforce status estimates have changes between Wave 7 (1 to 14 June 2020) and Wave 14 (7 to 20 September 2020).
Figure 8: In Wave 14 (7 to 20 September 2020), 9% of the workforce were on furlough leave, compared with 30% in Wave 7 (1 to 14 June 2020)
Working arrangements, businesses that have not permanently stopped trading, broken down by Wave, weighted, UK, 1 June to 20 September 2020
Source: Office for National Statistics – Business Impact of Coronavirus (COVID-19) Survey
Notes:
- Final weighted results, Wave 7 to Wave 14 of the Office for National Statistics (ONS) Businesses Impact of Coronavirus (COVID-19) Survey (BICS); businesses that have not permanently stopped trading.
- Bars may not sum to 100% because of rounding, percentages less than 1% being removed for disclosure purposes, and those off sick or in self-isolation because of COVID-19, permanently made redundant or “other” being removed.
- Businesses were asked for their experiences for the reference period. However, for questions regarding the last two weeks, businesses may respond from the point of completion of the questionnaire.
Download this chart Figure 8: In Wave 14 (7 to 20 September 2020), 9% of the workforce were on furlough leave, compared with 30% in Wave 7 (1 to 14 June 2020)
Image .csv .xlsIn Wave 14 (7 to 20 September 2020), 9% of the workforce were on furlough leave, compared with 30% in Wave 7 (1 to 14 June 2020). This was a steady decreased.
Additional data and breakdowns on the proportions of businesses’ workforce status can be found in the dataset in Section 12: Business Impact of Coronavirus (COVID-19) Survey data.
Figure 9: Across all industries, 9% of the workforce that were still on partial or full furlough leave returned from leave in the last two weeks
Proportions of the workforce who have returned to work in the last two weeks, businesses currently trading, broken down by industry, weighted, UK, 7 to 20 September 2020
Source: Office for National Statistics – Business Impact of Coronavirus (COVID-19) Survey
Notes:
- Final weighted results, Wave 14 of the Office for National Statistics (ONS) Business Impact of Coronavirus (COVID-19) Survey (BICS); businesses currently trading.
- Bars may not sum to 100% because of rounding, percentages less than 1% being removed for disclosure purposes, and businesses do not have to report workforce proportions that sum to 100%.
- Other services and Mining and quarrying have been removed for presentational purposes, but their totals are included in “All Industries”.
- Businesses were asked for their experiences for the reference period 7 to 20 September 2020. However, for questions regarding the last two weeks, businesses may respond from the point of completion of the questionnaire (21 September to 4 October 2020).
Download this chart Figure 9: Across all industries, 9% of the workforce that were still on partial or full furlough leave returned from leave in the last two weeks
Image .csv .xlsWhen interpreting the proportion of the workforce estimates returning from furlough leave or from remote working in the last two weeks, consideration of the industries that had a higher proportion of their workforce furloughed is needed.
Across all industries, of businesses currently trading:
- 6% of the workforce returned from furlough in the last two weeks to the normal place of work
- 3% of the workforce returned from furlough in the last two weeks to remote working
- 5% of the workforce returned from remote working to the normal workplace in the last two weeks
Figure 10: Of businesses that had a proportion of their workforce on furlough leave, 56% were providing top-ups to furloughed workers on top of the CJRS payments
Percentage of businesses that have not permanently stopped trading with a proportion of the workforce furloughed, broken down by industry, weighted, UK, 7 to 20 September 2020
Source: Office for National Statistics – Business Impact of Coronavirus (COVID-19) Survey
Notes:
- Preliminary weighted results, Wave 14 of the Office for National Statistics (ONS) Business Impact of Coronavirus (COVID-19) Survey (BICS); businesses that have not permanently stopped trading and have a proportion of their workforce furloughed.
- Bars may not sum to 100% because of rounding and percentages less than 1% being removed for disclosure purposes.
- Other services and Mining and quarrying have been removed for presentational purposes, but their totals are included in “All Industries”.
Download this chart Figure 10: Of businesses that had a proportion of their workforce on furlough leave, 56% were providing top-ups to furloughed workers on top of the CJRS payments
Image .csv .xlsAcross all industries, of businesses that had a proportion of their workforce furloughed, 56% were providing top-ups to furloughed workers’ pay and 40% were not providing top-ups to furloughed workers’ pay.
Nôl i'r tabl cynnwys8. Homeworking
In Wave 14, businesses that had not permanently stopped trading were asked a series of questions about their workforce and homeworking.
Figure 11: Of businesses not permanently stopped trading, 26% had more staff working from home as a result of the coronavirus (COVID-19) pandemic
Staff working from home, businesses that have not permanently stopped trading, broken down by industry, weighted, UK, 7 to 20 September 2020
Source: Office for National Statistics – Business Impact of Coronavirus (COVID-19) Survey
Notes:
- Preliminary weighted results, Wave 14 of the Office for National Statistics (ONS) Business Impact of Coronavirus (COVID-19) Survey; businesses not permanently stopped trading.
- Bars may not sum to 100% because of rounding and percentages less than 1% being removed for disclosure purposes.
- Other services and Mining and quarrying have been removed for presentational purposes, but their totals are included in “All Industries”.
Download this chart Figure 11: Of businesses not permanently stopped trading, 26% had more staff working from home as a result of the coronavirus (COVID-19) pandemic
Image .csv .xlsAcross all industries, of businesses not permanently stopped trading, 26% had more staff working from home as a result of the coronavirus (COVID-19) pandemic compared with 70% that did not have more staff working from home as a result of the coronavirus pandemic.
The information and communication industry and the water supply, sewerage, waste management and remediation activities industry had the highest percentages of businesses that had more staff working from home as a result of the coronavirus pandemic, at 55% and 48% respectively.
Conversely, the transportation and storage industry had the highest percentage of businesses that did not have more staff working from home, at 98%.
Figure 12: Of businesses not permanently stopped trading and that had more staff working from home, 64% experienced an increased in or no impact on productivity
Levels of productivity, businesses that have not permanently stopped trading and who had more staff working from home, broken down by industry, weighted, UK, 7 to 20 September 2020
Source: Office for National Statistics – Business Impact of Coronavirus (COVID-19) Survey
Notes:
- Preliminary weighted results, Wave 14 of the Office for National Statistics (ONS) Business Impact of Coronavirus (COVID-19) Survey; businesses not permanently stopped trading and that reported more staff working from home.
- Bars may not sum to 100% because of rounding and percentages less than 1% being removed for disclosure purposes.
- Other services and Mining and quarrying have been removed for presentational purposes, but their totals are included in “All Industries”.
Download this chart Figure 12: Of businesses not permanently stopped trading and that had more staff working from home, 64% experienced an increased in or no impact on productivity
Image .csv .xlsAcross all industries, of businesses not permanently stopped trading and that reported more staff working from home:
- 12% experienced an increase in productivity
- 52% experienced no impact on productivity
- 24% experienced a decrease in productivity
The manufacturing industry had the highest percentage of businesses experiencing a decrease in productivity because of having more staff working from home, at 46%. This was followed by the real estate activities industry and the professional, scientific and technical activities industry, at 39% and 34%, respectively.
Figure 13: Of businesses not permanently stopped trading, 19% intended to use increased homeworking as a permanent business model going forward
Intentions for staff working from home, businesses who have not permanently stopped trading, broken down by industry, weighted, UK, 7 September to 20 September 2020
Source: Office for National Statistics – Business Impact of Coronavirus (COVID-19) Survey
Notes:
- Preliminary weighted results, Wave 14 of the Office for National Statistics (ONS) Business Impact of Coronavirus (COVID-19) Survey; businesses not permanently stopped trading.
- Bars may not sum to 100% because of rounding and percentages less than 1% being removed for disclosure purposes.
- Other services and Mining and quarrying have been removed for presentational purposes, but their totals are included in “All Industries”.
Download this chart Figure 13: Of businesses not permanently stopped trading, 19% intended to use increased homeworking as a permanent business model going forward
Image .csv .xlsAcross all industries, of businesses not permanently stopped trading, 19% intended to use increased homeworking as a permanent business model going forward compared with 67% that did not intend to use increased homeworking as a permanent business model going forward.
Of businesses intending to use increased homeworking as a permanent business model going forward, 60% reported it was because of improved staff well-being, 55% reported it was because of reduced overheads, and 34% reported it was because of increased productivity.
Of businesses not intending to use increased homeworking as a permanent business model going forward, 66% reported it was because it was not suitable for their business and 10% reported it was because it had reduced communication.
Other effects on the workforce and industry breakdowns are available in the dataset in Section 12: Business Impact of Coronavirus (COVID-19) Survey data.
Nôl i'r tabl cynnwys9. Business resilience
For presentational purposes, in Figure 14 cash reserve categories between zero and three months have been combined. The breakdowns of these categories are available in the dataset in Section 12: Business Impact of Coronavirus (COVID-19) Survey data.
Figure 14: Across all industries, 28% of businesses had no or less than three months’ cash reserves
Cash reserves, businesses that have not permanently stopped trading, broken down by industry, weighted, UK, 7 to 20 September 2020
Source: Office for National Statistics – Business Impact of Coronavirus (COVID-19) Survey
Notes:
- Preliminary weighted results, Wave 14 of the Office for National Statistics (ONS) Business Impact of Coronavirus (COVID-19) Survey; businesses that have not permanently stopped trading.
- Bars may not sum to 100% because of rounding and percentages less than 1% being removed for disclosure purposes.
- Other services and Mining and quarrying have been removed for presentational purposes, but their totals are included in “All Industries”.
- Businesses were asked for their experiences for the reference period 7 to 20 September 2020. However, for questions regarding cash flow, businesses may respond from the point of completion of the questionnaire (21 September to 4 October 2020).
Download this chart Figure 14: Across all industries, 28% of businesses had no or less than three months’ cash reserves
Image .csv .xlsAcross all industries, of businesses not permanently stopped trading:
- 4% had no cash reserves
- 24% had less than three months’ cash reserves
- 17% had between four to six months’ cash reserves
- 34% had more than six months’ cash reserves
The accommodation and food service activities industry had the highest percentage of businesses that had no cash reserves, at 6%.
Conversely, the information and communication industry and the education industry (private sector and higher education businesses only) had the highest percentages of businesses that had cash reserves to last more than six months, at 43% and 42% respectively.
Businesses were also asked in Wave 14 how much confidence they had that they would survive the next three months.
Figure 15: Across all industries, 12% of businesses had low confidence that their business would survive the next three months
Confidence, businesses who have not permanently stopped trading, broken down by industry, weighted, UK, 7 September to 20 September 2020
Source: Office for National Statistics – Business Impact of Coronavirus (COVID-19) Survey
Notes:
- Preliminary weighted results, Wave 14 of the Office for National Statistics (ONS) Business Impact of Coronavirus (COVID-19) Survey; businesses that have not permanently stopped trading.
- Bars may not sum to 100% because of rounding, percentages less than 1% being removed for disclosure purposes, and businesses with no confidence have been removed.
- Other services and Mining and quarrying have been removed for presentational purposes, but their totals are included in “All Industries”.
- Businesses were asked for their experiences for the references period 7 to 20 September. However, for questions regarding confidence, businesses may respond form the point of completion of the questionnaire (21 September to 4 October 2020).
Download this chart Figure 15: Across all industries, 12% of businesses had low confidence that their business would survive the next three months
Image .csv .xlsAcross all industries, of businesses not permanently stopped trading:
- 12% had low confidence that their business would survive the next three months
- 36% had moderate confidence that their business would survive the next three months
- 41% had high confidence that their business would survive the next three months
The water supply, sewerage, waste management and remediation activities industry and the accommodation and food service activities industry had the highest percentages of businesses that had low confidence their business would survive the next three months, at 37% and 25%, respectively.
Conversely, the real estate activities industry had the highest percentage of businesses that had high confidence their business would survive the next three months, at 85%.
Nôl i'r tabl cynnwys10. Site closures
In Wave 14, businesses that had not permanently stopped trading were asked if they intended to permanently close any of their business sites in the next three months.
Figure 16: Of businesses not permanently stopped trading, 3% intended to permanently close business sites in the next three months
Intention to close business sites, businesses that have not permanently stopped trading, broken down by industry, unweighted, UK, 7 to 20 September 2020
Source: Office for National Statistics – Business Impact of Coronavirus (COVID-19) Survey
Notes:
- Final unweighted results, Wave 14 of the Office for National Statistics (ONS) Business Impact of Coronavirus (COVID-19) Survey (BICS); businesses that have not permanently stopped trading.
- Bars may not sum to 100% because of rounding and percentages less than 1% being removed for disclosure purposes.
- Other services and Mining and quarrying have been removed for disclosure purposes, but their totals are included in “All Industries”.
- Businesses were asked for their experiences for the reference period 7 to 20 September 2020. However, for questions regarding business site closures, businesses may respond from the point of completion of the questionnaire (21 September to 4 October 2020).
Download this chart Figure 16: Of businesses not permanently stopped trading, 3% intended to permanently close business sites in the next three months
Image .csv .xlsAcross all industries, of businesses not permanently stopped trading, 3% intended to permanently close business sites in the next three months and 85% did not intend to permanently close business sites in the next three months.
There were four industries where 5% of their businesses reported they intended to permanently close business sites in the next three months. These were the information and communication industry, the accommodation and food service activities industry, the education industry (private sector and higher education businesses only), and the human health and social work activities industry (private sector businesses only).
Of the businesses that indicated they intend to permanently close business sites in the next three months, 53% expected this to affect their business’ workforce through permanent redundancies; 35% expected the workforce to relocate; and 24% expected the workforce to move to remote working.
Other effects on the workforce and industry breakdowns are available in the dataset in Section 12: Business Impact of Coronavirus (COVID-19) Survey data.
Nôl i'r tabl cynnwys11. Government schemes
Data regarding the percentages of businesses applying for and receiving the different government schemes and initiatives (including the Coronavirus Job Retention Scheme (CJRS)) can now be found in the dataset in Section 12: Business Impact of Coronavirus (COVID-19) Survey data.
Nôl i'r tabl cynnwys13. Glossary
Embed code
14. Measuring the data
The Business Impact of Coronavirus (COVID-19) Survey (BICS) is voluntary and may only reflect the characteristics of those that responded; the results are experimental.
| Wave | 10 September 2020 Publication Wave 12 | 24 September 2020 Publication Wave 13 | 8 October 2020 Publication Wave 14 |
|---|---|---|---|
| Sample | 23,904 | 23,900 | 23,912 |
| Response | 5,318 | 5,998 | 5,522 |
| Rate | 22.2% | 25.1% | 23.1% |
Download this table Table 2: Sample and response rates for Waves 12, 13 and 14 of Business Impact of Coronavirus (COVID-19) Survey
.xls .csvThe business indicators are based on responses from the voluntary, fortnightly BICS, which captures businesses’ views on the impact on turnover, workforce prices, trade and business resilience. Wave 14 data relate to the period 7 to 20 September 2020. The survey questions are available.
The different experiences of businesses during the coronavirus pandemic
In the final results of Wave 14, of 23,912 businesses surveyed, 5,522 businesses (23.1%) responded.
The Wave 14 survey was live for the period 21 September to 4 October 2020 and businesses were asked about their experience for the two-week survey reference period, 7 to 20 September 2020. Dependent on responses to certain questions, businesses are asked different questions.
For questions or response options referring to the “last two weeks” or expectations of the “next two weeks”, businesses could respond from the point of completion of the questionnaire based on their current experiences. This means that business responses may cover any two-week time period across the following reference periods respectively: 7 to 20 September 2020 and 21 September to 4 October 2020. More detail on the type of questions asked are available in the dataset in Section 12: Business Impact of Coronavirus (COVID-19) Survey data.
Weighting
Weighted estimates for the BICS have been developed for numerous variables that are collected. A detailed description of the weighting methodology and its differences to unweighted estimates is available in BICS: preliminary weighted results.
Unweighted estimates should still be treated with caution when used to evaluate the impact of the coronavirus pandemic across the UK economy. When unweighted, each business is assigned the same weight regardless of turnover, size or industry, and businesses that have not responded to the survey or that are not sampled are not taken into account.
Coverage
The approach for the sample design has been to use three standard Office for National Statistics (ONS) surveys – the Monthly Business Survey (MBS), Retail Sales Inquiry (RSI) and Construction – as a sampling frame. Each of these survey samples are drawn from the Inter-Departmental Business Register (IDBR), which covers businesses in all parts of the economy, except those that are not registered for Value Added Tax (VAT) or Pay As You Earn (PAYE); this includes very small businesses, the self-employed, those without employees, and those with low turnover. Some non-profit-making organisations are also not registered on the IDBR.
The MBS covers the UK for production and only Great Britain for services. The RSI and Construction are Great Britain-focused. Therefore, BICS will be UK for production-based industries but Great Britain for the other elements of the economy covered.
The industries covered are:
- non-financial services (includes professional, scientific, communication, administrative, transport, accommodation and food, private health and education, and entertainment services)
- distribution (includes retail, wholesale and motor trades)
- production (includes manufacturing, oil and gas extraction, energy generation and supply, and water and waste management)
- construction (includes civil engineering, housebuilding, property development and specialised construction trades such as plumbers, electricians and plasterers)
The following industries are excluded from the survey:
- agriculture
- public administration and defence
- public provision of education and health
- finance and insurance
Reporting unit
The business unit to which questionnaires are sent is called the reporting unit. The response from the reporting unit can cover the enterprise as a whole or parts of the enterprise identified by lists of local units. Other than for a minority of larger business or businesses that have a more complex structure, the reporting unit is the same as the enterprise.
Where more than one type of economic activity is carried out by a local unit or enterprise, its principal activity is the activity in which most of the people are employed, and it does not necessarily account for 50% or more of the total employment of the unit. There are detailed rules for determining Standard Industrial Classification (SIC) for multiple-activity economic units.
Regional estimates
Regional BICS estimates are produced by taking the survey return from each reporting unit and then applying this to the reporting unit’s local sites. If a business has a site or several sites (also known as local units) within a country, using information from the IDBR, then this business is defined to have presence there.
The business is then allocated once within each region (regardless of the number of sites) and the information provided by the reporting unit as a whole copied and used within each country.
Aggregates of Nomenclature of Territorial Units for Statistics: NUTS1 regions such as the UK or England may have higher or lower response proportions than any of their constituent regions because of differences in the sample composition in terms of company workforce.
Since the larger, aggregate regions such as the UK or England generally have a larger proportion of smaller companies, if there is a substantial difference between the response proportions of larger and smaller companies, this will be reflected in the top-line figures.
Sample
For unweighted data only, the businesses that have responded to Wave 14 of the BICS are represented, and as such these are not fully representative of the UK as a whole.
The sampling frame used in the BICS was designed to achieve adequate coverage of the listed industries from the monthly business surveys. Coverage and response rate of the medium to largest businesses in terms of total employment are satisfactory to produce estimates on this basis.
To help interpret the data, we have presented results based on the number of employees in each business, grouping fewer than 250 employees and those with 250 employees or more.
All businesses with an employment of greater than 250 employees and that are included within the three monthly surveys (MBS, RSI and Construction) are included in the BICS sample with a random sample of 1% for those with an employment between 0 and 249.
The sample comprises 23,912 businesses with a split of 7,262 in employment for 250 and over and 16,650 for employment between 0 and 249. This breaks down further to 13,932 for employment between 0 and 99 and 2,718 for employment between 100 and 249.
As the sample is selected fortnightly, the same businesses will be selected for at least two waves depending on how many coronavirus survey selections there are between the selection of these feeder surveys. Because of the randomly selected element, there will be differences in this part of the sample once the feeder surveys have been redrawn. As this is a voluntary survey, businesses may or may not choose to respond to the different waves. Response coverage can be mixed between the different waves.
While we have the ability to align the reporting unit to lower-level detail, and also increased detail on the SIC, it is not advisable given the sparseness of response in certain industries and size bands.
Nôl i'r tabl cynnwys15. Strengths and limitations
Business Impact of Coronavirus (COVID-19) Survey
The Business Impact of Coronavirus (COVID-19) Survey (BICS) is voluntary. Unweighted estimates should be treated with caution, as results reflect the characteristics of those that responded and not necessarily the wider business population.
The survey was designed to give an indication of the impact of the coronavirus pandemic on businesses and a timelier estimate than other surveys.
Comparison of waves
A detailed description of the weighting methodology and its differences to unweighted estimates across waves can be found in the recently published BICS: preliminary weighted results article.
The production of weighted BICS estimates will allow for comparisons between waves, as any imbalances caused by non-responding and non-sampled businesses are corrected. This means that weighted estimates in every wave represent the experiences of all businesses rather than just those that have responded.
Some BICS variables remain unweighted while development continues to weight all the BICS variables. Therefore, comparison of unweighted estimates between waves should still be treated with caution because of the voluntary nature of the survey, the difference in response rates and dependency on those businesses that only responded in particular waves.
A initial article on Business impact of coronavirus, analysis over time, UK: Waves 2 to 5 captures common businesses responses on how their turnover, workforce, prices, trade and business resilience have been affected in the two-week reference period. These data relate to the period 23 March to 17 May 2020 (Wave 2 to Wave 5).
An updated article on Insights of the BICS: 23 March to 5 April (Wave 2) to 1 to 14 June (Wave 7) 2020 analyses businesses’ responses on how their turnover, cash flow and workforce have been affected in each two-week reference period.
Nôl i'r tabl cynnwys