1. Main points
In 2016, the number of registered businesses in Great Britain trading internationally was estimated at 305,200; this number represented 12.9% of the total number of businesses in the non-financial business economy.
Of these 305,200 businesses, over 95% were small- or medium-sized businesses (those businesses with fewer than 250 employees); however, this number only represented a small proportion (12.8%) of the total number of small- and medium-sized businesses in Great Britain.
The number of large businesses (those with 250 or more employees) trading internationally in 2016 was estimated to be 4,400; this number represented just over 50% of the total number of large businesses in Great Britain.
The largest internationally trading sector was non-financial services, with over half of the total number of businesses (51.3%) trading; this was followed by 31.0% of businesses reporting international trade in the distribution sector.
London and the South East were the regions with the highest number of businesses trading internationally in 2016; London accounted for nearly a quarter with 68,200 businesses (22.4%), while the lowest number was in the North East with 4,900 businesses (1.6%).
2. Things you need to know about this release
Annual Business Survey (ABS) estimates of exporters and importers include details of the number and proportion of businesses in Great Britain (that is, the UK excluding Northern Ireland) engaged in the international trade in goods and services. These estimates are experimental official statistics and are taken from the Annual Business Survey provisional 2016 release, which covers the non-financial business economy and accounts for just under two-thirds of the economy in terms of gross value added. Regional estimates are provided by apportioning out the trade status of a business to its local unit based on employment; our information paper contains further information on the method used.
Users should note that a sample re-optimisation has been included in the estimates for 2016. This is carried out every five years to improve the efficiency of the sample and estimation, and reduce sample variability as part of the regular process to improve estimates. This re-optimisation has led to discontinuity between 2015 and 2016 within small- and medium-sized businesses (those with less than 250 employees). Therefore, users should not make year-on-year comparisons between 2015 and 2016.
In 2015, the Office for National Statistics (ONS) business population was expanded to include approximately 92,000 solely Pay-As-You-Earn (PAYE)-based businesses. This led to an increase in the number of businesses in the overall population of approximately 4%. Nearly all of these businesses (99.3%) were in employment size-band one (0 to 9 employees) and nearly half of them were in the non-financial services sector. Within the ABS the new population was used for the first time in 2016. New estimates for 2015 were therefore calculated to assess the impact of the inclusion of these additional businesses. An impact article and corresponding reference tables showing the new 2015 estimates were published on Friday 20 October 2017.
All estimates and commentary within this release are based on comparisons between 2016 and new 2015 estimates, both of which include solely PAYE-based businesses. Corresponding data tables will be provided for 2015 on both bases, however, no special analyses can be provided for the new 2015 estimates due to the process used in calculating the data. This is because the methodology underpinning these estimates relies upon adjusting published estimates to account for the additional businesses, as opposed to collecting respondent data from these PAYE businesses.
International trade is defined as the import and/or export of goods and/or services. Total international trade is calculated as:
- the number of businesses exporting plus
- the number of businesses importing less
- the number of businesses that both export and import
The latter are included in both the exporter and importer counts so need to be subtracted to avoid double counting.
Industry breakdowns of these data are based on the main activity of the business. For example, if a business undertakes both distribution and service activities, but most of its employment is within distribution, then the whole business will be classified as distribution.
Due to methodological differences between the statistics from HM Revenue and Customs (HMRC) and the ABS statistics published in this release, the ”trade in goods” figures within each dataset are not directly comparable and may differ. Methodological differences between the two releases include differences in data sources and coverage, measurement of employee count, disclosure control procedures and the handling of revisions.
Nôl i'r tabl cynnwys3. Number of businesses trading internationally in 2016
In 2016, there were 305,200 businesses trading goods and services internationally. This number represented 12.9% of the total number of businesses trading within the non-financial business economy in Great Britain during the year.
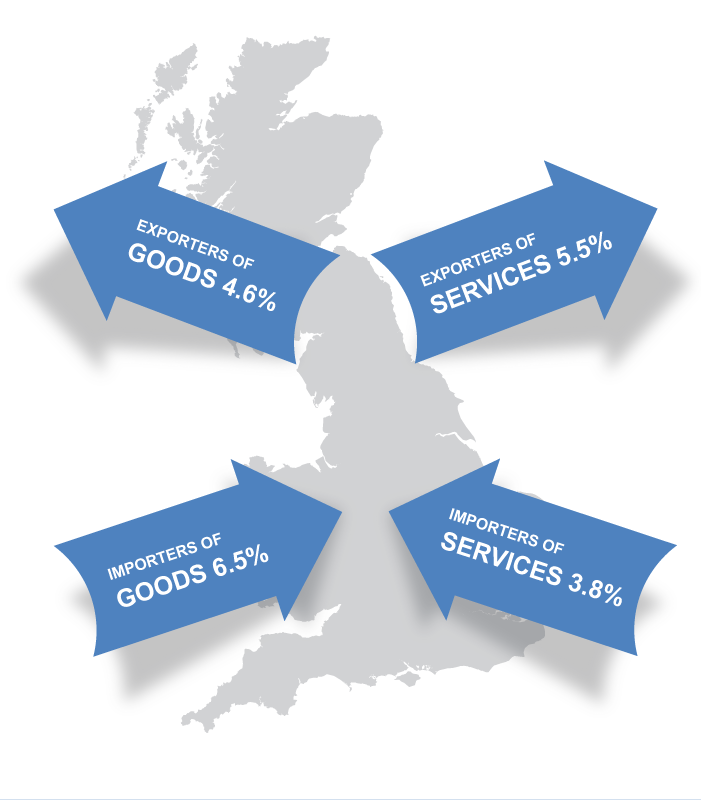
More of these businesses exported services than goods; 128,900 and 107,700 businesses respectively. Looking at imports, 154,400 businesses imported goods compared with 90,700 businesses that imported services. As a result, more businesses exported and/or imported goods (190,700 businesses) than services (165,100 businesses).
Figure 1: The proportion of businesses that import or export goods and services, 2016, Great Britain
Source: Office for National Statistics
Download this image Figure 1: The proportion of businesses that import or export goods and services, 2016, Great Britain
.png (88.7 kB)
In 2016, there were 4,400 large businesses (those with 250 employees and over) trading internationally. This is over half (52.7%) of the total number of large businesses (8,300) trading in Great Britain. This is a small increase compared with 2015 and 2014, where the number of businesses trading internationally was 4,300 and 4,100 respectively. In comparison, only 12.8% of the total of small- and medium-sized businesses in Great Britain traded internationally in 2016.
The total number of businesses that were foreign-owned in Great Britain in 2016 was 27,300. Of these, 16,700 (61.1%) traded internationally in goods and services. In contrast, only 12.4% of the total of UK-owned businesses traded internationally over the same period. Foreign-owned businesses were therefore more likely to trade overseas in goods and services than UK-owned businesses.
Nôl i'r tabl cynnwys4. In 2016 the largest internationally trading sector was non-financial services
In 2016, of the total number of businesses (305,200) that traded internationally, 156,500 (51.3%) were within the non-financial services sector. Figure 2 shows the contributions from all four main sectors of the non-financial business economy.
Figure 2: Great Britain non-financial business economy, number of businesses trading internationally by sector, 2016
Source: Office for National Statistics
Download this chart Figure 2: Great Britain non-financial business economy, number of businesses trading internationally by sector, 2016
Image .csv .xlsWithin non-financial services, the greatest contribution to the total number of businesses trading internationally was from professional, scientific and technical services (section M), with 58,100 businesses; this represented 37.1% of the total of all businesses trading internationally within non-financial services. Section M covers a range of activities from legal and accounting to advertising and marketing.
Within distribution (section G), 94,700 businesses traded internationally in goods and services. The largest contribution to trade in this sector was from wholesale trade, followed closely by retail trade. They contributed 48,700 and 41,000 businesses respectively to international trade. Within the production sector, section C manufacturing was the largest contributor, with 44,000 businesses trading internationally.
Nôl i'r tabl cynnwys5. Regional performance
London and the South East continued to be England’s largest contributing regions, with 22.4% and 17.0% respectively of Great Britain’s internationally trading businesses located there. In 2016, the third largest English region became the South West, where 10.5% of businesses participated in international trade. This was due to a large rise in the number of businesses trading in services rather than goods.
In contrast, the three regions that contributed the least to international trade in Great Britain were the North East, Yorkshire and The Humber, and the East Midlands. Combined they contributed less than London and the South West individually, with only 14.0% of businesses within these regions trading internationally.
On a national level, the picture remained fairly constant. As a percentage of Great Britain’s international trade, England continued to dominate with 91.8% of businesses that trade internationally located there compared with 5.4% in Scotland and only 2.8% in Wales.
Nôl i'r tabl cynnwys7. Quality and methodology
The Annual Business Survey (ABS) Quality and Methodology Information report contains important information on:
- the strengths and limitations of the data and how it compares with related data
- uses and users of the data
- how the output was created
- the quality of the output including the accuracy of the data
You will also find detailed information on the methods used in the calculation of the ABS in the ABS Technical Report published on the ABS methodology page.
Nôl i'r tabl cynnwys