Yn yr adran hon
- Disclaimer
- Main points
- Statistician’s comment
- Things you need to know about this release
- Statistical Population Dataset (SPD) V2.0 methodology in brief
- Coverage of Statistical Population Dataset (SPD) V2.0 for England and Wales, 2011
- Performance at local authority level
- Performance for male and female population estimates
- Impact of methodological developments
- Researching the use of "activity" data
- Performance of Statistical Population Dataset (SPD) V2.0 over time
- Summary and next steps
1. Disclaimer
The Research Outputs are NOT official statistics on the population. Rather they are published merely as outputs from research into a methodology different to that currently used in the production of population statistics.
It is important that the information and research presented on these pages be read alongside the outputs to aid interpretation and avoid misunderstanding. These outputs must not be reproduced without this disclaimer and warning note.
Nôl i'r tabl cynnwys2. Main points
Our new methodology (SPD V2.0) is producing Statistical Population Dataset (SPD) estimates that are, for the majority of local authorities, closer to the 2011 Census estimate than the SPD estimates we produced using the original methodology (SPD V1.0). This is most apparent in London boroughs.
The differences between SPD estimates and official estimates (2011 Census and 2015 mid-year) are larger for the 2015 data than for the 2011 data.
SPD estimates have most notably improved for female populations and children aged 5 to 14.
Improvements for 5- to 14-year-olds are the result of additional administrative records being included from the English School Census and Welsh School Census.
SPD estimates for males aged 30 to 59 in England and Wales have increased using our new methodology (SPD V2.0), when compared with the estimates produced by our original methodology (SPD V1.0), widening the difference between SPD and official estimates for males in this age group.
More sources of administrative data, including “activity” data, are required to improve the accuracy of the SPD estimates, particularly for males of working age. “Activity” can be defined as an individual interacting with an administrative system, for example for National Insurance or tax purposes, when claiming a benefit, attending hospital or updating information on government systems in some other way. Only demographic information (such as name, date of birth and address) and dates of interaction are needed from such data sources to improve the coverage of our population estimates.
Nôl i'r tabl cynnwys3. Statistician’s comment
“In our second release of Administrative Data Research Outputs, we have improved the accuracy and breadth of population estimates produced by linking administrative data sources. They are not official statistics on the population.
However, in order to improve these population estimates to the quality that our users need, we need even more access to administrative data.”
Andy Teague, Head of Admin Data Census Project, Office for National Statistics
Nôl i'r tabl cynnwys4. Things you need to know about this release
The Research Outputs are NOT official statistics on the population. Rather they are published merely as outputs from research into a methodology different to that currently used in the production of population statistics.
It is important that the information and research presented on these pages be read alongside the outputs to aid interpretation and avoid misunderstanding. These outputs must not be reproduced without this disclaimer and warning note.
Our methodology is based on linking person records on administrative datasets to construct a Statistical Population Dataset (SPD) and builds on the methodology used to produce SPD V1.0.
This year we have also produced outputs for Lower Layer Super Output Areas (LSOAs). Further information on LSOAs can be found in this Slideshare link and in this LSOA analysis tool.
If you have any questions please email Admin.Data.Census.Project@ons.gov.uk (and include the subject line "Research Outputs feedback"). Many thanks.
Nôl i'r tabl cynnwys5. Statistical Population Dataset (SPD) V2.0 methodology in brief
In summary, there are 3 new components to SPD V2.0 that have been included to improve the coverage of the SPD estimates. These are:
the inclusion of school census records to improve the coverage of children aged 5 to 14
the inclusion of additional records that have been linked between the NHS Patient Register (PR), the Department for Work and Pensions (DWP) Customer Information System (CIS), and Higher Education Statistics Agency (HESA) data using improved matching methodologies.
the assignment of records on the SPD to the most likely address using ”activity” data from DWP benefit interactions and address moves recorded on the Personal Demographic Service (PDS). For a definition of ”activity”, see section 2: Main points.
To understand the impact of these changes we compare the differences in performance between SPD V1.0 and SPD V2.0 for the years 2011 and 2015. A more detailed description of the SPD V2.0 methodology can be found in our accompanying methodology report.
Nôl i'r tabl cynnwys6. Coverage of Statistical Population Dataset (SPD) V2.0 for England and Wales, 2011
Overall, SPD V2.0 shows an improvement on SPD V1.0 for England and Wales in 2011.
Figure 1: Comparison of SPD V1.0 with 2011 Census by 5-year age group and sex, England and Wales, 2011
Source: Office for National Statistics
Notes:
Bars to the right of the central line (zero) are those ages and sexes with SPD V1.0 estimates higher than the 2011 Census. Bars to the left are those with SPD V1.0 estimates lower than the 2011 Census.
SPD - Statistical Population Dataset.
Download this chart Figure 1: Comparison of SPD V1.0 with 2011 Census by 5-year age group and sex, England and Wales, 2011
Image .csv .xls
Figure 2: Comparison of SPD V2.0 with 2011 Census by 5-year age group and sex, England and Wales, 2011
Source: Office for National Statistics
Notes:
Bars to the right of the central line (zero) are those ages and sexes with SPD V2.0 estimates higher than the 2011 Census. Bars to the left are those with SPD V2.0 estimates lower than the 2011 Census.
SPD - Statistical Population Dataset.
Download this chart Figure 2: Comparison of SPD V2.0 with 2011 Census by 5-year age group and sex, England and Wales, 2011
Image .csv .xlsThe most notable impact is observed for 5- to 9-year-olds and 10- to 14-year-olds. This is mostly the result of children registered on the school census being added to the SPD when they are also found to be on either the NHS Patient Register (PR) or the Department for Work and Pensions (DWP) Customer Information System (CIS). When compared with the 2011 Census estimate, the SPD estimate has moved from being 2.6% lower for 5- to 9-year-olds, to 0.4% higher in V2.0. For 10- to 14-year-olds, the SPD has reduced from negative 3.7% to negative 1.0% using V2.0.
The impact of SPD V2.0 is more modest for other age-sex groups. The introduction of an improved matching methodology in V2.0 has improved the estimate for females aged 15 to 59. However, it has slightly increased the estimates for males aged 30 to 59, making them higher in SPD V2.0 than they were in SPD V1.0.
This year we have focused our methodology on developing inclusion and redistribution rules to improve the SPD where it was lower than the official estimates. In future years we will explore the potential use of ”activity” data for removing records from the SPD if there is no evidence that they are still part of the ”usually resident” population. This should result in a reduction in males of working age on the SPD, where the SPD is generally higher than the official estimates.
For a definition of “activity”, see section 2: Main points. Usually resident population – we are currently adopting the United Nations (UN) definition of “usually resident” – that is, the place at which a person has lived continuously for at least 12 months, not including temporary absences for holidays or work assignments, or intends to live for at least 12 months (United Nations, 2008).
The use of “activity” data to remove records or adjust a dataset to align with statistical definitions (for example, that of the “usually resident” population that we are adopting here) is common practice among other countries who are moving towards a census based on registers or administrative data, such as Estonia, Italy and New Zealand. A similar approach has been adopted by researchers investigating the use of administrative data to produce population estimates, such as Using Administrative Data to Count Local Populations (Harper and Mayhew, 2011). They proposed the use of multiple data sources to produce a “minimum confirmed dataset”. “Activity” data can also be referred to as “interactions”, “signs of life” and “signals” data.
Section 10 outlines some of our initial research findings from using “activity” data that is currently available to us, which includes Pay As You Earn (PAYE) income, and some benefits data provided by DWP. The removal of SPD records that do not have recent PAYE or benefits interaction results in notably lower SPD estimates when compared with the official estimates. We do not currently have access to a more complete range of “activity” datasets that will provide better coverage of the usually resident population. We continue to pursue more datasets for future SPD development.
Nôl i'r tabl cynnwys7. Performance at local authority level
The distribution of local authority population estimates using Statistical Population Dataset (SPD) V1.0 show a general tendency for the SPD to be lower than the official estimates, whereas SPD V2.0 has a much more even distribution. Two thirds (69%, 239) of local authorities have lower estimates in SPD V1.0 compared with 50% (175) in SPD V2.0.
Figure 3: Local authority distribution of difference between SPD estimates (V1.0 and V2.0) and census estimates, England and Wales, 2011

Source: Office for National Statistics
Notes:
The P1 quality standard is the maximum quality standard set out in the evaluation criteria of the Beyond 2011 programme. This is equivalent to the maximum quality achieved in the current system (that is, what is achieved in a census year) every year (see Beyond 2011 Options Report 2 for more information).
At the local authority level, the P1 quality standard is to be within positive or negative 3.8% of the 2011 Census estimate.
SPD - Statistical Population Dataset.
Download this image Figure 3: Local authority distribution of difference between SPD estimates (V1.0 and V2.0) and census estimates, England and Wales, 2011
.png (64.3 kB) .xls (62.5 kB)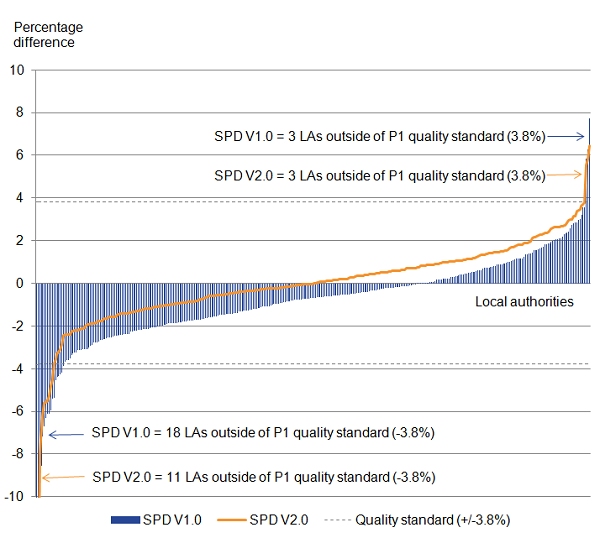
Comparing the SPD estimates with our P1 quality standard, which is where an estimate in the SPD is 3.8% higher or lower than the census estimate, SPD V2.0 had fewer local authorities outside this range. The 3 local authorities above 3.8% of the 2011 Census estimate in V2.0 are consistent with V1.0; Blackpool, Knowsley and City of London.
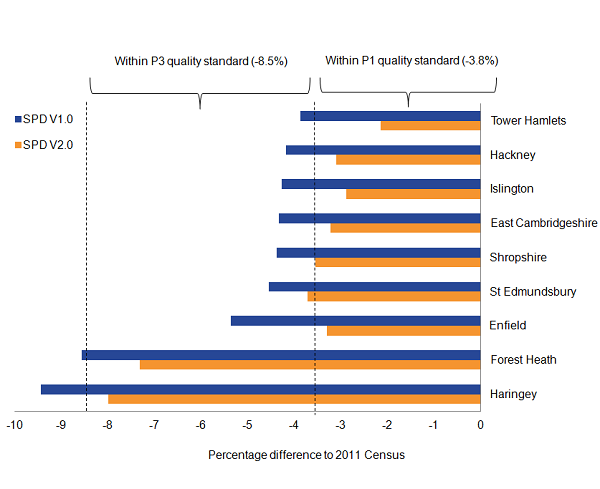
A number of local authorities have moved to within the P1 and P3 quality standards, 4 of which are London boroughs: Enfield, Islington, Hackney and Tower Hamlets.
Figure 4: Performance of SPD V1.0 and SPD V2.0 against P1 and P3 quality standards, 2011
Source: Office for National Statistics
Notes:
Selected local authorities for those that have moved performance bands between SPD V1.0 and SPD V2.0.
The P1 quality standard is the maximum quality standard set out in the evaluation criteria of the Beyond 2011 programme. The P3 quality standard is the average quality standard set out in the evaluation criteria. P1 and P3 are equivalent to the maximum and average quality achieved in the current system (ie what is achieved in a census year) every year (see Beyond 2011 Options Report 2 for more information).
At the local authority level, the P1 quality standard is to be within positive or negative 3.8% of the census estimate and the P3 quality standard is to be within positive or negative 8.5% of the census estimate.
SPD - Statistical Population Dataset.
Download this image Figure 4: Performance of SPD V1.0 and SPD V2.0 against P1 and P3 quality standards, 2011
.png (38.2 kB) .xls (28.2 kB)
For SPD production, London is a particularly complex area due to the high level of migration in and out of the area. This is not always picked up in the administrative data sources in a timely manner. However, all of the inner London boroughs have SPD estimates closer to the 2011 Census when using V2.0.
| Local Authority | Percentage difference between census and SPD V1.0 population, 2011 | Percentage difference between census and SPD V2.0 population, 2011 | Improvement from SPD V1.0 to SPD V2.0 (percentage points) |
|---|---|---|---|
| City of London | 7.7 | 5.5 | 2.2 |
| Wandsworth | -3.6 | -1.6 | 2.0 |
| Tower Hamlets | -3.9 | -2.1 | 1.8 |
| Southwark | -3.1 | -1.4 | 1.7 |
| Westminster | -16.7 | -15.2 | 1.5 |
| Lambeth | -1.6 | -0.2 | 1.4 |
| Islington | -4.3 | -2.9 | 1.4 |
| Lewisham | -1.8 | -0.4 | 1.4 |
| Greenwich | -3.7 | -2.4 | 1.3 |
| Hackney | -4.2 | -3.1 | 1.1 |
| Kensington and Chelsea | -21.9 | -21.0 | 0.9 |
| Camden | -6.3 | -5.5 | 0.8 |
| Hammersmith and Fulham | -5.9 | -5.3 | 0.6 |
Download this table Table 1: Comparison of SPD V1.0 and V2.0 against census estimates, inner London boroughs, 2011
.xls .csvThere are 2 areas that continue to have large negative differences when compared with census estimates: Kensington and Chelsea (negative 21.0%) and Westminster (negative 15.2%). While they have seen similar levels of overall increase compared with other local authorities, these large differences are likely to be the result of individuals not being recorded on both the NHS Patient Register (PR) and the Department for Work and Pensions (DWP) Customer Information System (CIS). Additional data sources will be needed to provide more complete coverage of the usual resident population in these areas.
These maps show how the SPDs perform against official population estimates for the 2011 Census and the annual population estimates for mid-2015. They are based on the performance standards that were set during the Beyond 2011 Programme, for local authority population totals, which were published in 2013.
Embed code
8. Performance for male and female population estimates
The inclusion of additional records in Statistical Population Dataset (SPD) V2.0 has generally improved estimates for female total populations at local authority level. The most notable improvements for total female population estimates are observed in and around the London area.
Figure 5: Comparing SPD V2.0 and SPD V1.0, relative to 2011 Census estimates, females, 2011

Source: Office for National Statistics Contains OS data © Crown copyright 2015
Notes:
The change between SPD V1.0 and SPD V2.0 is derived by comparing the percentage difference between the census estimate and SPD V1.0 with the percentage difference between the census estimate and SPD V2.0. The magnitude (ignoring whether it is positive or negative) of the difference for SPD V1.0 is subtracted from the corresponding value for SPD V2.0. The 4 categories are the same on the maps for males and females. There are 2 median change values used, 1 for local authority and sex combinations that move closer to census, and 1 for those that move away.
SPD - Statistical Population Dataset.
Download this image Figure 5: Comparing SPD V2.0 and SPD V1.0, relative to 2011 Census estimates, females, 2011
.png (42.0 kB) .xls (58.4 kB)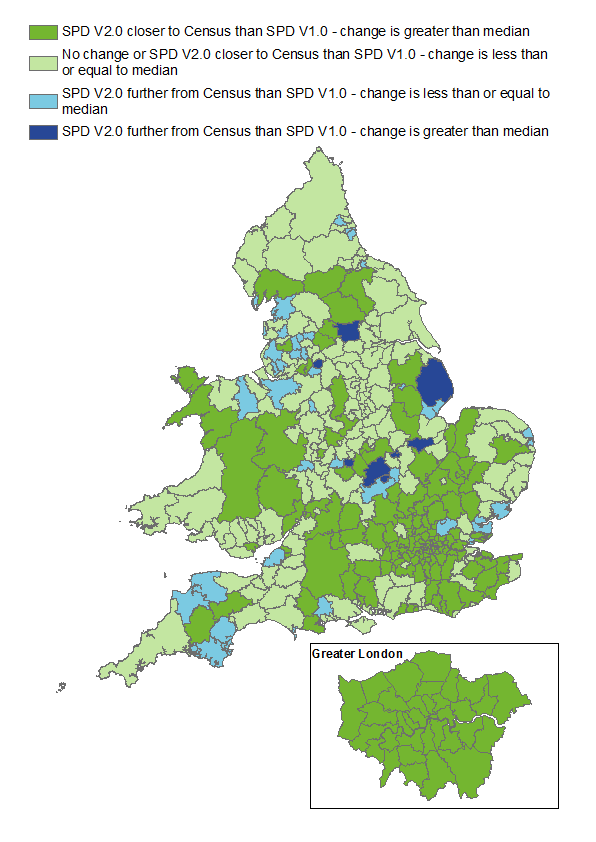
Figure 6: Comparing SPD V2.0 and SPD V1.0, relative to 2011 Census estimates, males, 2011

Source: Office for National Statistics Contains OS data © Crown copyright 2015
Notes:
The change between SPD V1.0 and SPD V2.0 is derived by comparing the percentage difference between the census estimate and SPD V1.0 with the percentage difference between the census estimate and SPD V2.0. The magnitude (ignoring whether it is positive or negative) of the difference for SPD V1.0 is subtracted from the corresponding value for SPD V2.0. The 4 categories are the same on the maps for males and females. There are 2 median change values used, 1 for local authority and sex combinations that move closer to census, and 1 for those that move away.
SPD - Statistical Population Dataset.
Download this image Figure 6: Comparing SPD V2.0 and SPD V1.0, relative to 2011 Census estimates, males, 2011
.png (43.4 kB) .xls (58.4 kB)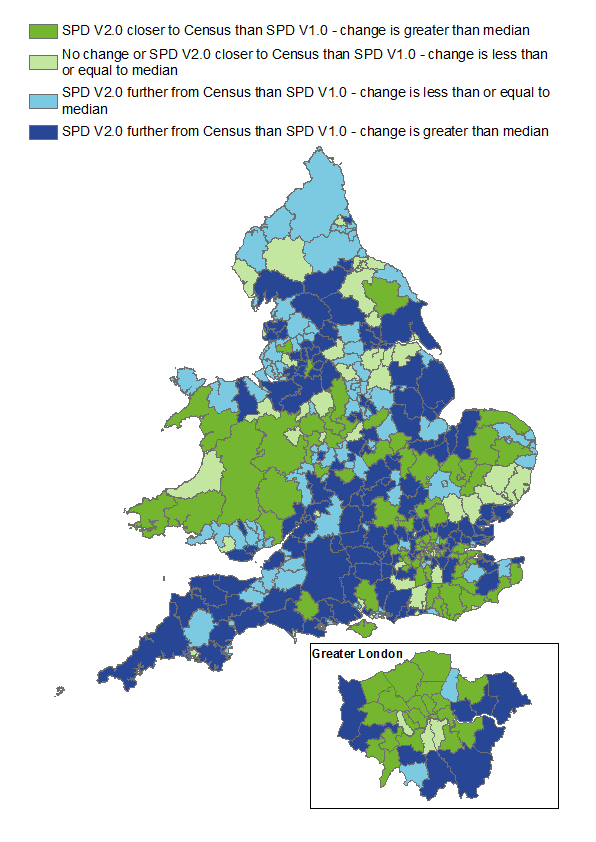
In contrast, the SPD estimates for males have generally moved further away from 2011 Census estimates. With the inclusion of additional probabilistic matches between records on the NHS Patient Register (PR) and the Department for Work and Pensions (DWP) Customer Information System (CIS), SPD V2.0 estimates of male populations have increased. This is particularly the case for males aged 30 to 44. Estimates for this age group were already high using SPD V1.0, so these additional matches have increased them further.
The differences observed between SPD estimates and census estimates continues to highlight the need for additional data sources that can provide “activity” indicators to confirm usual residency in the population. For a definition of ”activity”, see section 2: Main points. For a definition of “usual residency”, see section 6: Coverage of Statistical Population Dataset (SPD) V2.0 for England and Wales, 2011. This year we have started researching the potential use of income and benefits data supplied by DWP for this purpose. For SPD V2.0 we have restricted use of this data to help determine individuals’ most likely address. In future we will be exploring the use of this data (and other datasets we are pursuing) for the purpose of removing records of individuals from the SPD if there is no evidence that they are still part of the usually resident population. It may also be the case that good indicators of “activity”, for example, very recent interaction with services, will be used as the basis for including additional records on the SPD.
Nôl i'r tabl cynnwys9. Impact of methodological developments
School census inclusion
One of the developments made to Statistical Population Dataset (SPD) V2.0 [methodology][1] was the inclusion of school census records, which has had a large impact on SPD V2.0 population estimates. This additional data has led to the inclusion of children who are not registered on both the NHS Patient Register (PR) and the Department for Work and Pensions (DWP) Customer Information System (CIS). This has considerable impacts in some areas where there are higher proportions of children not registered on one of these sources.
Figure 7: Difference between SPD V1.0 and V2.0 estimates of 5- to 14-year-olds, local authority distribution, 2011
Source: Office for National Statistics
Notes:
The category of less than 0.5 percentage difference includes 2 local authorities with a small negative change. Nearly all local authorities have a positive change (increase) in the population estimates of 5- to 14-year-olds from SPD V1.0 to SPD V2.0. This is because the main change to the methods that affect this age group in SPD V2.0 is the inclusion of school census records. Negative changes are also possible due to the net effect of other methodological changes, for example, the redistribution of “half-weighted” records in SPD V2.0.
SPD - Statistical Population Dataset.
Download this chart Figure 7: Difference between SPD V1.0 and V2.0 estimates of 5- to 14-year-olds, local authority distribution, 2011
Image .csv .xlsMost local authorities have seen an increase in SPD V2.0 of between 2 and 3%. This methodology has increased the number of local authorities that are performing within the P1 quality standard for 5-year age-sex groups, which is to be within positive or negative 7.2% of the census estimate.
| Males | Females | |||
|---|---|---|---|---|
| SPD version | Aged 5-9 | Aged 10-14 | Aged 5-9 | Aged 10-14 |
| SPD V1.0 | 327 (94%) | 310 (89%) | 323 (93%) | 313 (90%) |
| SPD V2.0 | 341 (98%) | 336 (97%) | 343 (99%) | 337 (97%) |
Download this table Table 2: Number of local authorities with SPD estimates of selected 5-year age-sex groups within the P1 quality standard of the Census, 2011
.xls .csvUsing SPD V2.0, over 97% of local authorities are achieving the P1 quality standard for each of the 4 age-sex groups covering 5- to 14-year-olds. Most notable improvements are among males aged 10 to 14, where 336 (97%) local authorities are within the P1 quality standard in V2.0, compared with 310 (89%) using V1.0.
Figure 8: Top 10 local authorities with the largest percentage increase between SPD V1.0 and SPD V2.0 in the 5- to 14-year age group, 2011
Source: Office for National Statistics
Notes:
- SPD - Statistical Population Dataset.
Download this chart Figure 8: Top 10 local authorities with the largest percentage increase between SPD V1.0 and SPD V2.0 in the 5- to 14-year age group, 2011
Image .csv .xlsThe majority of local authorities with the largest increases in the 5- to 14-year age group are London boroughs. In our [2015 Research Outputs report][2] we suggested that some areas of London may have lower rates of child benefit take up and therefore higher numbers of children not registered on the CIS. This offers a potential explanation for SPD V1.0 estimates being generally lower than the 2011 Census for this age group. While SPD V1.0 required children to be registered on the CIS for inclusion in the estimates, SPD V2.0 has increased estimates for children by including matches made between the PR and school census records, as well as those found by linking records between the CIS and school census.
Figure 9: Source of additional matches made in SPD V2.0 with English School Census and Welsh School Census records, 2011
Source: Office for National Statistics
Notes:
- Selected local authorities with the highest increase in percentage of additional matches in SPD V2.0 with school census records.
- SPD - Statistical Population Dataset.
- PR – NHS Patient Register.
- CIS – Department for Work and Pensions (DWP) Customer Information System.
- SC - school census
Download this chart Figure 9: Source of additional matches made in SPD V2.0 with English School Census and Welsh School Census records, 2011
Image .csv .xlsFor London boroughs that have seen the highest percentage increase in 5- to 14-year-olds using SPD V2.0, the majority of school census inclusions have been the result of a match made with a PR record. This confirms that higher numbers of children are missing from the CIS among London boroughs.
Outside London, Purbeck (Dorset) and Richmondshire (North Yorkshire) are 2 local authorities with large armed forces bases. In these areas additional school census records are included in SPD V2.0, on the basis of the matches made with the CIS. This is consistent with what we would expect to see in circumstances where armed forces bases provide health services for the children of armed forces personnel. These children are less likely to be registered on the PR and were previously excluded from SPD V1.0. Estimates for 5- to 14-year-olds have therefore improved in areas with large armed forces bases, due to the inclusion of matches between the school census and CIS.
Improved matching methodology
Our [improved matching methodology][3] has had most impact amongst particular age groups and in specific local authorities. Using [probabilistic matching][4], the majority of additional matches across administrative sources have been made in London.
Figure 10: Number of probabilistic matches included in SPD V2.0 by England regions and Wales, 2011 and 2015
Source: Office for National Statistics
Notes:
SPD – Statistical Population Dataset.
PR – NHS Patient Register.
CIS – Department for Work and Pensions (DWP) Customer Information System.
Download this chart Figure 10: Number of probabilistic matches included in SPD V2.0 by England regions and Wales, 2011 and 2015
Image .csv .xlsThe additional records in each local authority, including both the probabilistic matches and those included by resolving match inconsistencies between PR, CIS and Higher Education Statistics Agency (HESA) data, can be seen in Figure 11. The number of additional records is shown as a percentage of the SPD V1.0 estimate.
Figure 11: Additional PR, CIS and HESA matches in SPD V2.0 as a percentage of SPD V1.0, England and Wales, 2011
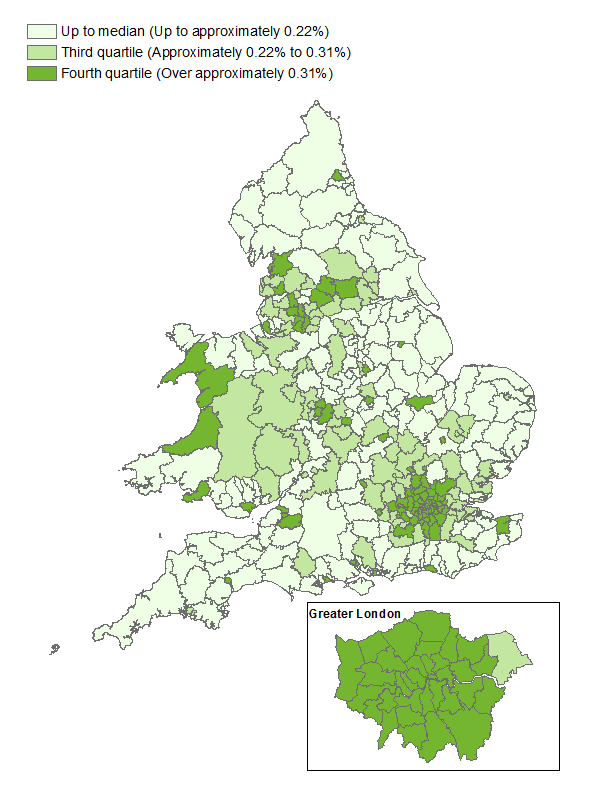
Source: Office for National Statistics Contains OS data © Crown copyright 2015
Notes:
SPD - Statistical Population Dataset.
PR – NHS Patient Register.
CIS – Department for Work and Pensions (DWP) Customer Information System.
HESA - Higher Education Statistics Agency.
Download this image Figure 11: Additional PR, CIS and HESA matches in SPD V2.0 as a percentage of SPD V1.0, England and Wales, 2011
.png (47.0 kB) .xls (55.8 kB)
All London boroughs, apart from Havering, are in the upper quartile of the distribution of the increases, because the probabilistic matches are concentrated in this region. There are over 73,000 additional matches in London, of which over 66,000 are probabilistic.
The large impact seen in London extends to several local authorities in the South East and East regions, which immediately border London. Further from London, the probabilistic matches are much lower and the resolution of match inconsistencies provides a larger proportion of the additional records.
Wales contains almost 7,000 additional records, but less than 5,700 are probabilistic matches. The greatest impacts are seen in the university cities of Cardiff and Swansea, and the more rural areas of Ceredigion and Gwynedd. In these areas the largest settlement contains a university, whose students comprise a substantial proportion of the population. This suggests the resolution of match inconsistencies between PR, CIS and HESA is successfully placing more students into university towns and cities.
Away from London and neighbouring areas, the local authorities showing the greatest impacts include several cities with high proportions of students in the population, such as Oxford, Cambridge, Canterbury, Exeter, Bath and Lancaster. Larger cities with multiple universities such as Leicester, Leeds, Coventry, Nottingham and Manchester are also seen to be strongly impacted, although the probabilistic matches are also more likely to be concentrated in these areas.
Redistributing “half-weighted” records
The [SPD V1.0 methodology][5] used a “half-weighted” approach in circumstances where individuals had different addresses recorded on the PR and CIS. In the absence of reliable dates to indicate which of these sources had most recently been interacted with, a “half-weights” method was used to count the individual with a weight of 0.5 in both locations.
In our [first Research Outputs report][6], we presented a case study of analysis in South Bucks, which highlighted the impact that ‘half-weighted’ records can have on SPD population estimates, and how they are related to population turnover.
For SPD V2.0 we have introduced a redistribution methodology that assigns all records on the SPD to the most likely address. ”Activity” data, including DWP benefit interactions and address moves recorded on the Personal Demographic Service (PDS), form part of this redistribution methodology. For a definition of ”activity”, see section 2: Main points. More information on this is available in our accompanying [methodology report][7]. The result of this is an increase in the SPD estimates for the majority of local authorities, with the corresponding decreases being concentrated in fewer areas, as shown in Figure 12.
Figure 12: Impact of “half-weights” redistribution on local authority SPD V2.0 estimates, all persons, 2011
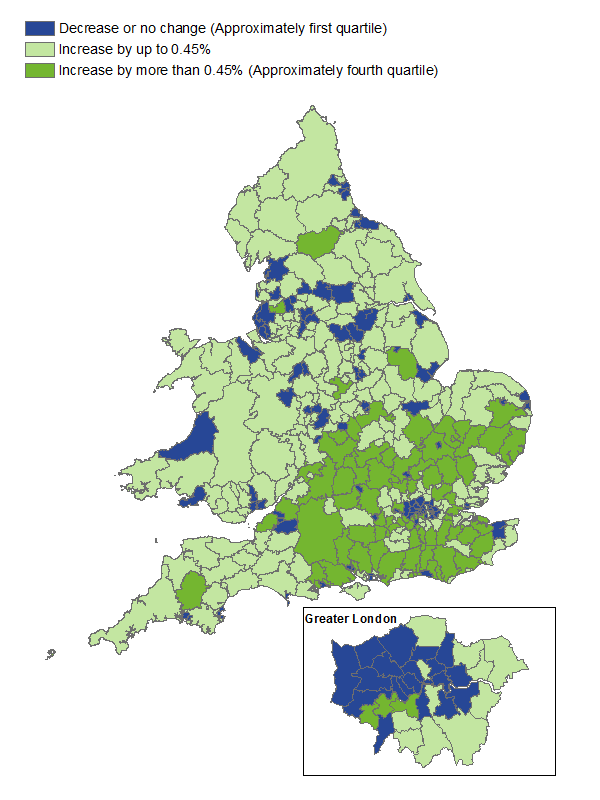
Source: Office for National Statistics Contains OS data © Crown copyright 2015
Notes:
The impact of “half-weights” redistribution is calculated using the percentage difference between the SPD V2.0 estimate before and after the redistribution.
SPD – Statistical Population Dataset.
Download this image Figure 12: Impact of “half-weights” redistribution on local authority SPD V2.0 estimates, all persons, 2011
.png (46.9 kB) .xls (49.7 kB)
The local authorities shaded green indicate the largest increases in SPD estimates as a result of the redistributions. These areas are mostly concentrated in the South East. Local authorities with a decrease in SPD estimates because of these redistributions (shaded blue), are more scattered and comprise London boroughs, seaside towns and local authorities in the North and Midlands of England.
Most of the impact of redistribution is observed in population estimates for males aged 20 to 39. In our report last year, we commented on there being fewer males aged 20 to 29 in London in SPD V1.0 than in the official estimates. This was attributed to a high rate of inward migration, with changes of address not being updated on the administrative sources. This could be due to delays in individuals registering with a general practitioner (GP) or failures to contact DWP or HM Revenue and Customs (HMRC), following moves into the area.
We see the opposite problem in London, where there were more males between the ages of 30 and 39 in SPD V1.0 than in the official estimates. It is likely that people between the ages of 30 and 39 have more of a tendency to move out of London. Therefore, rates of outward migration are not being picked up in the administrative sources.
Figures 13 and 14 show the impact of redistributing ”half-weighted” records in London. This analysis is based on a comparison of SPD V2.0 with a modified version of SPD V2.0 in which the “half-weights” methodology is still used.
Figure 13: Impact of “half-weights” redistribution on local authority SPD V2.0 estimates, males aged 20 to 29, London

Source: Office for National Statistics. Contains OS data © Crown copyright 2015
Notes:
The impact of ”half-weights” redistribution is calculated using the percentage difference between the SPD V2.0 estimate before and after the redistribution.
SPD - Statistical Population Dataset.
Download this image Figure 13: Impact of “half-weights” redistribution on local authority SPD V2.0 estimates, males aged 20 to 29, London
.png (8.8 kB) .xls (28.7 kB)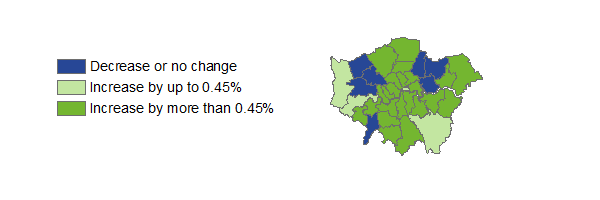
Figure 13 shows that for males aged 20 to 29, only 7 of the 33 London local authorities have a lower population estimate after the redistribution methodology is applied, with most showing a substantial increase.
Figure 14: Impact of ”half-weights” redistribution on local authority SPD V2.0 estimates, males aged 30 to 39, London

Source: Office for National Statistics. Contains OS data © Crown copyright 2015
Notes:
The impact of "half-weights" redistribution is calculated using the percentage difference between the SPD V2.0 estimate before and after the redistribution.
SPD - Statistical Population Dataset.
Download this image Figure 14: Impact of ”half-weights” redistribution on local authority SPD V2.0 estimates, males aged 30 to 39, London
.png (8.8 kB) .xls (28.2 kB)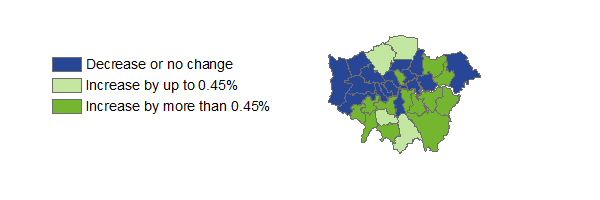
A different trend is seen for males aged 30 to 39. In this age group there is a tendency for the redistribution methodology to assign individuals to an address outside London, leading to lower estimates for 17 of the 33 London areas.
Areas with large student populations are among those that generally see decreases due to the redistribution methodology. There is high outward migration from these areas as graduates leave the area following completion of their study. In circumstances where graduates have left the area of study and not updated their address information on either the PR or the CIS, there will be a high number of “half-weighted” records in the SPD V1.0 estimates.
Figure 15 demonstrates the impact of redistributions in SPD V2.0 in local authorities with the highest proportions of students in the population aged 20 to 24.
Figure 15: Impact of “half-weight” redistribution on SPD V2.0 estimates in local authorities with large student populations, males and females aged 20 to 24, 2011
Source: Office for National Statistics
Notes:
The local authorities were selected by calculating the proportion of full-time students aged 18 to 74 in the total local authority population using 2011 Census data, and selecting those areas with the 10 highest values.
The impact of "half-weights" redistribution is calculated using the percentage difference between the SPD V2.0 estimate before and after the redistribution.
SPD – Statistical Population Dataset.
Download this chart Figure 15: Impact of “half-weight” redistribution on SPD V2.0 estimates in local authorities with large student populations, males and females aged 20 to 24, 2011
Image .csv .xlsGenerally, the SPD V2.0 methodology leads to lower estimates for 20- to 24-year-olds in areas with large student populations. This suggests that the redistribution methodology is more likely to assign graduates to an address in a local authority that is different to the area of study. The chart shows that more males than females aged 20 to 24 have been redistributed outside areas with large student populations. This is probably due to males having a tendency to stay registered with a GP after they have moved out of their area of study.
These figures also show that some local authorities with large student populations, such as Manchester, tend to increase when “half-weighted” records have been redistributed. This could be due to higher levels of inward migration for non-student populations, for example, people moving to city areas for employment.
Nôl i'r tabl cynnwys10. Researching the use of "activity" data
The Department for Work and Pensions (DWP) benefits data have been used as part of the [redistribution methodology described in section 9][1] and some initial research has been carried out into the use of income and benefits data (from DWP and HM Revenue and Customs (HMRC)) for identifying "inactive" records, for removal from the Statistical Population Dataset (SPD). The data sources used for this include the Pay As You Earn (PAYE) system, the Single Housing Benefit Extract, the National Benefits Database and Tax Credits. These data sources provide information only on those people claiming certain benefits and/or those who have income that was submitted to HMRC via the PAYE system from employments (excluding self-employments), occupational pensions or personal pensions. As such, the data sources do not have complete coverage of the usual resident population because, for example, individuals whose only source of income is from self-employment will be missing. For further information on the coverage of the data sources see the [data source overview on income and benefits][2].
When any individuals aged 16 or over who had not interacted with these systems were removed from an SPD, the SPD estimates became considerably low when compared with the official estimates as shown in Figure 16. This also shows that there are more “active” records for those aged 60 and over. This is probably because people in these age groups are claiming State Pension.
Figure 16: Difference between SPD records with "activity" and census, by age, England and Wales, 2011

Source: Office for National Statistics
Notes:
1. "Activity" can be defined as an individual interacting with an administrative system, for example, for National Insurance or tax purposes, when claiming a benefit, attending hospital or updating information on government systems in some other way. Only demographic information (such as name, date of birth and address) and dates of interaction are needed from such data sources to improve the coverage of our population estimates.
- SPD - Statistical Population Dataset.
Download this image Figure 16: Difference between SPD records with "activity" and census, by age, England and Wales, 2011
.png (48.1 kB) .xls (30.7 kB)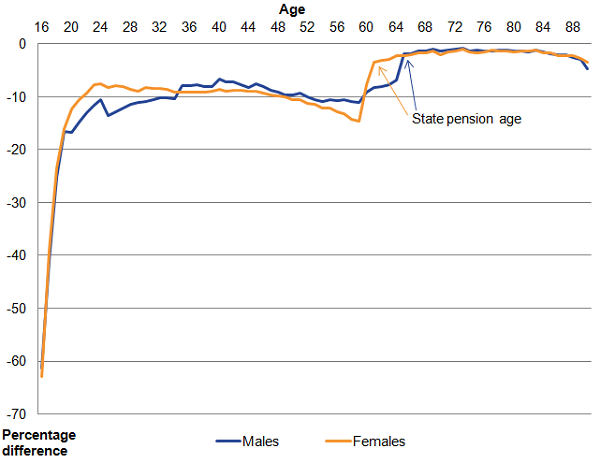
Additional sources of “activity” data are needed to produce an SPD that can better account for individuals who are usually resident but not interacting with the benefits data and PAYE system included in this analysis. We are currently working with DWP and HMRC to acquire further data for this purpose.
In addition, it is likely that a Population Coverage Survey (PCS) will be needed to collect information that can evaluate the quality of the SPD and adjust accordingly for coverage errors, such as those that occur when “inactive” records are removed.
Nôl i'r tabl cynnwys11. Performance of Statistical Population Dataset (SPD) V2.0 over time
For SPD V2.0, we produced estimates for years 2011 and 2015. The most noteworthy differences are:
in 2015, females aged 20 to 44 are higher than the official estimates (note: males aged 25 to 64 are also higher, but this does not change much in 2015 compared with 2011)
there are fewer records of children aged 0 to 9 in 2015, so the SPD estimates move further away from the official estimates in 2015, compared with 2011
there are more local authorities outside the P1 quality standards in 2015 compared with 2011
The above also occurs in SPD V1.0 estimates between 2011 and 2015, the similarities of which will also be discussed in this section.
Females aged 20 to 39 are higher than the official estimates by 2015
Over time there are greater changes to the SPD estimates for females.
Figure 17: Comparison of SPD V2.0 with 2011 Census by selected 5-year age group and sex, England and Wales, 2011
Source: Office for National Statistics
Notes:
- SPD – Statistical Population Dataset.
Download this chart Figure 17: Comparison of SPD V2.0 with 2011 Census by selected 5-year age group and sex, England and Wales, 2011
Image .csv .xls
Figure 18: Comparison of SPD V2.0 with 2015 official estimates by selected 5-year age group and sex, England and Wales, 2015
Source: Figure 18: Comparison of SPD V2.0 with 2015 official estimates by selected 5-year age group and sex, England and Wales, 2015
Notes:
- SPD – Statistical Population Dataset.
Download this chart Figure 18: Comparison of SPD V2.0 with 2015 official estimates by selected 5-year age group and sex, England and Wales, 2015
Image .csv .xlsFemales between the ages of 20 to 39 are higher in 2015 when compared with the official estimates. The same amount of increase does not occur for males aged 20 to 44. In fact, males aged 40 to 44 (the age group where the SPD is at its highest compared with official estimates) were 5.1% higher in 2011, which increased to just 5.2% in 2015. The pattern for males and females is similar in SPD V1.0 between 2011 and 2015.
The most apparent change for females in SPD V2.0 between 2011 and 2015 is for 25- to 29-year-olds. In this age group females are 1.5% lower than census in 2011, but 3.7% higher than the official estimates in 2015.
Figure 19: Comparison of change over time, SPD V2.0 and official estimates, females aged 25 to 29, 2011 to 2015
Source: Office for National Statistics
Notes:
The “Both increase” category also includes 1 local authority (Swale) where the official estimate stays the same and SPD V2.0 increases between 2011 and 2015.
SPD - Statistical Population Dataset.
Download this chart Figure 19: Comparison of change over time, SPD V2.0 and official estimates, females aged 25 to 29, 2011 to 2015
Image .csv .xlsThis shows that there are 98 local authorities where females between the ages of 25 to 29 decrease between 2011 and 2015 in the official estimate, but increase in SPD V2.0 over the same period. There are 5 local authorities where the opposite occurs (that is, the official estimate increases but SPD V2.0 decreases). There is also a similar pattern for males aged 25 to 29; however there are more local authorities where the official estimate increases and the SPD decreases.
Given the differences in the [official estimates methodology][1], it is difficult to account for the divergence between SPD V2.0 and the official estimate series. The SPD uses a stock-based approach at a particular point in time; the official estimates rely on measuring flows of the population across 4 components: fertility, mortality, internal migration and international migration. The [SPD V2.0 methodology][2] does not reflect some of the processes of the official estimates methodology, which includes student adjustments (after graduation) and estimates for migration. This may give rise to the directional differences between the 2 series.
Children aged 0 to 9 moving away from the official estimates in 2015
Between 2011 and 2015, SPD V2.0 increases by just 0.02% for children aged 0 to 4 and 0.1% for children aged 5 to 9, whereas the official estimates increase by 3.3% for children aged 0 to 4 and 12.8% for children aged 5 to 9. This means that SPD V2.0 is further from the official estimates by 2015.
Figure 20: Comparison of SPD V2.0 to 2011 Census by selected 5-year age group and sex, England and Wales, 2011
Source: Office for National Statistics
Notes:
- SPD – Statistical Population Dataset.
Download this chart Figure 20: Comparison of SPD V2.0 to 2011 Census by selected 5-year age group and sex, England and Wales, 2011
Image .csv .xls
Figure 21: Comparison of SPD V2.0 to 2015 official estimates by selected 5-year age group and sex, England and Wales, 2015
Source: Office for National Statistics
Notes:
- SPD – Statistical Population Dataset.
Download this chart Figure 21: Comparison of SPD V2.0 to 2015 official estimates by selected 5-year age group and sex, England and Wales, 2015
Image .csv .xlsThis shows that SPD V2.0 estimates for males aged 0 to 4 were 0.12% higher than census in 2011 and females aged 0 to 4 were 0.03% lower. When compared with the official estimates in 2015, males aged 0 to 4 were 0.86% lower and females aged 0 to 4 were 0.89% lower. Similarly, males aged 5 to 9 were 0.41% higher than census in 2011 and females aged 5 to 9 were 0.33% higher, which changed to 0.71% lower for males and 0.70% lower for females when compared with the official estimates in 2015.
Different components of the methodologies for the SPD and official estimate series may go some way to explaining the changes in the SPD between 2011 and 2015. The SPD methodology does not currently reflect the inclusion of birth registrations, whereas the methodology for the official estimates does. The inclusion of birth registrations will be considered for future use in the SPD methodology.
These population pyramids compare SPD V2.0 estimates with official estimates for 2011 and 2015, by single year of age and sex at local authority level
Embed code
Changes in the P1 quality standards between 2011 and 2015
In SPD V2.0 in 2011, there were 334 (96.0%) local authorities within the P1 quality standards (positive or negative 3.8% of the census estimates). This decreases to 319 (91.7%) local authorities in 2015 when compared with the official estimates.
SPD V2.0 had 14 local authorities outside the P1 quality standards in 2011, compared with 29 local authorities in 2015. There are also more local authorities that are higher in SPD V2.0 in 2015 than in 2011. Figure 22 shows local authority moves into and out of the P1 quality standards between 2011 and 2015 for SPD V2.0.
Figure 22: Change in performance of SPD V2.0 over time against P1 quality standards, 2011 to 2015

Source: Office for National Statistics
Notes:
Selected local authorities where SPD V2.0 has increased between 2011 and 2015.
The P1 quality standard is the maximum quality standard set out for in the evaluation criteria of the Beyond 2011 programme. This is equivalent to the maximum quality achieved in the current system (that is, what is achieved in a census year) every year (see Beyond 2011 Options Report 2 for more information).
At the local authority level, the P1 quality standard is to be within positive or negative 3.8% of the census estimate.
SPD - Statistical Population Dataset.
Download this image Figure 22: Change in performance of SPD V2.0 over time against P1 quality standards, 2011 to 2015
.png (86.2 kB) .xls (30.2 kB)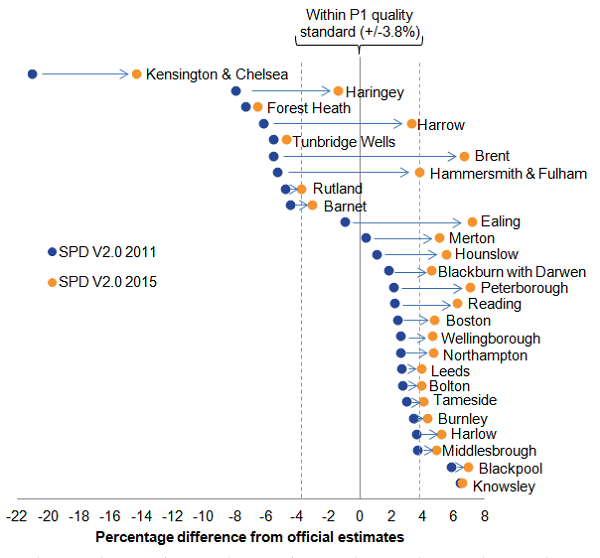
This shows that Brent moves from being below the P1 quality standard in 2011 to above it in 2015, and the same happens for City of London in the opposite direction. Kensington and Chelsea, Forest Heath, and Tunbridge Wells move closer to the P1 quality standards in 2015, whereas Blackpool, Knowsley, Camden and Westminster move further away.
In total, 19 local authorities moved from being within the P1 quality standards in 2011 to outside of them in 2015. However, as the SPD and official estimate series move further into the intercensal period, they are expected to differ. Official estimates rely on measuring flows of the population, whereas the SPDs rely on stocks of administrative data. One of the challenges of producing official estimates in the intercensal period is estimating migration, which means that there is a reduction in the accuracy of estimating the population. This may explain why there are differences in the performance of the official estimate series and the SPDs between 2011 and 2015.
Nôl i'r tabl cynnwys12. Summary and next steps
The Statistical Population Dataset (SPD) V2.0 methodology has generally improved SPD estimates for the majority of age-sex groups, both nationally and at local level. Most improvements are observed among the population estimates for 5- to 14-year-olds and females, particularly in the London area.
The use of “activity” data in SPD development has so far been restricted to determining the most likely address of individuals with conflicting address information on the SPD. For definition of “activity”, see section 2: Main points. In future years we will seek to use ”activity” data to help remove individuals from the SPD if there is no evidence they are still part of the usually resident population, or to include individuals who are resident but not registered on multiple administrative sources. To do this effectively we continue to seek access to a range of additional data sources, including more complete information on income and benefits, primary and secondary health data, and education data, and other potential sources. We anticipate that these additional sources of ”activity” will improve the coverage of the SPD for estimating the size of the population and its characteristics.
It is likely that a Population Coverage Survey (PCS) will be needed to collect information that can evaluate the quality of the SPD and adjust accordingly for coverage errors. Over the next year we will be testing the methodology for producing SPD estimates by simulating coverage surveys from the 2011 Census. We are also considering a test of the PCS in 2018 to help provide evidence about whether mandatory surveys are required. We will use data collected through this exercise, data collected in the 2017 Census test and existing survey data to demonstrate how administrative and survey data can be combined to produce high-quality estimates about the size (and characteristics) of the population.
This year we have started to develop a framework for evaluating the quality of SPD estimates, which is independent of official estimates. This will become increasingly important towards the end of the decade, when we anticipate that SPD and official estimates will have larger differences which are difficult to interpret, given the methodological differences and uncertainty in the quality comparisons.
Nôl i'r tabl cynnwys