1. Disclaimer
These Research Outputs are not official statistics. Rather they are published as outputs from research into an Administrative Data Census approach. These outputs must not be reproduced without this disclaimer and warning note and should not be used for policy- or decision-making.
Nôl i'r tabl cynnwys2. New approach to estimating internal migration using administrative data
The Administrative Data Census (ADC) Project is working to assess whether the government-stated ambition that "censuses after 2021 will be conducted using other sources of data" can be met. We're aiming to produce population estimates, household estimates and population and housing characteristics using a combination of administrative and survey data. This is to meet demands for improved population statistics and as a possible alternative to the census.
This early research is a first step to demonstrate the potential of estimating internal migration using linked administrative data. This builds on our previous publication, which gave an update on our progress towards producing estimates of the size of the population using Statistical Population Datasets (SPDs1).
This research investigates whether we can generate realistic patterns of internal migration using new data and a simple methodology. Internal migration is a challenging component of population change to estimate as there is no specific data source within England and Wales dedicated to recording movements of the population. Therefore, our findings will contribute to wider research into how we may produce population statistics using administrative data in the future. The methodology used also has the potential to produce estimates for smaller geographical areas, produce multivariate outputs and allow for longitudinal analysis.
Using two consecutive years of SPD V2.0 (2015 and 2016), we've identified usual residents who moved from one local authority to another within England and Wales, between mid-2015 and mid-2016. These SPD-derived internal migration estimates are analysed by age and sex and at local authority level. Unlike the official estimates, the SPD-derived figures reflect transitions-based flows, which only refer to a change in local authority between the start and end of a year. For a more detailed definition, see Section 4.
Although the SPD-derived estimates are based on a different definition to the official internal migration estimates, we have made comparisons to understand how realistic the patterns of SPD-derived estimates are. Only the official statistics should be used when making inferences about internal migration. The analysis described in this report is solely for research purposes.
We're keen to understand how well these transitions-based estimates meet user needs for internal migration statistics. In addition, we would also like your thoughts on our methodology and ideas for improvement. Please send your feedback to Admin.Data.Census.Project@ons.gov.uk.
This research finds that:
SPD-derived internal migration estimates are similar to the official estimates despite definitional differences -- this is encouraging as it demonstrates that it's feasible to produce realistic internal migration estimates alongside an Administrative Data Census by using a transitions-based approach
the total percentage of people moving local authority within England and Wales in the SPD-derived estimates is similar to the official estimates
for both males and females, the age distribution of SPD-derived internal migration estimates reflects a similar pattern to the official estimates, with more young adults moving between local authorities when compared with other ages
the geographic pattern of SPD-derived internal migration estimates is similar to that seen in the official estimates -- both show the highest net out-migration from Greater London local authorities and a pattern of higher net in-migration into coastal towns
Notes for: New approach to estimating internal migration using administrative data
- An SPD is a single, coherent dataset that forms a basis for estimating the population. It is produced by linking records across multiple administrative data sources and applying a set of inclusion and distribution rules.
3. Things you need to know about this release
The internal migration estimates in this research are based on the concept of "transitions" (see Section 4), which differs from the concept of "moves" used in the official estimates; these transitions are referred to as "Statistical Population Dataset (SPD)-derived" throughout this article.
The reference period for these SPD-derived internal migration estimates is between 1 July 2015 and 30 June 2016.
In administrative data, there is potential for time delays between events occurring (such as an address change) and the administrative record being updated -- it is possible that we have identified some moves that took place before the reference period, or missed moves that have not yet been recorded in the data.
Where moves are summarised by age, this is the individual's age as at 30 June 2016, rather than the age at the date of move, to ensure consistency with the SPD V2.0 estimates.
Cross-border flows to and from Scotland and Northern Ireland are not included in this analysis as the SPDs cover England and Wales only -- where we have compared SPD-derived internal migration with the official estimates, the cross-border flows have been excluded.
The SPD-derived internal migration estimates don't include the armed forces population (and some of their dependents), however, they are represented in the official internal migration estimates.
Throughout, internal migration estimates have been calculated as a proportion of the 2015 SPD V2.0 population or the official population estimates for 2015 -- armed forces personnel are included in both denominators.
4. How have we derived internal migration?
The data in this analysis are based on an estimated population derived from linking administrative data sources to form a Statistical Population Dataset (SPD). An SPD is a single, coherent dataset that forms the basis for estimating the population. It is produced by applying a set of inclusion and distribution rules to a "statistical spine", which links all administrative records from four datasets:
NHS Patient Register (PR)
Department for Work and Pensions' Customer Information System
Higher Education Statistics Agency (HESA)
School Census data
All records on the statistical spine are given a unique identifier to enable linkage of individuals across datasets and over time. A detailed description of the statistical spine and SPD V2.0 methodology is available.
For this research, records on SPD V2.0 2015 and SPD V2.0 2016 were linked using the unique identifier from the statistical spine. To ensure that a local authority could be identified for each individual at both the start and end of the reference year, records that didn't link on both SPDs were discarded and not used in this analysis. We then established cases where the local authority of usual residence was different between mid-2015 and mid-2016 to identify where an individual had moved and kept only these records for the analysis. This is illustrated in Figure 1.
Figure 1: Methodology used to produce SPD-derived internal migration estimates
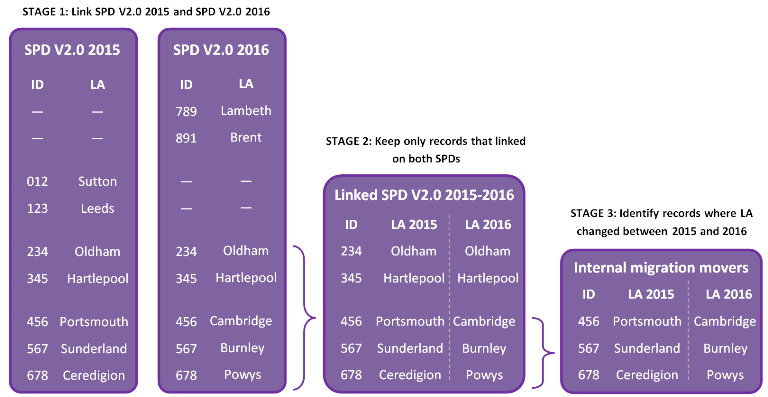
Source: Office for National Statistics
Notes:
- SPD – Statistical Population Dataset.
- ID – unique identifier from the statistical spine.
- LA – local authority.
- The above example is illustrative only and doesn't relate to real records.
Download this image Figure 1: Methodology used to produce SPD-derived internal migration estimates
.png (74.2 kB)
The internal migration estimates in this research are based on the concept of "transitions". Transitions refer to a change in local authority between the start and end of a year and don't include within-year address changes. Conceptually, this would produce lower internal migration estimates than the concept of "moves" used in the official estimates, where local authority changes within the year are identified.
To give an example, suppose an individual lived in Cambridge at the end of July 2015, moved to Oxford in September 2015 and then moved to Southampton before June 2016. Their transition identified in the SPD-derived estimates would be Cambridge to Southampton. The official estimates would reflect the moves from Cambridge to Oxford and from Oxford to Southampton.
In addition to this example, there are other scenarios that are reflected in the moves-based official estimates, which would not be captured using this initial SPD-derived transitions-based approach. These include:
individuals born after July 2015 (so not in SPD V2.0 2015) who then moved before June 2016
individuals who immigrated after July 2015 (so not in SPD V2.0 2015) who then moved before June 2016
individuals who moved after July 2015 who then died before June 2016 (so not in SPD V2.0 2016)
individuals who moved after July 2015 who then emigrated before June 2016 (so not in SPD V2.0 2016)
The official estimates are produced using a more complex methodology than described in this research. There are also differences between the administrative data sources used to produce the official estimates (the PR, the National Health Service Central Register and HESA) and those used to create the SPDs. Due to how the data sources are combined in the SPDs, and the method used to assign a local authority of usual residence, identifying within-year moves (such as those described previously) would be more challenging with the data sources that are currently available to us in the context of this simple methodology.
Although we may be able to derive moves in the future, we're keen to understand how well these transitions-based estimates meet user needs for internal migration statistics. Please send your feedback to Admin.Data.Census.Project@ons.gov.uk.
For ease of understanding, we'll refer to the transitions-based internal migration estimates produced using this methodology as "SPD-derived".
Nôl i'r tabl cynnwys5. What do our outputs show?
This research aims to capture transitions only, whereas the official estimates are based on the concept of moves. Overall, approximately one-fifth of the flows within the official internal migration estimates relate to non-transitions-based moves (see Section 4). As transitions are based on a narrower concept than moves, we expected the Statistical Population Dataset (SPD)-derived internal migration estimates to be lower than the official estimates. However, despite this, our results are largely similar.
In addition to the definitional differences, there may be other methodological reasons why the results are largely similar and not as we would expect. For example, compared with the official estimates, the SPD-based methodology incorporates more datasets, such as the Department for Work and Pensions' Customer Information System and School Census data. The inclusion of these datasets could contribute to identifying additional, genuine transitions. Conversely, if an individual's address differs between the datasets used in the SPDs, the method used to resolve this could result in moves being identified incorrectly ("spurious" moves).
In this analysis, the SPD-derived internal migration estimates are shown as a proportion of the 2015 SPD V2.0 population estimates. Similarly, the official internal migration estimates are calculated as a proportion of the official population estimates for 2015. This is to ensure that differences in internal migration estimates that arise as a result of the different population sizes are accounted for.
Early analysis has shown similar patterns of internal migration for the 2013 to 2014 and 2014 to 2015 SPD-derived estimates; however, the focus of this report will be on internal migration patterns between 2015 and 2016.
Internal migration at national level
In the year between July 2015 and June 2016, despite definitional differences, both the SPD-derived estimates and the official internal migration estimates show that approximately 5% of the population moved local authority in England and Wales. Although the SPD-derived estimate is similar to the official estimate, this is contrary to our expectation that it would be lower.
Slightly more males moved local authority in England and Wales than females. Of all internal migrants in the SPD-derived estimates, 52% were male and 48% were female. Conversely, in the official estimates, slightly fewer moves were made by males than by females, with 48% of moves being accounted for by males and 52% by females.
Age distribution
When broken down by age, the level of internal migration in the SPD-derived estimates varies across the age distribution for both males and females.
The pattern seen in the SPD-derived estimates across the age distribution for both sexes is similar to the official estimates. In general, young adults moved more than the older ages, with the peak age at which individuals moved local authority being 19 years at the end of June 2016. This is consistent with when most students leave home to study at university. The smaller peak at 22 years could be showing the migration that typically takes place after graduates finish their studies.
When broken down by sex, the pattern of SPD-derived female movers closely follows the official estimates across most of the age distribution, despite the differences in the definitions (Figure 2). There are notable differences at ages 20 and 21 years, where the percentage of SPD-derived females moving local authority was lower than the official estimates. Conversely, at ages 22 and 23 years, the results show that a higher percentage of females changed local authority between mid-2015 and mid-2016, compared with the official estimates.
Figure 2: SPD-derived female internal migration estimates by age compared with the official estimates, England and Wales
July 2015 to June 2016
Source: Office for National Statistics
Notes:
- These Research Outputs are not official statistics on internal migration.
- SPD – Statistical Population Dataset.
- SPD-derived internal migration estimates are based on the concept of “transitions”. Transitions refer to a change in local authority between the start and end of a year and don’t include within-year address changes or moves of individuals not present in the SPD at the start or end of the reference period. This differs from the concept of “moves” used in the official estimates.
- Internal migration estimates are shown as a percentage of the female SPD V2.0 population or the official population estimates, by age.
Download this chart Figure 2: SPD-derived female internal migration estimates by age compared with the official estimates, England and Wales
Image .csv .xlsThe overall pattern of SPD-derived male movers is similar to the official estimates across most of the age distribution, despite the differences in the definitions (Figure 3). Although the pattern is similar, there are some differences that are more notable for males than for females. For example, higher percentages of males aged 15 to 72 years moved local authority in the SPD-derived estimates, when compared with the official estimates. This was most prominent between ages 22 and 37 years, with the difference reducing as the ages increase. The SPD-derived estimates for male movers aged 20 and 21 years were closer to the official estimates than for females at these ages.
Figure 3: SPD-derived male internal migration estimates by age compared with the official estimates, England and Wales
July 2015 to June 2016
Source: Office for National Statistics
Notes:
- These Research Outputs are not official statistics on internal migration.
- SPD – Statistical Population Dataset.
- SPD-derived internal migration estimates are based on the concept of “transitions”. Transitions refer to a change in local authority between the start and end of a year and don’t include within-year address changes or moves of individuals not present in the SPD at the start or end of the reference period. This differs from the concept of “moves” used in the official estimates.
- Internal migration estimates are shown as a percentage of the male SPD V2.0 population or the official population estimates, by age.
Download this chart Figure 3: SPD-derived male internal migration estimates by age compared with the official estimates, England and Wales
Image .csv .xlsThese findings across the age distribution for both males and females are contrary to our expectation that the transitions-based SPD-derived estimates would be lower than the moves-based official estimates.
Sex ratio
We've used the sex ratio to examine how the relationship between male and female internal migration changes across the ages.
The sex ratio shows the number of male movers for every 100 female movers by single year of age. When the sex ratio is 100, there are an equal number of male and female movers at that age. Where a sex ratio exceeds 100, there are more male movers than females. Conversely, a sex ratio below 100 indicates more female movers than males. A comparison between the sex ratio of movers in the SPD-derived and official internal migration estimates can be seen in Figure 4.
The SPD-derived sex ratio shows that between the ages of 1 and 15 years, there were a similar number of males and females changing local authority, with slightly more males moving for every 100 females. This reflects the sex ratio of the population at those ages, which in turn comes from the sex ratio at birth.
From ages 16 to 27 years, fewer males moved for every 100 females in the SPD-derived estimates, although the sex ratio varies between these ages. The magnitude of this change is small. However, this contains the population where migration is generally high for both sexes (Figures 2 and 3).
After exceeding 100 at the age of 28 years, the SPD-derived sex ratio continues to increase considerably before reaching its highest point at age 44 years. Typically, across these ages, overall migration is lower and moves are more male dominated. Therefore, male migration often has a greater impact on the sex ratio at these ages. Our findings reflect this, as shown in Figure 4. From age 44 years, there is a general decline in the sex ratio.
This pattern of the sex ratio for the SPD-derived moves is broadly similar to that seen in the official internal migration estimates across all ages. Up to age 14 years, and after age 79 years, the SPD-derived sex ratios are very similar to the official estimates. There is a notable disparity between the ages of 23 and 70 years, with the largest difference seen for those in their late 30s.
Figure 4: Sex ratio of SPD-derived movers by age compared with the official estimates, England and Wales
July 2015 to June 2016
Source: Office for National Statistics
Notes:
- These Research Outputs are not official statistics on internal migration.
- The sex ratio is the number of males per 100 females in the internal migration estimates.
- SPD – Statistical Population Dataset.
- SPD-derived internal migration estimates are based on the concept of “transitions”. Transitions refer to a change in local authority between the start and end of a year and don’t include within-year address changes or moves of individuals not present in the SPD at the start or end of the reference period. This differs from the concept of “moves” used in the official estimates.
Download this chart Figure 4: Sex ratio of SPD-derived movers by age compared with the official estimates, England and Wales
Image .csv .xlsInternal migration at local authority level
The following section considers SPD-derived internal migration at local authority level. This includes analysis of inflows, outflows and the overall net migration (inflows minus outflows). When an equal number of individuals move into and out of a local authority, the net migration for that area is zero.
Around two-thirds of the 348 local authorities in England and Wales had more people move in (net in-migration) than out (net out-migration) between July 2015 and June 2016. Of these local authorities, a number of those with the largest net in-migration were coastal towns. This is consistent with the official estimates.
To explore the outflows, inflows and net flows per 1,000 people in the population for each local authority, see the interactive map in Figure 5.
Figure 5: SPD-derived net internal migration per 1,000 people in the SPD V2.0 2015 population by local authority, England and Wales
July 2015 to June 2016
Embed code
Source: Office for National Statistics
Notes:
These Research Outputs are not official statistics on internal migration.
SPD – Statistical Population Dataset.
SPD-derived internal migration estimates are based on the concept of “transitions”. Transitions refer to a change in local authority between the start and end of a year and don’t include within-year address changes or moves of individuals not present in the SPD at the start or end of the reference period. This differs from the concept of “moves” used in the official estimates.
In the SPD-derived estimates, there was a notable pattern of net outflows from local authorities in the Greater London area, with 31 of 33 displaying net out-migration. This is consistent with our finding that four of the top five local authorities in England and Wales with the largest net out-migration rates were Greater London based. These were Westminster, Kensington and Chelsea, Newham and Brent. Despite the large overall net out-migration, Greater London local authorities also had large inflows. This results in high population churn.
This SPD-derived geographic pattern is similar to that seen in the [official estimates][2]. For approximately 9 out of every 10 local authorities, the net internal migration in the SPD-derived and official estimates was in the same direction. This means that local authorities that had net in-migration in the SPD-derived estimates also had net in-migration in the official estimates, and the other way around. Similarly, local authorities that had a net out-migration in the SPD-derived estimates also had net out-migration in the official estimates.
Figure 6: Local authority net internal migration for SPD-derived and official estimates, England and Wales
July 2015 to June 2016
Embed code
Source: Office for National Statistics
Notes:
These Research Outputs are not official statistics on internal migration.
SPD – Statistical Population Dataset.
SPD-derived internal migration estimates are based on the concept of “transitions”. Transitions refer to a change in local authority between the start and end of a year and don’t include within-year address changes or moves of individuals not present in the SPD at the start or end of the reference period. This differs from the concept of “moves” used in the official estimates.
Net internal migration flows are shown as a percentage of the SPD V2.0 population or the official population estimates, by local authority.
To zoom in, draw a box around the area of the chart you're interested in. Double click to zoom back out.
The local authorities with a different direction in the SPD-derived and official net migration estimates don’t appear to be related geographically.
Nôl i'r tabl cynnwys6. Conclusions and next steps
This research demonstrates the potential of producing internal migration estimates as part of an administrative data-based approach to producing population statistics. We've used a simple methodology based upon Statistical Population Datasets (SPDs), which has not been produced by Office for National Statistics (ONS) before. This methodology has the potential to produce estimates at smaller geographical area than local authority level and produce multivariate analysis in the future.
Although not included in this research, it could be possible to incorporate cross-border flows to and from Scotland and Northern Ireland using the same methods as the official estimates in the future. Aggregate cross-border flows to and from Scotland and Northern Ireland are available as part of the official internal migration estimates.
When compared with the official estimates, we achieve similar results using this simple methodology despite the differences in definitions. In addition to the definitional differences, this may also be due to the incorporation of more datasets in the SPD-based methodology and "spurious" transitions, which can occur as a result of the method used to resolve conflicting addresses between the linked datasets in the SPD.
Future research could provide further insight into how each of these individual datasets uniquely contribute to the internal migration estimates presented, in addition to their combined effect as described using the SPD-methodology in this Research Output.
We're conducting more research to produce administrative data-based population estimates and population characteristics. This includes our investigations into the potential for a flows-based approach for producing population estimates to derive components of population change (births, deaths and migration flows). This approach is different to the current SPD method in that it attempts to use the components of population change (flows) to continuously update the usually resident population rather than producing an independent stock estimate of the population each year.
The findings from this Internal Migration Research Output, and any feedback you may have, will contribute to this wider research into how we may produce population statistics using administrative data in the future. For further information on our overall aims, see our annual assessment.
Nôl i'r tabl cynnwys7. Feedback
We're keen to get feedback on these Research Outputs and the methodology used to produce them, including any local area insights you may have into the estimates we've produced. We're particularly keen to understand how well these transitions-based estimates meet user needs for internal migration statistics. Please email your feedback to Admin.Data.Census.Project@ons.gov.uk. Please include the title of the output in your response.
Nôl i'r tabl cynnwys