1. Disclaimer
These Research Outputs are not official statistics. Rather they are published as outputs from research into an Administrative Data Census approach. These outputs must not be reproduced without this disclaimer and warning note and should not be used for policy- or decision-making.
Nôl i'r tabl cynnwys2. New analysis using administrative data
Ethnicity data are a high priority topic for users of census statistics. However, ethnicity is not widely collected on administrative data and access to such data is currently limited for us. Ethnicity is one topic within an Administrative Data Census that is likely to require a combination of administrative and survey data to produce robust outputs that meet user’s needs.
The analysis investigates the ability to produce estimates of ethnicity in an Administrative Data Census context. The approach uses the Generalised Structure Preserving Estimator (GSPREE) method to combine currently available data sources to produce estimates of six ethnic groups at local authority level. This is a potential solution for producing outputs on topics where administrative data need to be supplemented by surveys. This article applies the GSPREE model to 2011 data so that we can see how well the method performs by comparing results with the 2011 Census. This analysis is currently limited to England due to data availability.
The analysis found that using currently available data, the modelling approach works well for larger ethnic groups, in particular for quantifying the “White” population. For smaller ethnic groups such as “Chinese” and “Other”, the results were weaker. The approach shows promise for producing estimates of ethnic group size using survey and administrative data; however, results could be improved through more robust input data. This would particularly benefit the estimation of smaller ethnic groups.
Future work will use the GSPREE approach to produce ethnicity estimates for 2015. These outputs will use the administrative data population base produced using the Statistical Population Dataset (SPD) V2.0 methodology.
Nôl i'r tabl cynnwys3. Things you need to know about this release
These Research Outputs are not official statistics – they are published to demonstrate the type of analysis possible using administrative data.
The analysis is for England only and the datasets used are the Annual Population Survey, English School Census, 2001 Census and 2011 Census.
This article is for 2011 to allow for comparisons with 2011 Census.
In addition to this release we have published a research report on population estimates by characteristics, which describe an alternative approach. Our population estimates by ethnic group note explains how the two projects are related.
4. Background to ethnicity data
Ethnicity outputs are a high-priority topic as they are a crucial component of understanding populations and are used by a wide range of stakeholders. Uses for the data include resource allocation by central and local governments, policy development, and assisting organisations in ensuring that they monitor and meet their statutory obligations under the Equality Act 2010.
The need for these data was highlighted during the 2021 Census topic consultation. Among a number of responses from stakeholders, the Royal Borough of Kingston upon Thames noted that:
“The majority of our budget requires some consideration of its impact on minority groups. As an example, we are beginning the process of Outcome Based Budgeting from 2016 and 2017 as we analyse which non-essential services we can afford to maintain. Equality Impact Assessments will be done to measure the impact on minority groups if a service is to be removed. If we did not have information on ethnicity this would be virtually impossible and could result in negative (potentially discriminatory) outcomes.”
Estimates on ethnicity are largely based on the census as the best available source. Census data are collected on a decennial basis, giving a large and detailed sample even for small geographic areas in census years. The high-level detail of ethnicity data provided by the census is important to groups such as local councils, as demographic profiles vary significantly across the country.
Between census years however, robust estimates for ethnicity are more challenging to create. Estimates can be based on survey data; however, surveys are conducted at a significantly smaller scale than the census, making it difficult to achieve robust results at similarly small geographic levels. This is particularly notable when identifying hard-to-reach, socially-excluded or minority groups. Survey data at lower geographical levels are often therefore not fit for purpose for end users, leading to continued use of census data long after the census date.
Given survey data limitations, we are looking at the ability of administrative data to assist in the production of ethnicity statistics. Alternative methods for producing ethnicity data would be necessary both for estimates between census years and in the delivery of an Administrative Data Census. While currently available sources are not individually sufficient to produce reliable estimates for the whole of England, data could be combined to produce reliable estimates.
What data are currently available?
Administrative data are collected for operational purposes. Our initial research finds that ethnicity information is not widely collected on these sources and the statistical quality, for the purpose of producing estimates, varies. Data sources include:
the 2001 and 2011 Censuses – these provide large scale data on ethnicity down to small geographical areas, however, it is only collected every 10 years
the English School Census – this collects high-quality information on ethnicity of school age children annually, with less than 1% missing data
the Annual Population Survey, which provides data at local authority level
Data limitations
English School Census data cover school age children, however, omit children at independent schools, home schooling or those educated other than at school.
Annual Population Survey (APS) data are collected from a much smaller sample than the census (approximately 250,000 respondents). The number of individuals sampled within detailed geographical areas and population sub-groups is therefore comparatively limited. The UK has an uneven distribution of population by ethnic group, with an overall majority white population, while also having small clusters of non-white groups living within small geographic areas.
This uneven distribution can cause problems when estimating non-white groups from survey samples in some geographic areas. Typically, survey data are broadly representative at national or regional level, but are comparatively weaker for small areas or for smaller ethnic groups.
Factors that may influence the estimation of ethnicity from the APS rather than the census include:
APS data are collected across the period of a year, compared with a single reference date for the census
the census relies on self-completion of questionnaires, compared with an interviewer-led survey used for the APS
the APS is collected at a household level and a clustering of ethnicities within households can influence the estimates
APS data do not include communal establishments, whereas these are represented within census data
These and other factors are likely to result in discrepancies between the two data sources.
Nôl i'r tabl cynnwys5. How does the Generalised Structure Preserving Estimator work?
Given the current availability of data and the limitations described, we are investigating the use of the Generalised Structure Preserving Estimator (GSPREE) for the production of ethnicity estimates. A previous methodological paper contains further details on the approach, using GSPREE to produce estimates of ethnicity for March 2011 and June 2014.
The GSPREE method uses small area estimation (SAE) techniques to combine and draw strength from a number of different data sources. Most traditional SAE methods use data that can act as a predictor to improve survey estimates. This can be useful for topics such as employment status, in which factors such as age, level of education and benefit claimant counts can be useful indicators.
However, finding predictors of ethnicity is more challenging, so as an alternative we are exploring the use of the GSPREE method with proxy data sources such as the 2001 Census and the 2011 English School Census. A proxy data source contains information for the same set of areas and categories of the target table, but it could be a previous measurement of the same characteristic or have a slightly different definition.
SAE and GSPREE are particularly useful when sample counts are too small or there is no sample for direct estimates, but information on similar groups is available from different sources. This is particularly useful in the case of ethnicity, in which small ethnic groups may not be captured within surveys. This means that direct estimates would not be possible or small numbers could make the resulting estimates unreliable.
In this context, recent survey estimates are combined with proxy data sources: administrative data and more detailed, but outdated population distributions from the 2001 Census. The aim is to produce more reliable and complete estimates than is possible from each source individually.
The GSPREE method benefits from its flexibility, allowing inclusion of additional sources as they become available and the exclusion of sources that have become less useful. Using this method allows administrative data to reduce reliance on the census distributions between census years and could be of particular use for an Administrative Data Census. Models are also able to quantify the contribution of individual data sources.
Current research
The current GSPREE research has produced estimates of ethnicity at local authority level for 2011. This year was chosen to allow validation of the estimates against the 2011 Census.
The model uses a combination of currently available data sources: the English School Census (ESC), Annual Population Survey (APS), 2001 and 2011 Censuses. Estimates are produced by first modelling separately for three age groups, 0 to 4 years, 5 to 15 years and 16 and over. Two models were constructed as shown in Figure 1.
Model 1 used the October 2010 to September 2011 APS and January 2011 ESC. Model 2 included the same sources as model 1, but also included the 2001 Census as a robust but outdated data source. By including the outdated census in model 2, we were able to investigate the effect of including the robust but outdated data source and whether the distributions defined by the model were significantly changed. This allowed us to test the quality of the modelled estimates and assess the effect of its inclusion on the results.
| Model | Year | Inputs | Benchmark Data |
|---|---|---|---|
| 1 | 2011 | 2010 to 2011 APS 2011 ESC | 2010 to 2011 APS – Ethnic Group 2011 Census – Population by Local Area |
| 2 | 2011 | 2010 to 2011 APS 2001 Census 2011 ESC | 2010 to 2011 APS – Ethnic Group 2011 Census – Population by Local Area |
Download this table Figure 1: Model 1 and model 2 data inputs, 2011
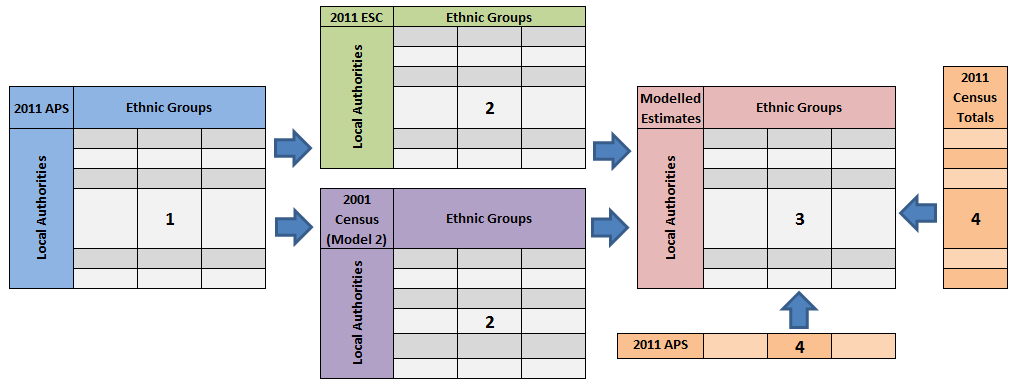
.xls .csvThe data structure used by the GSPREE models to update the tables of ethnicity by local authority is shown in Figure 2. The estimation begins in step one with survey data from the target year (in this case, 2011). This provides up-to-date estimates that are representative of the population, but lacks robust and complete detail at a small area level.
At step two the relationship between the survey data and the association structure of the proxy data source(s) is used to obtain the best estimates of the cross tabulated distributions making best use of all available data sources. The association structure is the transformation of the cross tabulation shown in the proxy data source(s), where the row and column (local authority and ethnic group) information is taken into account.
The proxy data sources provide granular detail, but don’t cover the whole population (for example, the ESC only provides ethnicity for children), or are for a different time period. From the model relationship between the survey data and the association structure, the modelled estimates are compiled in step three. Finally at step four, these estimates are adjusted with robust and recent row (2011 Census) and column (2011 APS) population estimates to produce final estimates.
Figure 2: Current GSPREE data structure for model 2, 2011
Source: Office for National Statistics
Notes:
APS- Annual Population Survey.
ESC – English School Census.
GSPREE - Generalised Structure Preserving Estimator.
Download this image Figure 2: Current GSPREE data structure for model 2, 2011
.png (26.3 kB)
6. What do the outputs show?
The results for models 1 and 2 are given in Figure 3. The results produced by the study were in some ways predictable, in other ways less so. The results are shown in Figure 3, detailing the adjustment of the association structure based on the Annual Population Survey (APS) information. An adjustment value of 1 indicates that the association structure required no adjustment (for example, the local authority estimates accurately matched the full detailed APS table). However, the further this value is from 1, the more adjustment was required compared with the other age groups in the model.
The 5 to 15 age group required the smallest adjustment to derive the result in both models. This is likely to be a result of the use of the high-quality ethnicity data provided by the English School Census (ESC) for those in school ages. In model 1, the amount of adjustment required was greatest for those aged 16 and over, as the distributions from the ESC are assumed, but are less relevant for those outside of school ages. Model 2, using the 2001 Census, updated the association structure to a smaller degree for the 16 and over age group.
Figure 3: Adjustment of association structure in models 1 and 2, 2011
Source: Office for National Statistics
Notes:
Model adjustment represents the adjustment of the association structure, based on APS data.
A model adjustment value of one indicates no adjustment.
The further the model adjustment value varies from one, the greater the adjustment.
APS – Annual Population Survey.
Download this chart Figure 3: Adjustment of association structure in models 1 and 2, 2011
Image .csv .xlsResults for how much model 2 relied on the supporting data (2011 ESC and 2001 Census) can be seen in Figure 4. Weight values closer to 1 represent heavy reliance on the 2011 ESC data, whereas the further this value is from 1, the greater the reliance on the 2001 Census data. Model 2 results show that the estimations of the 0 to 4 years and 5 to 15 years age groups were heavily reliant on the 2011 ESC. For the ages of 0 to 4 years and 5 to 15 years, the model was able to use the robust ESC data, only minimally relying on distributions from the census.
This suggests that the ESC dataset may be a suitable source to estimate ethnicity data for those aged 15 years and under for an Administrative Data Census or between census years. The 16 and over age group was slightly more reliant on the census data. Without strong ethnicity data to characterise the age 16 and over population, the Generalised Structure Preserving Estimator (GSPREE) drew more heavily from the 2001 Census data. These results could be improved through the use of an administrative data source that more accurately represents the distribution of ethnicity for adults. We are currently investigating additional administrative data sources that contain ethnicity information. For plans on Administrative Data Census data acquisition, please see the 2017 Administrative Data Census: Annual Assessment.
Figure 4: Reliance of model 2 on supporting data, 2011
Source: Office for National Statistics
Notes:
- The weight represents the data reliance of the model on the 2001 Census.
Download this chart Figure 4: Reliance of model 2 on supporting data, 2011
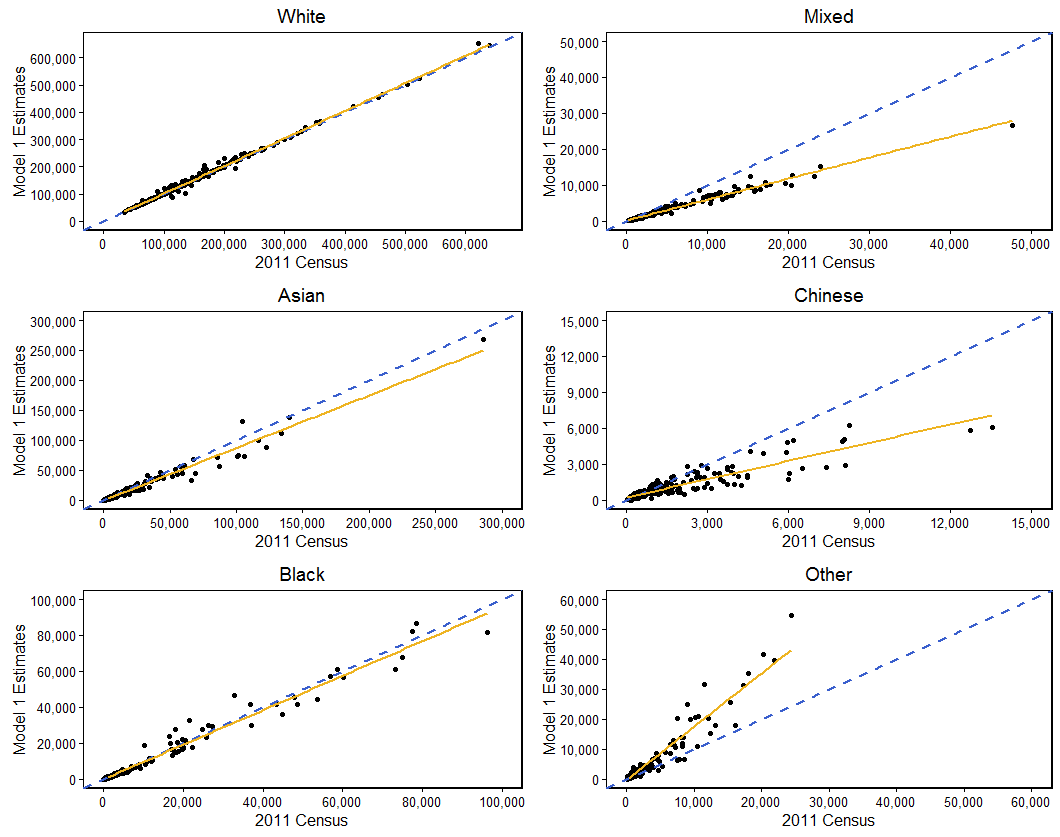
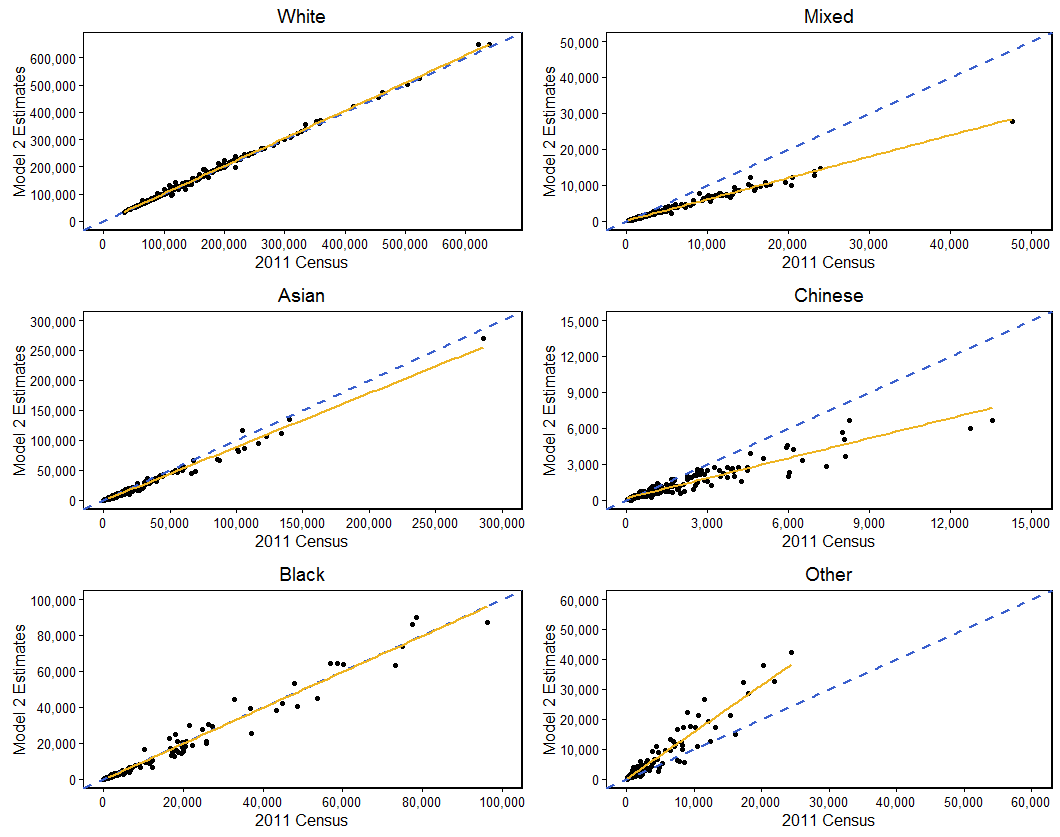
Image .csv .xlsThe results in Figures 5 and 6 show how the modelled estimates compare with the 2011 Census for models 1 and 2. In the diagrams, each point represents a local authority. The graphs compare the modelled results against the 2011 Census. The dashed blue diagonal line of Y equals X shows perfect agreement between the two. Where the gold line of best fit through the modelled estimates is the same as the Y equals X line, a perfect match has been made. If, however, the gold line falls below the Y equals X line, the model is under-estimating. Similarly, when the line is above Y equals X, the model is over-estimating.
When comparing between the 2011 modelled estimates and the 2011 Census data, both models 1 and 2 produced valid local authority distributions for some ethnic groups. The groups of “White”, “Asian” and “Black” produced results that were largely consistent with the 2011 Census in both models. However, larger differences were found in the smaller groups of “Mixed”, “Chinese” and “Other” ethnic groups. These discrepancies were likely to have resulted from using the APS data. Due to the sampling and collection methods used by the APS, smaller ethnic groups are more at risk of variability when compared with the census.
Additionally, as mentioned previously, the APS population totals for England do not match census population totals for ethnic groups that represent a smaller proportion of the population. At this level, the APS under counts “Mixed” ethnicity and over counts “Other” ethnicity compared with the 2011 Census.
As a final step, the modelled estimates were benchmarked to these population totals. To obtain a valid input to the model going forward, either the APS data would need to be optimised for the collection of ethnicity data or an alternative source of data would be required. Alternatively, collecting ethnicity data within the characteristics survey proposed for the Administrative Data Census could provide adequate data coverage for a GSPREE model.
Figure 5: GSPREE model 1 estimates (using 2011 English School Census) versus 2011 Census
Source: Office for National Statistics
Notes:
- GSPREE - Generalised Structure Preserving Estimator.
Download this image Figure 5: GSPREE model 1 estimates (using 2011 English School Census) versus 2011 Census
.png (21.9 kB)
Figure 6: GSPREE model 2 Estimates (using 2001 Census and 2011 English School Census) versus 2011 Census
Source: Office for National Statistics
Notes:
- GSPREE - Generalised Structure Preserving Estimator.
Download this image Figure 6: GSPREE model 2 Estimates (using 2001 Census and 2011 English School Census) versus 2011 Census
.png (21.9 kB)
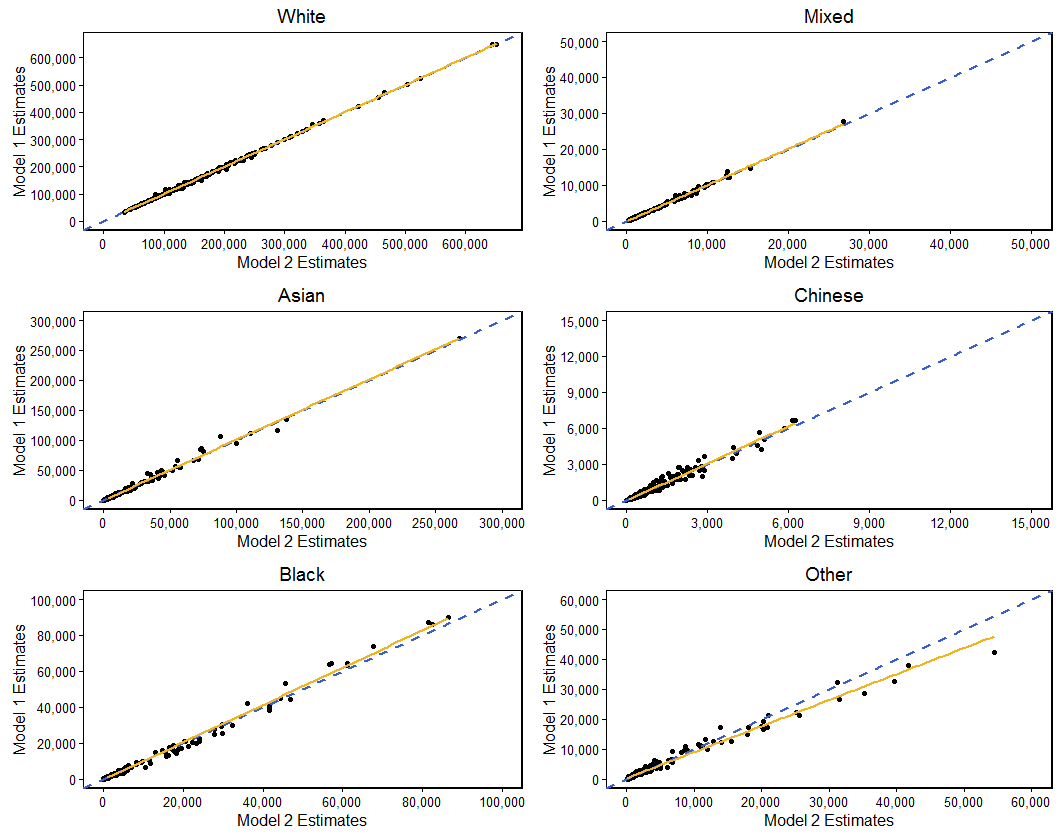
Figure 7 shows a comparison between models 1 and 2. As can be seen from Figure 7, the models produce broadly similar results, particularly so for ethnic groups with larger populations. This suggests that the inclusion of the outdated 2001 Census in model 2 is only having a small effect on the results produced.
For further information regarding the error of the models, see the previous investigation into the GSPREE methodology (pages 34 to 35). We are additionally working on producing estimates of uncertainty surrounding the figures provided in this article. Overall the estimates produced between models 1 and 2 were largely similar, however, “Other” and “Chinese” ethnic groups show the greatest differences.
Figure 7: GSPREE model 1 and 2 estimates comparison, 2011
Source: Office for National Statistics
Notes:
- GSPREE - Generalised Structure Preserving Estimator.
Download this image Figure 7: GSPREE model 1 and 2 estimates comparison, 2011
.png (21.2 kB)
7. Conclusions and next steps
The Generalised Structure Preserving Estimator (GSPREE) method with the available data sources shows promise in terms of its potential to produce mid-decade local authority results when used in conjunction with outdated census data. However, more robust administrative sources would help to improve estimates for individuals above school age and in smaller ethnic groups. This is particularly the case for an Administrative Data Census (ADC) where census data would be unavailable.
The optimisation of either the Annual Population Survey or a characteristics survey to collect ethnicity data could provide a suitably accurate small area representation of ethnicity to be used with the GSPREE method. Alternatively, we could explore whether it is possible to collect ethnicity on administrative data, or where it is already collected, ensure this is done on a consistent basis. An example of this could be to improve the collection of data about ethnicity across the health service.
For the ADC team, the method has shown promise, but it is important that we work with data suppliers to identify alternative data sources. Future work will evaluate the ability of the administrative data sources to produce admin data census estimates using GSPREE, focusing on the production of estimates for mid-2015 using Statistical Population Dataset (SPD) V2.0.
Nôl i'r tabl cynnwys8. Feedback
We are keen to get feedback on these Research Outputs and the methodology used to produce them, including how they might be improved and potential uses of the data. Please email your feedback to pop.info@ons.gov.uk. Don't forget to include the title of the output in your response.
Nôl i'r tabl cynnwys