Build a custom area profile
Create your own profile for local areas with data for England and Wales
How to use the profile builder
There are two steps to build your custom area profile.
Step 1 - Select an area
There are four ways to select an area:
- Search for an area in the search box.
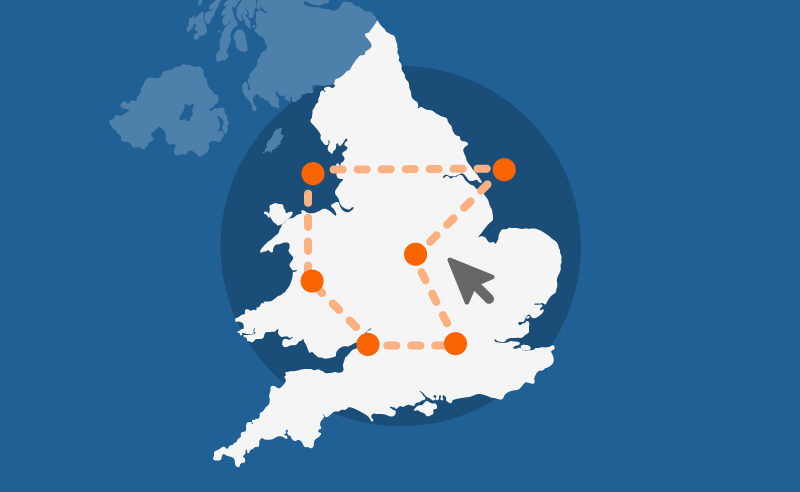
- Draw a polygon on the map.
- Draw a circle on the map.
- Upload an area boundary.
Once you have finished selecting an area, click on the “Build profile” button.
Step 2 - Build a profile
Once you have selected your area, choose which datasets you want for your profile.
The profile will be built as you choose datasets showing values for your area and a preset comparison area for context. You can change this comparison area.
You will be able to download data and charts from your profile.
Which datasets are available?
This tool includes a variety of datasets that can be aggregated from small area data at an LSOA or Output Area level.
You can find a description of all available datasets on the glossary page.
How does this tool produce these figures?
The tool takes your chosen shape and compares it to your selected datasets.
It produces a best-fit shape, which is the closest available to your chosen shape. It adds up the small area data for your best-fit shape and returns it as an estimated total.
Census 2021 topics and non-Census datasets use different small area types.
Census 2021 topics use Output Areas (OAs) whereas non-Census datasets primarily use larger Lower layer Super Output Areas (LSOAs).
We advise caution when comparing values between Census topics and non-Census datasets because these best-fit shapes will have different boundaries.
Share your feedback
We value your feedback on this service. If you would like to get in touch, please email explore.local.statistics@ons.gov.uk.