1. Main points
For the first time, this release provides detailed product by industry value estimates using Annual Purchases Survey (APS) data, as well as a comparison with first-year estimates.
Purchasing patterns of businesses have remained consistent in 2016 with 2015 across all industry groups.
This article provides a breakdown of goods, energy and services for the first time, showing that distribution, transport, hotels and restaurants purchased the most energy (16.4%) in relation to their total intermediate consumption.
The top 15 most-purchased products across all industries equal almost half (46.5%) of all products purchased.
2. Things you need to know about this release
Survey background
The primary aim of the Annual Purchases Survey (APS) is to provide a comprehensive picture of the products purchased in the production process and running of UK businesses. This level of detail is required to feed into the supply and use tables (SUTs) and ultimately the compilation of gross domestic product (GDP). The APS will help us to adhere to international best practice outlined in the European System of Accounts 2010: ESA 2010 and Balance of Payments Manual: BPM6.
The APS covers a large part of the economy with some exceptions such as public administration and certain elements of financial industries. The exact inclusions or exclusions of industries are detailed in the Quality and Methodology Information report. It is also worth noting that the 2016 APS estimates are based on Standard Industrial Classification 2007: SIC 2007.
Link to supply and use tables
From Blue Book 2019 onwards, the APS will be the primary source for the breakdown on products purchased within industries. Additional sources will feed into this including the use of the Annual Business Survey (ABS) for the industry totals as is currently the case.
Methodological features
At present, the estimates produced from the APS are still regarded as experimental. This will be the case until we go through a formal assessment with the UK Statistics Authority to ensure compliance with the Code of Practice for Statistics. Alongside this release, detailed quality and methodology information is now available from the Annual Purchases Survey Quality and Methodology Information report.
Methodological changes have been made to the imputation methods used. There is now an imputation method for businesses with a unit non-response (when a business does not respond at all). Details on this imputation method can be found within the Quality and Methodology Information report.
This year is the first year that product values will be released alongside the publication. These values will be constrained to the Annual Business Survey data where equivalent industries are available. Revisions have been made to the 2015 data, therefore, differences in proportions can be seen when comparing to the previous release.
We are keen to seek views and would welcome your feedback on the contents of this report. If you have any comments, please email purchases.survey@ons.gov.uk.
Nôl i'r tabl cynnwys3. What is the overall picture in 2016 for businesses’ purchasing patterns?
Spread of intermediate consumption
The Annual Purchases Survey (APS) collects information on businesses’ intermediate consumption, which consists of goods and services consumed as inputs by a process of production, and are either transformed or used up by the production process. It excludes fixed assets whose consumption is recorded as consumption of fixed capital.
Figure 1 shows that the spread of intermediate consumption has remained consistent between 2015 (revised estimates) and 2016. Figure 1 summarises the spread of intermediate consumption, showing how much businesses within a given industry purchase products within their own sector (for example, a business manufacturing basic metals purchasing production-related products).
Figure 1: The percentage of purchases within the same industry group is consistent year-on-year
UK, 2015 to 2016
Source: Office for National Statistics – Annual Purchases Survey
Notes:
- Within an industry group means businesses are purchasing products mapped to this group based on both the Standard Industrial Classification (SIC) and Classification of Products by Activity (CPA).
- Outside of the industry group means businesses are purchasing products not directly mapped to their industry group.
Download this chart Figure 1: The percentage of purchases within the same industry group is consistent year-on-year
Image .csv .xlsMost industry groups have a diverse range of expenditure across the product groups. Production is the least diverse industry group in terms of its purchasing patterns, as most of the products purchased are from production itself (76.9%). Construction also purchases more within its industry group, with 51.4% of its purchases within the construction industry.
Figure 2 shows the percentage of total intermediate consumption on products within each industry group. The darker the colour, the higher the percentage.
Figure 2: Most industry groups spend a higher proportion of their intermediate consumption on production, and professional and support activities
UK, 2016
Embed code
Businesses within the industry groups of production, construction, information and communication, and professional services, had their largest spend of intermediate consumption within their related products.
Production-related products was the largest intermediate consumption spend for agriculture, distribution, and government-based businesses, at 44.3%, 40.6% and 28.9% respectively. Similarly, the largest intermediate consumption spend for the finance and insurance, real estate, and other services industry groups was on products within professional and support activities (at 39.3%, 32.1% and 30.2% respectively).
A breakdown of energy, services, and goods
Figure 3 shows industry groups’ total intermediate consumption for purchases on energy, services and goods.
Distribution, transport, hotels and restaurants purchased the most energy (including water and waste services), in relation to their total intermediate consumption (16.4%), followed by production (13.2%) and agriculture (11.8%). Finance and insurance purchased the least energy in relation to their total intermediate consumption (1.5%), followed by information and communication (3.0%).
Figure 3: Most industry groups spend a higher proportion of their total intermediate consumption on services
UK, 2016
Source: Office for National Statistics – Annual Purchases Survey
Download this chart Figure 3: Most industry groups spend a higher proportion of their total intermediate consumption on services
Image .csv .xlsIn comparison, finance and insurance purchased the most services (95.5%) in relation to their total intermediate consumption, whilst production purchased the least (25.0%).
In terms of goods, production purchased the most (61.8%) in relation to their total intermediate consumption. Finance and insurance purchased the least goods (2.9%) in relation to their total intermediate consumption, followed closely by real estate (3.1%).
Nôl i'r tabl cynnwys4. How has intermediate consumption changed since 2015?
Year-on-year change
Table 1 shows the change in proportion of products within industry groups, from 2015 to 2016. Overall, there has been little change in purchasing patterns across all industry groups, remaining consistent with revised estimates of 2015.
| Products | Industry groups | |||||||||
|---|---|---|---|---|---|---|---|---|---|---|
| A | B | C | D | E | F | G | H | I | J | |
| Agriculture | 5.5 | -0.5 | 0.0 | -0.1 | 0.0 | 0.0 | 0.1 | -0.1 | 0.0 | -0.3 |
| Production | -2.0 | -0.3 | 0.4 | -1.3 | 0.6 | 1.2 | -3.5 | -0.2 | 1.6 | -2.8 |
| Construction | -1.7 | 0.0 | 0.4 | -0.1 | 0.0 | -0.6 | 4.0 | -0.2 | -0.3 | 0.1 |
| Distribution, transport, hotels and restaurants | -1.2 | -0.1 | 0.2 | -0.5 | -0.9 | -0.3 | 0.3 | 0.6 | -0.1 | 2.7 |
| Communication and information | -0.1 | 0.2 | 0.1 | 0.4 | 1.6 | 1.9 | 1.0 | -0.3 | 1.9 | 0.7 |
| Finance and insurance | 0.2 | -0.2 | 0.0 | 0.2 | -1.6 | 0.3 | -1.3 | -0.8 | -0.1 | -0.3 |
| Real estate | 0.0 | 0.0 | 0.0 | 0.0 | 0.1 | -0.3 | 2.3 | -0.3 | 0.9 | -0.7 |
| Professional and support activities | -0.9 | 0.8 | -1.4 | 1.6 | -0.1 | -1.9 | -2.7 | 1.8 | -5.1 | -0.6 |
| Government, health and education | 0.0 | 0.0 | 0.0 | 0.0 | 0.0 | -0.1 | -0.1 | -0.7 | 0.7 | 0.2 |
| Other services | 0.0 | 0.0 | 0.4 | -0.1 | 0.2 | 0.1 | -0.2 | 0.0 | 0.2 | 1.2 |
| Total | 0.0 | 0.0 | 0.0 | 0.0 | 0.0 | 0.0 | 0.0 | 0.0 | 0.0 | 0.0 |
Download this table Table 1: Change in proportion of products within industry
.xls .csvAgriculture’s intermediate consumption on agriculture-related products has changed by 5.5 percentage points, which is an actual change of £136.8 million while agriculture total intermediate consumption is £2 billion.
Within the government, health and education industry group, there was a change of 5.1 percentage points in intermediate consumption of professional services, which is a change of £3 billion. In 2016, the total intermediate consumption for government, health and education was £154 billion.
In the production and construction industry groups, the purchasing patterns have remained consistent. There was very little change of percentage points (a maximum of 0.8 percentage points for production, and 1.4 percentage points for construction), despite their total intermediate consumption increasing from £350 billion in 2015 to £360 billion in 2016 for production, and from £143 billion to £150 billion for construction.
Top 15 most-purchased products across all industries
Figure 4 shows the top 15 detailed products that were purchased across businesses in all industries in proportion to the total intermediate consumption, as gathered by the Annual Purchases Survey, comparing 2015 data and 2016 data. These top 15 products have remained the same in 2016 as in 2015, although there has been some change in their ranking.
The total of all these 15 products equals almost half (46.5%) of all products purchased across businesses.
Figure 4: The top 15 products have remained the same year on year overall, only their ranking has changed
UK, 2015 and 2016
Embed code
The greatest proportion change found within the top 15 products (Figure 4) purchased is in the manufacture of motor vehicles, trailers and semi-trailers (product 29). There has been a 7.6% (£3.5 billion) increase in the total amount spent on this product. An interesting decrease in the top 15 products purchased is in the purchases of manufacturing of coke and refined petroleum products (product 19); this has decreased by 2.6% (£1.2 billion). Details about these changes are described in this section.
Manufacturing of motor vehicles
Manufacturing of motor vehicles, trailers and semi-trailers (product 29) rose from the eleventh-highest proportion of purchased products in 2015 to the eighth-highest proportion of purchased products in 2016, from 2.4% (£45.5 billion) to 2.7% (£48.9 billion). The largest increases were noted in manufacturing of motor vehicles, trailers and semi-trailers (industry 29) and wholesale and retail trade and repair of motor vehicles and motorcycles (industry 45).
Oil prices
Manufacturing of coke and refined petroleum products (product 19) showed one of the largest decreases in the proportion of purchased products, from 4.3% (£46.1 billion) to 4.1% (£44.9 billion). This decrease is particularly noted in industry 19 (manufacture of coke and refined petroleum products) and transport industries, such as industries 49.3 to 49.5 (land transport services and transport services via pipelines, excluding rail transport) and industry 51 (air transport). This was as expected due to the oil and gas prices falling in 2016.
Nôl i'r tabl cynnwys5. Focus on on- or off-diagonal intermediate consumption
The Annual Purchases Survey (APS) collects and can produce estimates at a much more granular level than is available from other Office for National Statistics (ONS) business surveys. One of the main requirements from the APS is to feed into the supply and use tables, along other sources, to produce the expenditure tables, which detail product groups’ proportion of intermediate consumption within industry groups.
Figures 5 and 6 use the concept of on- and off-diagonal intermediate consumption. On-diagonal intermediate consumption means businesses purchasing a product mapped to the industry based on both the Standard Industrial Classification (SIC) and Classification of Products by Activity (CPA). Off-diagonal intermediate consumption refers to businesses purchasing products not directly mapped to their industry.
An example of on-diagonal intermediate consumption would be a business in water transport (industry 50) purchasing a product within water transport (CPA 50); both specifically refer to water transport (SIC and CPA 50).
While an example of off-diagonal intermediate consumption, in this context, would be a business within water transport (industry 50) purchasing a product within air transport (CPA 51). Although both industry and product are within transport, they are not in the same industry.
Using the A110 matrix table, on- and off- diagonal intermediate consumption can be identified. Figure 5 demonstrates the concept of on-diagonal and off-diagonal intermediate consumption.
Figure 5: Example matrix demonstrating on-diagonal and off-diagonal purchases

Source: Office for National Statistics
Notes:
- Due to the size of the table it is not possible to show it in its entirety within this article but it can be found in the supplementary datasets (A110 table) accompanying this release.
Download this image Figure 5: Example matrix demonstrating on-diagonal and off-diagonal purchases
.PNG (8.6 kB)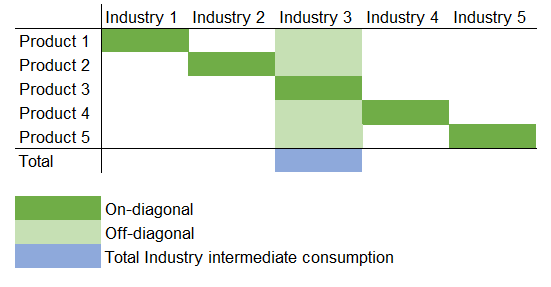
Figure 6 summarises for each industry group, the proportions of industries that purchase on- or off-diagonal products.
Figure 6: UK businesses purchase more off-diagonal products than on-diagonal
UK, 2016
Source: Office for National Statistics – Annual Purchases Survey
Download this chart Figure 6: UK businesses purchase more off-diagonal products than on-diagonal
Image .csv .xlsFigure 6 shows that overall, businesses purchased more off-diagonal products. Construction had the highest percentage (32.0%) of on-diagonal intermediate consumption and the distribution, transport, hotels and restaurants industry group had the lowest (5.0%).
Nôl i'r tabl cynnwys6. Quality and methodology
Detailed quality and methodology information is now available from the Annual Purchases Survey Quality and Methodology Information report, which contains important information on:
- the strengths and limitations of the data and how it compares with related data
- uses and users of the data
- how the output was created
- the quality of the output including the accuracy of the data
Purchases estimates are based on a sample of businesses surveyed annually. Data are collected via a paper questionnaire from a sample of approximately 31,500 businesses, covering 100 industry sectors and approximately 110 products.
Nôl i'r tabl cynnwys