1. Introduction
Reviews of concepts, methods and data sources underpinning the short-term economic indicators are vital as part of the Office for National Statistics (ONS) commitment to continuous development. This review will be undertaken for all real estate activities to gain an overview of the entire industry and has been prompted by a change to the subscription arrangement for the major source of administrative data for the Services Producer Price Indices (SPPIs) for real estate activities. Real estate is classed as division 68 under the UK Standard Industrial Classification 2007 (UK SIC 2007), and is covered by 2 SPPIs: property rentals and real estate agency fees (Table 1).
Table 1: SPPI index composition: Real Estate Activities (Section L)
| Division | Index name | SIC 2007 | 2010 Gross sector Effective Weight (%) | 1.Pricing Method | Index Methodology and coverage |
| 2.Data Collection Method | |||||
| 68 | Property Rentals | 68.2 | 3.59 | 1.Direct use of prices of repeated services | This index is constructed from the monthly Gross Income Growth Index published by IPD. The SPPI uses the 3-month average of this index and re-references the index to 2010. |
| 2.External Sources- Investment Property Databank Ltd (IPD) | |||||
| 68 | Real Estate Agencies | 68.3 | 1.62 | 1.Percentage fee method | Index is calculated using prices collected in twenty four categories: |
| 2.Survey- Stratified random sample from the IDBR plus | • London – Industrial – Selling (0.55%) | ||||
| 2.External Sources- Investment Property Databank Ltd (IPD) | • London – Industrial – Letting (0.29%) | ||||
| • London – Industrial – Acquisition (0.10%) | |||||
| • London – Office – Selling (3.79%) | |||||
| • London – Office – Letting (8.38%) | |||||
| • London – Office – Acquisition (1.64%) | |||||
| • London – Retail – Selling (1.62%) | |||||
| • London – Retail – Letting (3.05%) | |||||
| • London – Retail – Acquisition (0.20%) | |||||
| • London – Other – Selling (1.44%) | |||||
| • London – Other – Letting (2.36%) | |||||
| • London – Other – Acquisition (0.47%) | |||||
| • Rest of UK – Industrial – Selling (6.64%) | |||||
| • Rest of UK – Industrial – Letting (4.10%) | |||||
| • Rest of UK – Industrial – Acquisition (0.15%) | |||||
| • Rest of UK – Office – Selling (0.69%) | |||||
| • Rest of UK – Office – Letting (45.55%) | |||||
| • Rest of UK – Office – Acquisition (0.46%) | |||||
| • Rest of UK – Retail – Selling (1.95%) | |||||
| • Rest of UK – Retail – Letting (3.37%) | |||||
| • Rest of UK – Retail – Acquisition (0.12%) | |||||
| • Rest of UK – Other – Selling (11.81%) | |||||
| • Rest of UK – Other – Letting (0.98%) | |||||
| • Rest of UK – Other – Acquisition (0.28%) | |||||
| The index is calculated by combining the percentage fees charged by real estate agents and a price index published by IPD to generate a price movement. Fees are collected for 24 different product categories for the selling, letting and acquisition of industrial, office, retail and other real estate both in London and the Rest of the UK. |
Download this table Table 1: SPPI index composition: Real Estate Activities (Section L)
.xls (32.3 kB)Real estate activities account for 5.21% of the gross sector aggregate SPPI, of which 69% is attributed to property rentals and 31% to real estate agencies. Both division 68.20 and 68.30 use data from the Investment Property Databank (IPD).
Nôl i'r tabl cynnwys2. Current methodology
68.2 – Property rentals
The property rentals SPPI is captured directly from the Investment Property Databank (IPD) UK Monthly Property Index. The latest 3 months data are copied from the IPD UK Monthly Property Index file and imported into a custom Property Rentals Index file. The index is re-referenced to 2010=100 and then a quarterly average is taken. This quarterly average is then imputed into the SPPI system manually. This quarterly average feeds directly into the price indicator for property rentals and accounts for 69% of real estate activities (Table 1).
68.3 – Real estate agencies
The real estate agencies SPPI is calculated by combining a percentage fee charged by real estate agencies and a price index. Fees are collected via a business survey (Table 1) for 24 different categories, ranging from the selling, letting and acquisition of industrial, office, retail and other real estate for both London and the rest of the UK. The result is 240 price quotes from a variety of real estate agencies. The price index is supplied by the Investment Property Databank (IPD) through the IPD UK Monthly Property Index.
The latest IPD data is copied into a custom IPD Template file, where the data is sorted into a format suitable for import into the SPPI database and to be compiled with the surveyed monthly price quotes. After the percentage fees are applied, the 24 categories will feed into to the overall index for all real estate agencies, which accounts for 31% of real estate activities.
Nôl i'r tabl cynnwys3. Conceptual appropriateness of current data sources
The UK SPPI is an index measuring the change in price of services provided from UK businesses to other businesses in the UK. A component of this is real estate activities, which measures the price change of real estate services on a commercial level. Real estate activities is an umbrella term for all measures within division 68 of the UK SIC (2007) as shown in Table 2. The UK SPPI covers 2 of the groups, but excludes “buying and selling of own real estate” (group 68.1) on the basis that it does not contain a significant commercial element (business to business). Until a point where SPPI covers all transactions (business to all) this section will not be included within the UK SPPI. It is important to note that Investment Property Databank (IPD) samples properties held for investment purposes which is used as a proxy for commercial real estate. However, some aspects of the IPD sample have been inspected to ensure a robust data source is used for measuring price changes of real estate activities.
Table 2: UK SIC (2007): Real Estate Activities (Section L)
| UK SIC (2007) Component | UK SIC (2007) Description | |||
| Section L | ||||
| Division 68 | Real estate activities | |||
| Group 68.1 | Buying and selling of own real estate | |||
| Group 68.2 | Renting and operating of own or leased real estate | |||
| Subclass 68.21 | Renting and operating of Housing Association real estate | |||
| Subclass 68.22 | Letting and operating of conference and exhibition centres | |||
| Subclass 68.29 | Letting and operating of own or leased real estate (other than Housing Association real estate and conference and exhibition services) n.e.c. | |||
| Group 68.3 | Real estate activities on a fee or contract basis | |||
| Class 68.31 | Real estate agencies | |||
| Class 68.32 | Management of real estate on a fee or contract basis |
Download this table Table 2: UK SIC (2007): Real Estate Activities (Section L)
.xls (27.1 kB)IPD property indices collect core real estate asset information from numerous investment funds based on a single set of clear definitions designed to identify all required data items whilst excluding the overlays of fund management, allowing for a direct assessment of the underlying property market. In context of the SPPI, IPD data is used for property rentals and real estate agency fees. Specifically the index for property rentals makes use of the Gross Income Growth Index for All property. This is calculated using monthly data from property funds on the increase in the amount of gross rent passing that is received from the current tenancy agreement excluding ground rents (gross income), this is then expressed as a percentage of gross income at the beginning of the month. This can clearly be viewed as a preferable method as the index uses a direct measure for property rentals (gross rent passing) and is only manipulated by removing any other form of rents for that property (ground rents).
Gross Income Growth
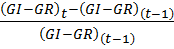
Notes:
- GIt is the gross rent passing in month t;
- GRt is the ground rent in month t;
Download this image Gross Income Growth
.png (1.3 kB)
The SPPI for real estate agencies uses 2 measures from IPD with percentage fees from surveys to estimate agency fees for the “selling and acquisitions” and “lettings” of retail, office, industrial and other property. The “selling and acquisitions” of retail, office, industrial and other property is sourced from the Capital Growth Index within IPD’s monthly property release; this is calculated by measuring the assets capital value relative to the capital employed over the analysis period, hence excluding any quality changes to the asset. The data for “lettings” of retail, office, industrial and other is sourced from the Rental Value Index; this is calculated by taking the increase in market rental value of the asset and expressing it as a percentage value at the beginning of the period. These indices require further manipulation in the form of a percentage fee based on survey data from real estate agencies before becoming the respective indices within the SPPI.
Assuming there is no problem with the survey data, then both of the IPD indices used as a proxy are sufficient in capturing significant details; for “selling and acquisitions”, the IPD index tracks capital growth of a property accounting for changes in quality; “lettings” of commercial property is proxied by market rental value – the rental income estimated to be achievable were a property or occupational unit to be newly leased, assuming a normal market lease contract.
Capital Growth Index

Notes:
- CVGt is the capital growth in month t;
- CVt is the capital value at the end of month t;
- CExpt is the total capital expenditure (includes purchases and developments) in month t;
- CRptt is the total capital receipts (includes sales) in month t;
Download this image Capital Growth Index
.png (2.8 kB)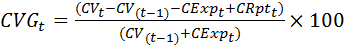
Rental Value Index
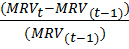
Notes:
- MRVt is the market rental value in month t;
Download this image Rental Value Index
.png (1.3 kB)
As can be seen there are 2 separate indices sourced from IPD to measure some aspect of the commercial property rental market; the reason for using the different indices covering the same type of transaction is due to how they capture specific aspects of the service that the SPPIs are trying to measure. For property rentals we are trying to measure the actual rent that corporations pay, however, when real estate agencies calculate fees they will base that on a market estimate of the rent for a property of similar specification.
As the initial decision to contribute data to an IPD index is voluntary, coverage of any markets will always be less than 100%. As of December 2013, IPD estimated that the monthly index had market coverage of 9.5% (more recent estimates cannot be obtained). IPD has minimum market coverage guidelines of 20% for an index to be published; however, exceptions are made when the national market is so large that a robust sample can be attained with less than 20% coverage. We can extrapolate from this that IPD judge the coverage to be sufficient for estimating the monthly real estate market. The properties sampled are held by investment portfolios and require revaluation on a relevant periodical basis to be included in the respective monthly, quarterly or annual index. As mentioned previously the decision to contribute to the index is voluntary, hence logically given the time and expense required to revalue properties it would be in the interest of the fund to do this less frequently and contribute to IPD on a quarterly or annual basis. The Quarterly Index as of December 2013 was estimated to have 32.2% market coverage, significant higher than the monthly index. Clearly there is a non-sampling error as a result of smaller coverage from using the monthly index.
IPD collect data from investment funds on properties held for investment purposes, hence there is a significant amount of property within the London and the South East in the sample (approximately 45% of the overall sample). The IPD Monthly Property Index has a total sample of roughly 3,500 properties with a weight composition of 39% retail, 35% office, 20% industrial and 6% other, based on their capital value share. An issue of concern is the potential bias generated from the properties being sampled from investment funds, it is reasonable to assume that these properties will be expected to have a “good return”. Hence there is a natural bias to better quality investment properties. Therefore this could result in a geographical bias towards London and the south, where property markets are lucrative. Within the composition of “other” property, there is an element of residential property which is taken from the sampled investment portfolios. Although this amount is very minimal at less than 1% (as of December 2015), it should be excluded from the index as it may possibly bias the desired measure of business to business real estate.
Rigorous index governance occurs during and long after the collection process carried out by IPD. All properties are valued according to the Royal Institute of Chartered Surveyors (RICS) guidelines. These properties are also coded against RICS guidelines, to determine their sector and geographical location. The index is subject to clearly documented rules and policies. Assets are not sampled unless the portfolios in which they are held are reported in their entirety (samples from portfolios are not accepted). IPD’s validation process checks each fund for errors; quality controls are used to corroborate this using computerised validation systems, expert scrutiny and supplier query. The methods used are reviewed by external auditors on a regular schedule. In the UK the index is reviewed by an independent body, known as the Index Consultative Group. Members are drawn from the property investment industry, major universities, research and property consultants, trade associations and investment consulting organisations. This group meet on a biannual basis.
Nôl i'r tabl cynnwys4. Quality management strategy
The UK Statistics Authority has recommended that a medium level of assurance should be taken for the administrative data sources related to the SPPI. Relating to the Quality Assurance Matrix (Annex), “A2: Enhanced assurance” requires that the statistical producer has evaluated the administrative data quality assurance arrangements and published a full description of the assurance.
For SPPI these current procedures are taken.
The required data for real estate activities is taken from the IPD UK Monthly Property Index; this is obtained from a secure reporting portal on the IPD website and downloaded in an Excel format.
For property rentals the relevant indices from IPD are manually copied across to a unique spreadsheet, the data is re-referenced to a base year of 2010 and a quarterly average is taken. After which the data is entered manually onto the SPPI system. At this stage the data is automatically aggregated and fed into the relevant index.
For real estate agency fees the relevant indices from IPD are manually copied across to a unique spreadsheet, the data is carefully categorised under “selling and acquisitions” or “lettings” for the 4 categories of property type. These columns of data are imported into SPPI systems, where they are combined with percentage fees surveyed from real estate agencies for the 24 varying indices depending on geographic location, real estate type and transaction.
As both these indices enter into the SPPI system they will be subject to computerised fixed validation gates. Should the movements be outside of these upper or lower bounds, the data entered will be corroborated through supplier query, allowing for the movements to be accepted or amended. An extra step of querying the source of survey data will be taken for real estate agency fees in order to identify the source of the movement when 2 measures are combined.
Nôl i'r tabl cynnwys5. Potential alternative data sources
Valuation Office Agency (VOA) – rateable value
Business rates are charged for the use of a building for non-domestic purposes. These rates are calculated based on the property’s “rateable value”. This “rateable value” is a reasonable estimate of your properties open market rental value. The VOA admits that this value may not be the same as your actual rent; in this sense the dataset is a best estimate of market rental value removing the bias effects of unique properties. The data set also covers the same categories of properties as required in the SPPI for real estate agency fees (retail, office, industrial and other).
However, the period for which the open market rental value is estimated is untimely and unrepresentative of the present market value. Currently all properties are valued on the same valuation date which is 2 years previous of the year of revaluation. For example the “rateable values” are revaluated every 5 years, and the valuation date is set to 1 April 2years prior (1 April 2008). This can be seen to be a highly untimely dataset that would not reflect current market conditions.
Land Registry
The Land Registry collects a substantial amount of records on property in the UK; however, this may include a large element of properties which haven’t been through the property market recently making the previous valuations from change of ownership outdated. There would be a possibility to only select the properties which have been sold recently, however, this could reduce the sample size significantly. Secondly, the data would only contain information on sales price which would require further manipulation and wouldn’t cover the measurement of property rentals.
Rightmove and Zoopla
Rightmove and Zoopla are property examples of major UK property search portals with vast databases off property prices. A vast majority of their data is for residential property; however, both contain elements of commercial property.
Rightmove supply their own house price index, however, do not supply an index for commercial property. Zoopla do provide data on commercial property prices, however, would be received in an XML format containing descriptions and details on individual properties, which would require extensive coding to extract the necessary data and manipulation to structure into the SPPI indices.
House prices as a proxy
Ideally we would use a commercial property sample, however, if the SPPI is required to change data sources for real estate activities then an option is to use a house price index as a proxy measure. As can be seen in Figure A, both indices have been re-referenced to 2010=100 for comparative purposes. We can see that both indices have followed a very similar trend since 2002, although the effect of the economic downturn weighed significantly more on the IPD Capital Growth Index for commercial property. Since 2010, both indices have followed an almost identical growth pattern. Both indices follow some aspect of the property market, hence why they depict similar trends; however, there are intrinsic differences between commercial and residential properties in their interaction with the financial market and how they are viewed and treated which lead to differences in their economic cycles (Davis & Zhu, 2004). This would imply that using a House Price Index as a proxy would be adequate but not preferable as it wouldn’t capture the seismic movements in the commercial property market after a significant market shock.
Figure A: ONS House Price Index and IPD Capital Growth comparison (2010=100)
Source: Office for National Statistics and Investment Property Databank
Download this chart Figure A: ONS House Price Index and IPD Capital Growth comparison (2010=100)
Image .csv .xls6. Conclusion
The purpose of this review was to evaluate the use of the Investment Property Databank (IPD) as a suitable data source to the SPPI for real estate activities. IPD is used to measure property rentals and real estate agency fees for commercial properties within the UK. To measure property rentals we take the Gross Income Growth Index, which is the increase in net rent from a property expressed as a percentage of net rent at the beginning of the month. On the other hand we use the Rental Value Index to combine with percentage fees from real estate agents to create the index for real estate agency fees for “lettings”. The use of different indices here is preferable as it accounts for the disparity in how prices are calculated for the 2 sectors. To measure the real estate agency fees for “sales and acquisitions” we take the data from the Capital Growth Index, which expresses the increase in capital value as a percentage of the previous period’s capital value net any capital employed over the analysis period.
IPD makes estimates of the UK commercial property market based on a sample of properties from investment portfolios; these are acquired from investment funds who voluntarily donate the portfolios in their entirety. A problem arising from this is the 45% sample bias towards London and the South East. If the indices were separated by geographic location, this would remove any bias generated from the regional disparities. Another recommendation would be to remove any residential aspect that is covered by the “other” property category.
We receive data from IPD on a monthly basis; as a result of their voluntary sample this results in an estimated market coverage of 9.5%. Noting that the SPPI is a quarterly release, switching to quarterly data feed may be preferable as the estimated market coverage increases to 32.2% as more portfolios are included. This may not have been implemented previously due to the timing of IPD’s quarterly data not aligning with our publication timings.
All things considered, IPD is a high quality data source. There is stringent index governance, requiring that properties included in the sample are valued adhering to industry standard guidelines. The computerised validation process and expert scrutiny creates a stringent quality control stage to check for errors which are queried with the respective data suppliers. The methods used by IPD are reviewed on a bi-annual basis by external auditors.
From the alternatives that have been assessed, none have been perfectly substitutable for IPD. Almost all the data sources would require further manipulation and on their own wouldn’t cover both property rentals and real estate agency fees. In a worst case scenario it has been noted that the housing market can be used as a proxy for commercial property, although significant market shocks would lead to considerable errors. It would be wise at this stage to recommend that IPD be the foreseeable data source for SPPI real estate activities. In absence of a suitable alternative and the high level of quality currently received, a change to this source would be detrimental to the SPPI.
Nôl i'r tabl cynnwys