Cynnwys
- Main points
- Statistician's comment
- Summary
- Transport, and housing and household services are the biggest drivers of consumer price movements over the long term
- Growth in the crude oil component of input Producer Price Index reflects base effects from price movements a year ago
- Annual house price growth in London has turned positive for the second time in recent months, although price growth has remained negative in outer London
- Authors
1. Main points
The 12-month growth rate of the Consumer Price Index including owner occupiers' housing costs (CPIH) was 1.4% in December 2019, down from 1.5% in November 2019.
The 12-month growth rate of the output Producer Price Index (PPI) rose to 0.9% in December 2019, while 12-month growth in input PPI also rose but remained negative with prices falling 0.1% on the year.
Transport, and housing and household services are the biggest drivers of consumer price movements since 2006.
Growth in the crude oil component of input PPI rose sharply in December 2019, largely because of a base effect.
Annual house price growth in London has turned positive for the second time in recent months, following a sustained period of negative annual growth from March 2018 to August 2019.
2. Statistician's comment
Commenting on today’s inflation figures, ONS Head of Inflation Mike Hardie said:
“Inflation eased in December as prices for hotel stays dropped. Women’s clothing prices also fell with more items being discounted.
“Annual house price growth picked up with all regions growing apart from the East of England.
“After almost two years of poor growth, London house prices appear to be showing some signs of improvement.”
Nôl i'r tabl cynnwys3. Summary
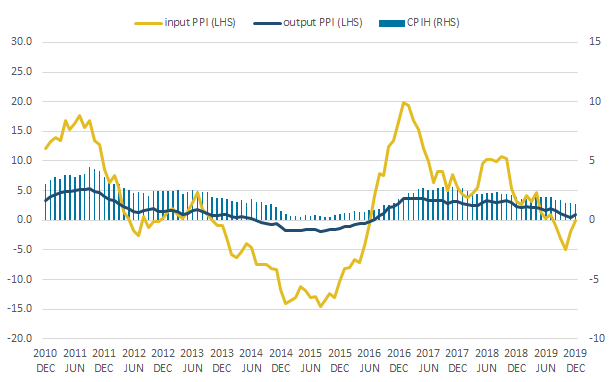
Figure 1 shows that the 12-month growth rate of the Consumer Prices Index including owner occupiers' housing costs (CPIH) was 1.4% in December 2019, down from 1.5% in November 2019. This continues a downward trend over recent months and is the lowest 12-month growth rate of CPIH since November 2016.
Large downward contributions came from restaurants and hotels, and clothing and footwear. There were further small downward contributions from food and non-alcoholic beverages, and transport. These were partially offset by upward contributions from furniture, household equipment and maintenance; communications; and miscellaneous goods and services.
The output Producer Price Index (PPI) grew by 0.9% in the 12 months to December 2019, up from 0.5% in November 2019. This is the first time that the 12-month growth rate has increased since July 2019. Nine out of ten product groups provided upward contributions to the annual rate of output inflation, with chemicals and pharmaceuticals being the only group providing a downward contribution.
The input Producer Price Index (PPI) fell by 0.1% in the 12 months to December 2019, up from negative 1.9% in November 2019. This is the fifth consecutive month that the rate has been negative. Crude oil provided the largest upward contribution to the 12-month growth rate of input PPI.
Figure 1: The 12-month growth rates of input PPI and output PPI rose between November 2019 and December 2019
12-month growth rates for input Producer Price Index (PPI) (left-hand side), output PPI (left-hand side), and Consumer Prices Index including owner occupiers' housing costs (CPIH) (right-hand side) UK, December 2010 to December 2019, %
Source: Office for National Statistics – Producer Price Index and Consumer Prices Index including owner occupiers' housing costs
Notes:
- These data are also available within the Dashboard: Understanding the UK economy.
Download this image Figure 1: The 12-month growth rates of input PPI and output PPI rose between November 2019 and December 2019
.png (22.9 kB) .xlsx (20.7 kB)
4. Transport, and housing and household services are the biggest drivers of consumer price movements over the long term
In 2019, the annual average rate of growth of the Consumer Prices Index including owner occupiers' housing costs (CPIH) was 1.7%, down from an average annual growth rate of 2.3% in 2018, and 2.6% in 2017. Figure 2 shows how the different components of CPIH have contributed to the annual growth rate each year, and how this has changed since 2006. Looking at yearly contributions to the CPIH growth rate enables us to see longer-term broad price trends more clearly, as contributions to each month’s 12-month growth rate can be volatile, and some are influenced by seasonal patterns.
The annual average inflation rate has typically been lower in recent years than in the beginning of the period, when it was routinely above 2.0%, peaking in 2011 at 3.8%. After 2011, the annual growth rate fell each year until 2015 when it reached a low of 0.4%, before increasing again in 2016.
Figure 2: CPIH has slowly declined since 2017
Contributions to the annual growth rate of CPIH, UK, 2006 to 2019, % and percentage points
Source: Office for National Statistics – Consumer Prices Index including owner occupiers’ housing costs
Notes:
Individual contributions may not sum to the total because of rounding.
Other goods and services include health, communication, education, and miscellaneous goods and services.
Download this chart Figure 2: CPIH has slowly declined since 2017
Image .csv .xlsMovements in the annual rate of growth of CPIH are largely driven by movements in two components -- transport, and housing and household goods. These two components are among the largest contributors to the annual inflation rate, and also show considerable variation over time. For example, the fall in the contribution from transport between 2018 and 2019 accounted for over one-half of the total fall in the annual CPIH growth rate between the two years.
The contribution to the CPIH growth rate from housing and household services fell considerably in 2009 and 2010, particularly driven by owner occupiers' housing costs, gas, and electricity. This may partly reflect changes in the housing market following the 2008 to 2009 financial crisis and the role of rental equivalence in calculating owner occupiers' housing costs. Although calculated differently, data from the Index of Private Rented Housing (IPHRP) showed rents falling between 2008 and 2009. Since 2011, contributions from housing and household services has been relatively stable.
Both the gas and electricity components of housing and household services, and the fuels and lubricants component of transport, are influenced by changes in world prices for crude oil, which saw broadly similar price growth movements as CPIH growth over the period. Crude oil is discussed in more detail, in reference to the Producer Price Index (PPI), below.
The sharp increase in the annual inflation rate in 2016 and 2017 may also reflect the impact of the depreciation of sterling following the Brexit referendum in June 2016. All else being equal, a fall in the value of sterling would be expected to increase the cost of imported goods and services, pushing up inflation.
Most recently, annual inflation rates have reflected price growth in almost all components of CPIH, with very slight negative contributions from clothing and footwear in 2019, and miscellaneous goods and services in 2018 being the only offsetting movements in the last three years.
Nôl i'r tabl cynnwys5. Growth in the crude oil component of input Producer Price Index reflects base effects from price movements a year ago
The 12-month growth rate of the input Producer Price Index (PPI) rose to negative 0.1% in December 2019, from a 1.9% fall in prices in the year to November 2019. This change was largely driven by crude oil, with prices for the crude oil component of input PPI increasing by 7.1% between December 2018 and December 2019, having previously fallen by 7.9% between November 2018 and November 2019.
Figure 3 shows movements in the 12-month growth rates of input PPI and the crude oil component of input PPI since January 2018. The series are shown on different scales as crude oil prices are considerably more volatile than overall input PPI prices, but the similarity in the trends is clear. Crude oil has a weight of 20% in the input PPI basket, the relative stability of price growth for the other 80% of components means that, while still responding to crude oil price changes, movements in price growth for overall input PPI are more muted.
Figure 3: The 12-month growth rate for input PPI largely follows the same trend as crude oil growth but is considerably more muted
12-month growth of input PPI (right-hand side) and the crude oil component of input PPI (left-hand side), January 2018 to December 2019
Source: Office for National Statistics – Producer Price Index
Download this chart Figure 3: The 12-month growth rate for input PPI largely follows the same trend as crude oil growth but is considerably more muted
Image .csv .xlsChanges in the 12-month growth rate of prices depend on their movements in the current month and in the same month a year ago. The 12-month growth rate allows for like-for-like comparisons to be made without seasonal price movements having large effects on the growth rate. For volatile components like crude oil, this can lead to even greater volatility in price growth rates, as prices and their monthly movements may be very different from one year to the next.
Figure 4a shows movements in the 12-month growth rate for the crude oil component of input PPI, and the contributions to the 12-month growth rate from current month price movements and the base effect, which reflect how prices moved a year ago. Base effects refer to inflation in the corresponding period of the previous year.
If the inflation rate was quite low in the previous year, even a smaller rise in the current month's inflation rate will give a high rate of growth in the 12-month rate now. Alternatively, if the inflation rate had risen at a high rate in the previous year and recorded high inflation rate in the current month, the same absolute increase in the monthly rate will show a lower growth in the 12-month rate now.
The base month effect represents the 12-month growth rate as if the price had not changed from the previous month to the current month (effectively an 11-month growth rate), to show how much of the 12-month growth rate is being driven by the price level a year earlier, as opposed to current price movements.
The difference between an 11-month growth rate and the 12-month growth rate shows how much movements in the current month have driven the 12-month growth rate. If the 12-month growth rate is being largely driven by base effects, the growth rate may not be very reflective of recent price movements.
Figure 4a: A rise in crude oil price growth in December 2019 has been driven by price movements a year ago when prices fell quickly
12-month growth in the crude oil component of input PPI, by current month and base effects, UK, January 2018 to December 2019
Source: Office for National Statistics – Producer Price Index
Download this chart Figure 4a: A rise in crude oil price growth in December 2019 has been driven by price movements a year ago when prices fell quickly
Image .csv .xls
Figure 4b: Recent price movements for crude oil have been relatively small
Index of the crude oil component of input PPI, January 2018 to December 2019
Source: Office for National Statistics – Producer Price Index
Download this chart Figure 4b: Recent price movements for crude oil have been relatively small
Image .csv .xlsThe positive growth in crude oil prices between December 2018 and December 2019 follows seven months in which crude oil prices fell on the year. For the last six months, the 12-month growth rate of the price of crude oil has largely reflected base effects, with relatively small current-month price movements being dominated by price movements a year before.
World Bank data show the barrel price of crude oil as US $63 in December 2019, up from $60 per barrel in November 2019. By contrast, the barrel price in December 2018 was $54, down from $62 in November 2018.
Figure 4b shows movements in the index series of the price of crude oil, and shows more clearly how modest recent price movements for crude oil have been. Between October and December 2019, prices for crude oil increased by around 2% overall, while the 12-month growth rate of the price of crude oil rose by around 22 percentage points.
This sharp increase in the 12-month growth rate of the price of crude oil almost entirely reflects the sharp decrease in crude oil prices seen between October and December 2018, when prices fell by over 25% in two months.
Crude oil prices are generally influenced by a range of factors, including global geopolitical events. Towards the end of 2018, a number of these events arose including trade tensions between the US and China, sanctions on Iran, and increased oil production from Saudi Arabia, which collectively resulted in a sharp fall in oil prices, discussed in this Forbes article. Recent price movements have been relatively small by comparison.
Nôl i'r tabl cynnwys6. Annual house price growth in London has turned positive for the second time in recent months, although price growth has remained negative in outer London
Annual house price growth in the UK rose to 2.2% in November 2019, its highest rate of growth since November 2018. Of the countries of the UK, England had the lowest annual house price growth in November 2019 at 1.7%, compared with 3.5% in Scotland, 4% in Northern Ireland and 7.8% in Wales.
All but one region of England saw positive house price growth in the year to November 2019, with the East of England being the only region where average prices fell on the year.
Average house prices in London grew by 0.2% between November 2018 and November 2019, the second time the annual growth rate has been positive for London in recent months. This follows a sustained period of negative annual growth, with house prices falling on the year each month from March 2018 to August 2019.
Inner London has seen slightly positive annual house price growth for the last three months, while annual growth in outer London has increased but remains negative. Over the period, trends in outer London tend to broadly follow those in inner London with a slight lag.
Figure 5: Average annual house price growth in London was positive in November 2019, for the second time in recent months
Annual house price growth, London, inner London and outer London, January 2015 to November 2019
Source: HM Land Registry and Office for National Statistics – UK House Price Index
Notes:
Inner London includes the following boroughs: City of London, Camden, Greenwich, Hackney, Hammersmith and Fulham, Islington, Kensington and Chelsea, Lambeth, Lewisham, Newham, Southwark, Tower Hamlets, Wandsworth, and Westminster.
Outer London includes the following boroughs: Barking and Dagenham, Barnet, Bexley, Brent, Bromley, Croydon, Ealing, Enfield, Haringey, Harrow, Havering, Hillingdon, Hounslow, Kingston, Merton, Redbridge, Richmond, Sutton, and Waltham Forest.
House Price Index (HPI) data below region level are smoothed using a three-month rolling average, therefore totals for inner and outer London may not sum to the London value.
Download this chart Figure 5: Average annual house price growth in London was positive in November 2019, for the second time in recent months
Image .csv .xlsFigure 6 takes a more detailed look at London house price growth by London borough. To minimise the impact of small sample sizes, growth rates have been averaged over the 12 months to November 2019. Nonetheless, some boroughs report low sales volumes so care should be used in interpreting the data.
Figure 6: Average house price growth has varied considerably by London borough
Average growth rate of house prices, London boroughs, 12 months to November 2019
Source: HM Land Registry and Office for National Statistics – UK House Price Index
Download this chart Figure 6: Average house price growth has varied considerably by London borough
Image .csv .xlsThere has been considerable variation in average house price growth across London. Hackney has seen the highest rate of average annual house price growth across the 12 months, at 2.5%. The City of Westminster, and Kensington and Chelsea have seen the most pronounced annual falls in house prices, with prices falling by an average of 7.4% on the year in both boroughs.
Of those showing positive average annual house price growth in the 12 months to November 2019, five were in inner London and two were in outer London. Of the seven boroughs with the lowest average annual house price growth over the period, four were in inner London and three were in outer London, suggesting that there is no clear correlation between house price growth and a borough being in inner or outer London.
As with growth rates, there is a large degree of variation in average house prices between London boroughs, ranging from an average price of £300,300 in Barking and Dagenham to over £1.26m in Kensington and Chelsea.
Figure 7: There is no clear correlation between average house prices and average price growth by London borough
Average house prices, London boroughs, 12 months to November 2019
Source: HM Land Registry and Office for National Statistics – UK House Price Index
Download this chart Figure 7: There is no clear correlation between average house prices and average price growth by London borough
Image .csv .xlsThere is no clear correlation between average house prices and average house price growth by London borough, although the two boroughs with the highest average prices have also seen the largest average fall in prices in the 12 months to November 2019. This may reflect small sample sizes in those boroughs and there may be a compositional effect if fewer high value properties are being sold, rather than the same type of properties selling for lower prices. The article Exploring recent trends in the London housing market gives more detail of this using previous analysis.
Nôl i'r tabl cynnwysManylion cyswllt ar gyfer y Erthygl
Related publications
- Services producer price inflation, UK: October to December 2019
- Private rental growth measures, a UK comparison: October to December 2019
- Producer price inflation, UK: December 2019
- Consumer price inflation, UK: December 2019
- Index of Private Housing Rental Prices, UK: December 2019
- UK House Price Index: November 2019