1. Introduction
This article provides a background to the methods used to produce new experimental estimates for trade in services by modes of supply.
While trade in services statistics already record the type of products being traded (for example, financial services) and who it is being traded with (for example, Germany), policymakers are increasingly interested in how that trade is conducted. This type of information is critical for understanding the barriers businesses face when wishing to trade, and to assist policymakers engaged in trade negotiations.
Under the World Trade Organisation’s General Agreement on Trade in Services (GATS), trade in services can be conducted through four modes of supply, depending on the territorial presence of the supplier and the consumer at the time of the transaction. The four modes are as follows:
Mode 1: Remote trade
Mode 2: Consumption abroad
Mode 3: Commercial presence
Mode 4: Presence of natural persons
2. Feasibility study
Despite the importance of trade in services by mode of supply, up until recently there has been very little data publicly available. To address this gap, Eurostat developed an assumptions-based approach in 2017, which apportioned trade in services products by mode of supply, based on guidance received from statistical experts. While useful, the Eurostat method was not based on data collected from businesses, and the estimates produced were for the EU as a whole, rather than being specific to any individual country.
Users of Office for National Statistics (ONS) data highlighted the usefulness of producing modes of supply estimates based on the experiences of UK businesses; however, there was a concern that while these statistics were familiar to statisticians and trade analysts, they were generally not recorded by businesses in their accounts. A further concern was that asking businesses to provide detailed breakdowns of modes of supply, in addition to exports and imports by product and by country, would increase burden.
With these reservations in mind, the ONS joined international task forces at the World Trade Organisation (WTO) and Eurostat to work closely with international organisations and other countries to share understandings of user needs and potential solutions.
Based on findings from discussions at these task forces, the ONS commissioned a project to investigate the feasibility of collecting data on modes of supply directly from businesses. The project first reviewed different countries’ experiences of collecting these data, before engaging with businesses that conduct trade in services to better understand the data available to them.
Based on this information, we explored the feasibility of asking businesses to provide estimates of trade that is conducted remotely (Mode 1), given that it represents the dominant mode – approximately 69% according to Eurostat – through adding new questions to the International Trade in Services (ITIS) survey. This was similar to an approach that was being considered by the USA’s Bureau of Economic Analysis (BEA).
Following questionnaire design and cognitive testing, we selected a sample of 100 businesses to test the new survey questions for the ITIS survey in September 2018. During this test we were interested in the quality of responses and the impact on response rates. The results from the test indicated there was little change in the response rate among the pilot sample and most businesses were able to respond with the information needed.
Further to the successful completion of the test sample, we decided to proceed with adding the new questions to the 2018 annual ITIS survey for 5,000 businesses who are known to engage in international trade in services. This larger sample would enable us to further test the quality of responses that are received, and, if data quality was maintained, would allow us to produce new UK-specific estimates for trade in services by modes of supply through producing a hybrid method that combines results from the new survey questions with the Eurostat method. The results of that survey underpin the experimental estimates we have published today.
Nôl i'r tabl cynnwys3. Data collection
The 2018 annual International Trade in Services (ITIS) survey was redeveloped to add questions that asked respondents to provide an estimate of the percentage of services their business traded remotely (Mode 1), by means such as post, telephone, internet or email. Data were collected on Mode 1 only, given that it represents the dominant mode – approximately 69% according to Eurostat – and helped mitigate concerns over respondent burden. These breakdowns were collected by 14 service types, corresponding to those found on the ITIS survey. The new section of the survey instructs respondents to indicate the estimated percentage of remote trade for each service category that they conduct, for both imports and exports. These were presented as a choice of seven checkboxes:
0%
1% to 24%
25% to 49%
50% to 74%
75% to 99%
100%
unknown
Further quality and methodology information on the ITIS survey is available in the ITIS Quality and Methodology Information (QMI) report.
Nôl i'r tabl cynnwys4. Quality assurance and validation
Survey returns were run through a series of checks to identify errors. This includes consistency checks to ensure respondent data for modes of supply questions correspond with the traded service that the business reports. Any erroneous responses were also checked and confirmed directly through contact with the businesses.
Data clearance is the point at which response data become error free. A clearance rate of 73% was achieved by the agreed close-down date, following a response rate of 86% from the 5,000 businesses.
Nôl i'r tabl cynnwys5. Results processing methods
Mode 1 imputation
A proportional imputation approach was used to maintain the true respondents’ modes of supply proportions by product group, that is, the proportion of valid responses is apportioned against the responses that require imputation.
Within each service type covered in the International Trade in Services (ITIS) survey (used as the imputation classes), the proportion of responses for each category was calculated. Responses were then imputed for businesses who failed to respond to the survey or who answered “unknown”, by randomly allocating each with one of the six responses using the same proportions as those who had responded.
For example, if 80% of respondents answered that they conducted 100% of the trade in services remotely and the remaining 20% of respondents answered 50% to 75%, then 80% of missing data were imputed in the 100% remote trade category and 20% of missing data were imputed in the category of 50% to 75% remote trade.
Mode 1 estimation
For the annual survey, Horvitz-Thompson estimation is used to produce estimates for the entire population from sampled data. Estimates are produced separately for each industry by employment stratum and aggregated to produce high-level estimates.
For the modes of supply questions, each response value was quantified by converting the selected range to the midpoint for each percentage. These responses were then combined with their weighted total trade value for each service product, allowing the total value and proportion of each service product to be calculated.
Nôl i'r tabl cynnwys6. Analysis of Mode 1 estimates
Table 1 compares the UK’s Mode 1 estimates, by service type, from the International Trade in Services (ITIS) survey against Eurostat’s proportional allocation of extended balance of payments (EBOPS) categories to modes of supply.
Excluding transportation, travel and government services, which are not captured by the ITIS survey and instead use Eurostat’s simplified approach, telecommunications, computer and information services saw the closest comparison between the estimates collected through the ITIS survey and Eurostat’s estimates, with a 2% and 4% difference for exports and imports, respectively.
Eurostat estimates suggest that manufacturing, maintenance and repair, and construction services had no remote trade (Mode 1). However, results from the ITIS survey contradict this assumption.
For some services such as construction, differences between Eurostat’s estimates might largely be attributed to businesses subcontracting these services. Reporting subcontracting into the relevant industry is BMP6 compliant and is the recommended approach in the Manual on Statistics of International Trade in Services 2010. Therefore, for modes of supply, businesses are likely to regard service subcontracting as a service being carried out remotely, on the basis that facilitation and arrangement of the subcontractor was performed through remote means.
For manufacturing and maintenance and repair, if inputs have been provided through remote means, then respondents may regard this as entailing Mode 1. For example, the manufacture of a product that incorporates photographs that are uploaded via the internet.
| Exports | Imports | |||
|---|---|---|---|---|
| Service type | Eurostat | ITIS survey | Eurostat | ITIS survey |
| Manufacturing | 0 | 49 | 0 | 37 |
| Maintenance and repair | 0 | 49 | 0 | 37 |
| Transportation | 65 | 65 | 80 | 80 |
| Travel | 0 | 0 | 0 | 0 |
| Construction | 0 | 47 | 0 | 23 |
| Insurance and pension | 100 | 84 | 100 | 71 |
| Financial | 100 | 89 | 100 | 79 |
| Intellectual property | 100 | 83 | 100 | 87 |
| Telecommunications, computer and information services | 87 | 85 | 89 | 85 |
| Other business services | 75 | 65 | 75 | 65 |
| Personal, cultural and recreational | 75 | 43 | 75 | 29 |
| Government | 75 | 75 | 75 | 75 |
Download this table Table 1: Mode 1 comparison between Eurostat’s simplified approach and the UK estimates from the International Trade in Services survey, percentage
.xls .csvConfidence of estimates
As noted previously, the midpoints of responses were used for Mode 1 estimates. Figures 1 and 2 show the range in which remote trade was conducted, if the lower and upper extremes of responses were substituted for each service product. The confidence in estimates for service products with narrower ranges is higher than those with wider ranges. This analysis excludes transport, travel and government services which aren't collected via the ITIS survey – the allocation of modes of supply is based on Eurostat’s proportional allocation of EBOPS categories to modes of supply.
The two service exports with the narrowest range were construction, and personal, cultural and recreational services, with a range of 5% between their lower and upper estimates. Exports of other business services had the widest range, between 61% to 71%, with the mid-point of 65% used to estimate exports of that service for the population.
Figure 1: Lower and upper extremes of remote exports

Source: Office for National Statistics
Notes:
This analysis excludes Mode 3 trade (commercial presence).
Figures may not sum to 100 due to rounding.
Download this image Figure 1: Lower and upper extremes of remote exports
.png (73.9 kB) .xlsx (20.1 kB)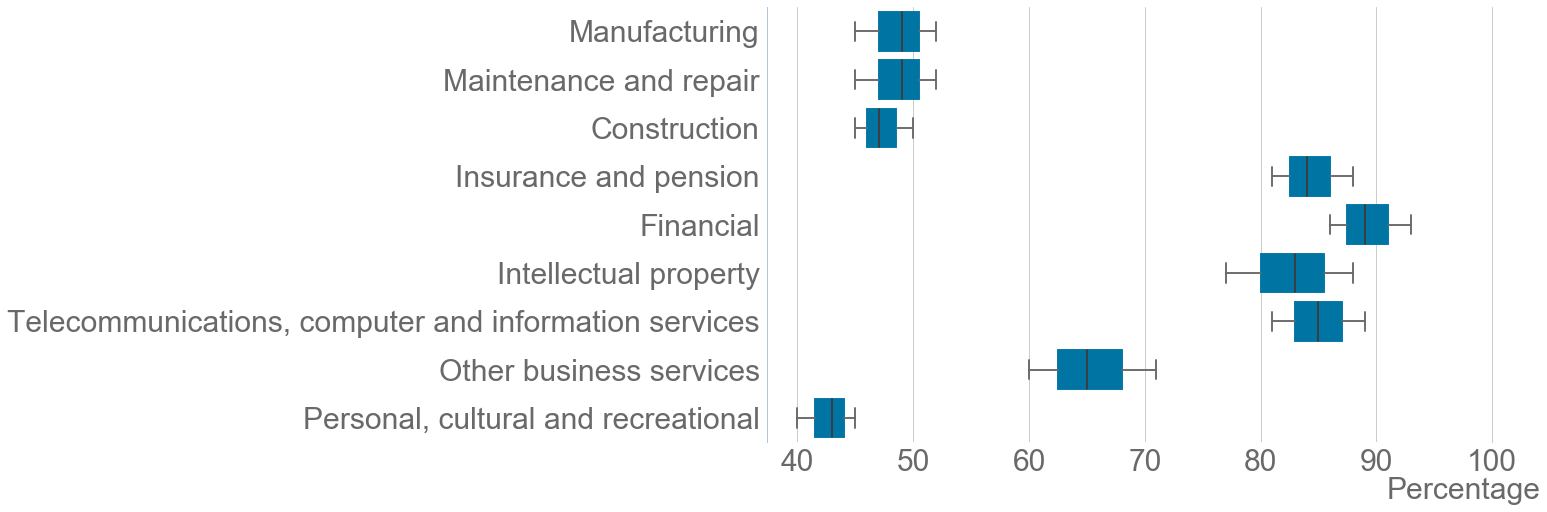
The service import with the narrowest range was intellectual property, with 2% between the lower and upper bounds. Imports of construction services had the widest range, from 17% to 30%, with a mid-point of 23% used to estimate imports for the population.
Figure 2: Lower and upper extremes of remote imports

Source: Office for National Statistics
Notes:
This analysis excludes Mode 3 trade (commercial presence).
Figures may not sum to 100 due to rounding.
Download this image Figure 2: Lower and upper extremes of remote imports
.png (74.8 kB) .xlsx (20.1 kB)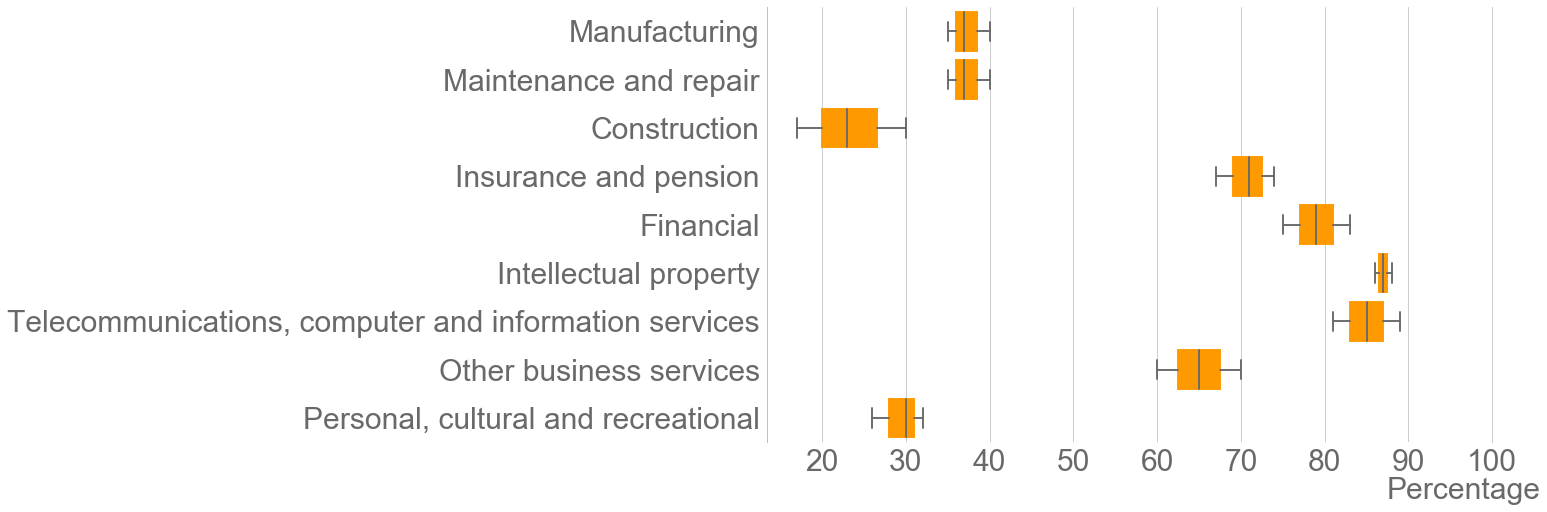
7. Allocation of the remaining modes of supply
Once the Mode 1 estimates had been finalised for each service type, the residuals were allocated to either Mode 2 or Mode 4 using Eurostat’s proportional allocation of extended balance of payments (EBOPS) categories to modes of supply.
The exceptions to this were:
maintenance and repair – 90% of services trade is allocated to Mode 2 and 10% is allocated to Mode 4 by Eurostat, so after applying the Mode 1 proportion, the remainder of the data are allocated 90% to Mode 2 and 10% to Mode 4
within other business services, waste treatment and de-pollution is allocated 75% of services trade to Mode 2, and 25% to Mode 4 by Eurostat, so after applying the Mode 1 proportion, the remainder of the data are allocated 75% to Mode 2 and 25% to Mode 4
For insurance and pension services, financial services and intellectual property, Eurostat estimate 100% of services trade is conducted through Mode 1. Where our survey results did not show this to be the case, we have assigned Mode 4 the residual percentage after consultation with subject matter experts at the Office for National Statistics (ONS).
Nôl i'r tabl cynnwys8. Modes of supply for non-ITIS industries
For the remaining non-International Trade in Services (ITIS) survey data sources – transport, travel and government services – the allocation of modes of supply is based on Eurostat’s proportional allocation of extended balance of payments (EBOPS) categories to modes of supply.
Nôl i'r tabl cynnwys9. Further work
There are several areas the Office for National Statistics (ONS) are considering to further develop the information on modes of supply, including:
continuing modes of supply questions in future annual International Trade in Services (ITIS) surveys to develop an understanding of the changing nature of trade in services by modes of supply over time
incorporating foreign affiliates statistics (FATS) for Mode 3, which is estimated by Eurostat to constitute the largest proportion of trade in services; this will allow us to provide the most comprehensive picture of how the UK trades its services
exploring alternative data sources to supplement the modes of supply data collected through ITIS, such as International migration statistics and Travel and tourism statistics, particularly to review the assumptions around Mode 2 and Mode 4
In addition, the ONS plans to continue to participate with Eurostat, the World Trade Organisation and the Organisation for Economic Co-operation and Development, as well as other National Statistics Institutes to work on further improvements to mode of supply data, and to ensure our estimates continue to meet the guidelines and recommendations agreed upon internationally.
Nôl i'r tabl cynnwys