
1. Foreword
This analysis presents a summary of concealed families in England and Wales using 2011 Census data. A concealed family is one living in a multi-family household in addition to the primary family, such as a young couple living with parents. Each family is assigned a Family Reference Person (FRP). Where there is more than one FRP in the household, the Household Reference Person (HRP) is chosen from the FRPs based on economic activity and then age, and finally order on the census form. The HRP is normally therefore the oldest full-time worker in most households and identifies the primary family in the household. Analyses of concealed family types and change over time are reported at the national, regional and local levels.
Nôl i'r tabl cynnwys2. Main points
There were 289,000 concealed families in 2011; this was 1.8 per cent of all families in households. In 2001 this was 170,000 (1.2 per cent)
Concealed families increased at ten times the rate of unconcealed families between 2001 and 2011 (70 per cent increase in concealed families compared with a 6.6 per cent increase in unconcealed families)
44 per cent (128,000) of concealed families in 2011 were couples with no children living in the family; this was the most common concealed family type
In Brent and Newham, more than one in 10 couples with no children living as part of the family were concealed in multi-family households
Concealed families were younger than unconcealed families; over half of concealed families had a Family Reference Person (FRP), that is the oldest full-time worker in most families, aged under 35 in 2011. This compared with less than 20 per cent of unconcealed families
Lone parent families that included dependent children were the family type most frequently concealed; 4.3 per cent of all lone parent families with dependent children were concealed in 2011
Lone parents with dependent children were the youngest concealed family type; the FRPs of concealed lone parent families with dependent children were four times more likely to be aged 25 or under in 2011 than the FRPs of concealed couple families including dependent children
3. Introduction
This short story analyses the characteristics of concealed families living in multi-family households in England and Wales. This is the second in a series of analyses produced by ONS on families and households1,2 using 2011 Census data.
Statistics on concealed families are often used as an indicator of housing demand; concealed households were used in the Department for Communities and Local Government (CLG) 2010 report ‘Estimating housing need’. Users of concealed family statistics will include those interested in future household formation, house building, planning and development and those who want to improve their understanding of families and households in England and Wales such as:
policy makers
MPs
local government
journalists
charities
businesses
students
researchers and academics
members of the public
The 2011 Census defined a concealed family as a couple or single parent family, living in a multi-family household, where the Family Reference Person (FRP)3 is not the Household Reference Person (HRP)4. Each family living in a household includes a FRP identified on the basis of economic activity and age characteristics (lone parents are automatically the FRP). In a one-family household the FRP is also the HRP. In households where there is more than one family, the HRP is selected from the FRPs based on economic activity, age and then order on the census form.
Concealed families will include:
young adults living with a partner and/or child/children in the same household as their parents
older couples living with an adult child and their family
unrelated families sharing a household
A single person cannot be a concealed family; therefore one elderly parent living with their adult child and family or an adult child returning to the parental home is not a concealed family; the latter are reported in an ONS analysis on increasing numbers of young adults living with parents.
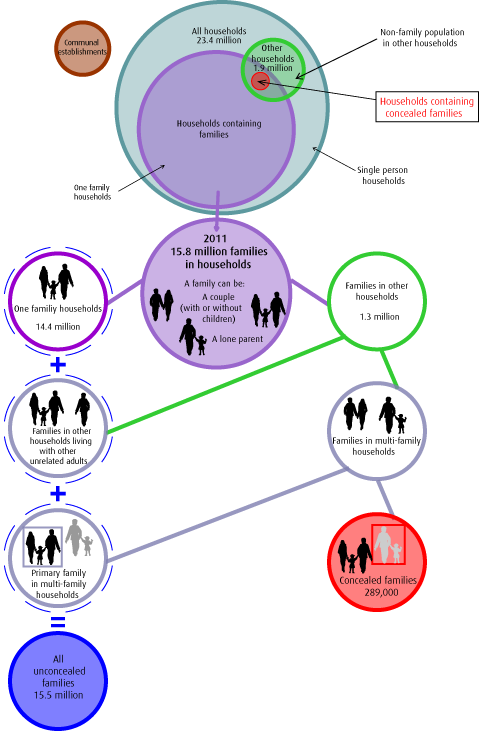
Figure 1 summarises the relationship between family and household definitions in the 2011 Census of England and Wales. There were 15.8 million families in households in England and Wales in 2011; the majority (14.4 million or 92 per cent) of these were living in one family households, with the remaining 1.3 million families (8.3 per cent)5 living in ‘other households’ (figures 1 and 2). There were 1.9 million ‘other households’ identified in the 2011 Census: these included households of more than one family, households comprised of unrelated adults sharing and those including one family and other unrelated adults.
Figure 1: Concealed families definition diagram
Source: 2011 Census, Office for National Statistics
Notes:
It is not possible to identify the number of households containing families or of multi-family households from currently published 2011 Census tables. The majority of families were living in households of one family only. The remaining families were living in other households. Other households are categorised by the age and type of residents and not by the family relationships within the household. Therefore, it is not possible to identify the number of 'other households' containing families
Numbers may not sum due to rounding
2011 Census tables LC1110EW and KS105EW were used to produce figure 1
Download this image Figure 1: Concealed families definition diagram
.png (87.4 kB)
The proportion of families living in ‘other households’ was greater than in 2001, when 6.6 per cent of the 14.7 million families in England and Wales were living in ‘other households’ (93 per cent were living in one family households).
Figure 2: Families in households by living arrangements 2001 and 2011
Source: Census - Office for National Statistics
Notes:
- 2011 Census tables LC1110EW and KS105EW and 2001 Tables UV65 and CS011 were used to produce figure 2
Download this chart Figure 2: Families in households by living arrangements 2001 and 2011
Image .csv .xlsConcealed families are only found in those ‘other households’ consisting of two or more families (multi-family households). There were 289,000 concealed families in 2011; 1.8 per cent of all families in households (22 per cent of families in ‘other households’). This is an increase from 170,000 concealed families in 2001 (1.2 per cent of all families; 18 per cent of families in ‘other households’).
Concealed families increased at a much greater rate between 2001 and 2011 (70 per cent increase) compared with unconcealed families (6.6 per cent increase). Family concealment proportions are likely to relate to a number of factors including: housing availability and cost in relation to employment and earnings, and cultural differences in living arrangements and familial ties.
The ONS report ‘Families and Households, 2013’ (using data from the Labour Force Survey (LFS)) identified multi-family households as the fastest growing household type in the UK, increasing by 39 per cent from 206,000 households in 2003 to 286,000 households in 2013. However, multi-family households still represented only one per cent of all households in 2013. This estimate of 286,000 multi-family households in the UK in 2013 is consistent with the estimate of 289,000 concealed families in England and Wales in the 2011 Census, suggesting that the majority of concealed families were likely to be living in two family households in 2011.
Notes for Introduction
A family is defined as a group of people who are either:
- a married, same-sex civil partnership, or cohabiting couple, with or without child(ren)
- a lone parent with child(ren)
- a married, same-sex civil partnership, or cohabiting couple with grandchild(ren) but with no children present from the intervening generation
- a single grandparent with grandchild(ren) but no children present from the intervening generation
Children in couple families need not belong to both members of the couple. For single or couple grandparents with grandchildren present, the children of the grandparent(s) may also be present if they are not parents or grandparents of the youngest generation present
A household is defined as:
- one person living alone
- a group of people (not necessarily related) living at the same address who share cooking facilities and share a living room or sitting room or dining area
This includes:
- sheltered accommodation units in an establishment where 50 per cent or more have their own kitchens (irrespective of whether there are other communal facilities)
- all people living in caravans on any type of site that is their usual residence. This will include anyone who has no other usual residence elsewhere in the UK
A household must contain at least one person whose place of usual residence is at the address. A group of short-term residents living together is not classified as a household, and neither is a group of people at an address where only visitors are staying
The Family Reference Person (FRP) is identified by criteria based on the family make up. In a lone parent family it is taken to be the lone parent. In a couple family, the FRP is chosen from the two people in the couple on the basis of their economic activity (in the priority order: full-time job, part-time job, unemployed, retired, other). If both people have the same economic activity, the FRP is identified as the elder of the two or, if they are the same age, the first member of the couple on the form
The concept of a Household Reference Person (HRP) was introduced in the 2001 Census (in common with other government surveys in 2001/2) to replace the traditional concept of the 'head of the household'. HRPs provide an individual person within a household to act as a reference point for producing further derived statistics and for characterising a whole household according to characteristics of the chosen reference person
For a person living alone, it follows that this person is the HRP. If a household contains only one family (with or without ungrouped individuals, for example unrelated lodgers) then the HRP is the same as the Family Reference Person (FRP). For families in which there is generational divide between family members that cannot be determined (Other related family, for example adult siblings sharing a household), there is no FRP. Members of these families are treated the same as ungrouped individuals
If there is more than one family in a household the HRP is chosen from among the FRPs using the same criteria used to choose the FRP. This means the HRP will be selected from the FRPs on the basis of their economic activity, in the priority order:
- economically active, employed, full-time, non-student
- economically active, employed, full-time, student
- economically active, employed, part-time, non-student
- economically active, employed, part-time, student
- economically active, unemployed, non-student
- economically active, unemployed, student
- economically inactive, retired
- economically inactive, other
If some or all FRPs have the same economic activity, the HRP is the eldest of the FRPs. If some or all are the same age, the HRP is the first of the FRPs from the order in which they were listed on the questionnaire. If a household is made up entirely of any combination of ungrouped individuals and other related families, the HRP is chosen from among all people in the household, using the same criteria used to choose between FRPs. Students at their non term-time address and short-term migrants cannot be the HRP
Some numbers and percentages throughout this report may not sum due to rounding
4. Geographical distribution
Table 1 shows that there is considerable regional variation in the proportion of families concealed. London had the highest rate of concealed families in 2011: 3.3 per cent of all families in London, while the North East had the lowest proportion at 1.3 per cent. Concealed family proportions may be related to the ethnicity of the local population and also to the relative cost and availability of housing. These two regions also had the highest and lowest proportions of families concealed in 2001 at 2.0 per cent and 0.8 per cent respectively. All regions have experienced an increase in the proportion of concealed families between 2001 and 2011, with London increasing the most, by 1.41 percentage points.
Table 1: Concealed family proportions by region, 2011 and 2001
| 2001 Census | 2011 Census | |||||
| All families (Thousands) | Concealed families (Thousands) | % concealed | All families (Thousands) | Concealed families (Thousands) | % concealed | |
| England and Wales | 14,682 | 170 | 1.2 | 15,764 | 289 | 1.8 |
| North East | 722 | 6 | 0.8 | 748 | 9 | 1.3 |
| North West | 1,899 | 21 | 1.1 | 1,986 | 32 | 1.6 |
| Yorkshire and The Humber | 1,421 | 16 | 1.1 | 1,503 | 25 | 1.7 |
| East Midlands | 1,214 | 12 | 1.0 | 1,313 | 20 | 1.6 |
| West Midlands | 1,505 | 21 | 1.4 | 1,588 | 34 | 2.2 |
| East | 1,565 | 13 | 0.9 | 1,696 | 25 | 1.5 |
| London | 1,816 | 35 | 2.0 | 2,064 | 69 | 3.3 |
| South East | 2,279 | 23 | 1.0 | 2,458 | 39 | 1.6 |
| South West | 1,426 | 13 | 0.9 | 1,528 | 21 | 1.4 |
| Wales | 836 | 9 | 1.0 | 879 | 13 | 1.5 |
| Source: 2011 Census, Office for National Statistics | ||||||
| Notes: | ||||||
| 1. Figures rounded to the nearest thousand | ||||||
| 2. 2011 Census table LC1110EW and 2001 tables S007 and M511a were used to produce table 1 | ||||||
Download this table Table 1: Concealed family proportions by region, 2011 and 2001
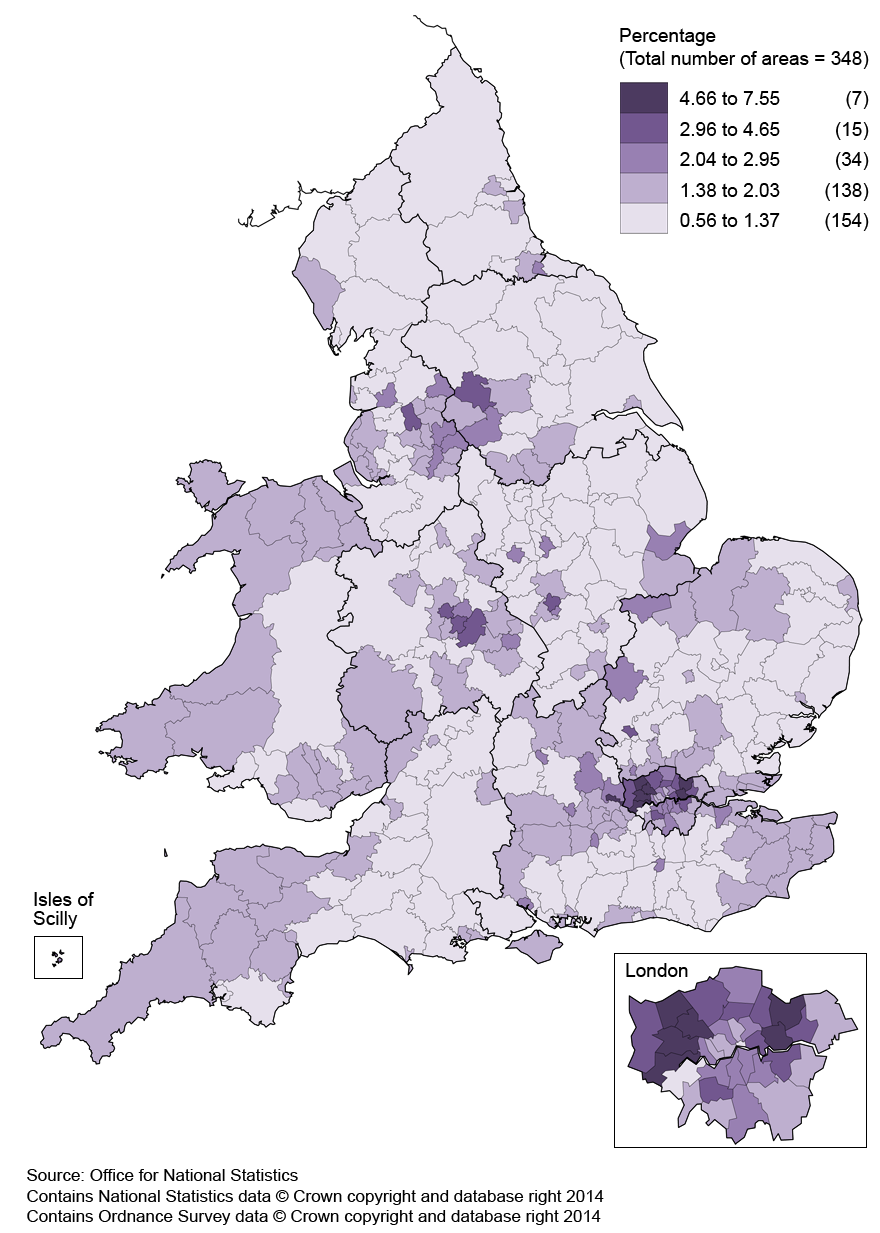
.xls (27.1 kB)Map 1 shows the geographical distribution of concealed families in 2011 at the local authority (LA) level. It is clear that urban areas within Greater London, Slough, Birmingham, Leicester and the North West including Bradford and Blackburn with Darwen had the highest rates of concealed families; these areas therefore also had higher proportions of multi-family households. Higher proportions of concealed families were also recorded in the South West (Cornwall and Devon), Kent, West Wales and Northern East Anglia.
Map 1: Percentage of families that were concealed families in 2011 by local authority in England and Wales
Source: Census - Office for National Statistics
Download this image Map 1: Percentage of families that were concealed families in 2011 by local authority in England and Wales
.png (399.4 kB)
Table 2 shows the 20 LAs with the highest proportions of concealed families in 2011. Twelve of the top 20 areas were within Greater London; Newham had the highest proportion of concealed families at 7.5 per cent of all families within the area. Outside London, the LA with the highest proportion of concealed families was Slough, ranking third at 5.6 per cent. Merthyr Tydfil was the highest ranking LA within Wales, with 2.0 per cent of families concealed (ranked 58th within England and Wales). By contrast, the lowest level for all LAs in England and Wales was in Rutland2, where just 0.6 per cent of families were concealed.
Concealed family proportions may relate to cultural differences in familial ties between ethnic groups. Within England and Wales, ‘other households’ are more than twice as likely to have a HRP of non-white or mixed ethnic group (24 per cent) compared with all households (11 per cent).
The ten LAs with the highest proportions of concealed families shown in table 2 also have the highest proportions of the population identifying with a non-white ethnic group; high proportions of the population of these areas identified as Indian, Pakistani or Bangladeshi. The high proportions of concealed families in these areas may be a result of closer familial ties in Asian cultures. An ONS report on ethnicity in the 2011 Census is available.
Table 2: Twenty local authorities with the greatest percentage of concealed families, 2011
| Rank | Local Authority | All families (Thousands) | Concealed families (Thousands) | % concealed |
| 1 | Newham | 70 | 5 | 7.5 |
| 2 | Brent | 77 | 5 | 7.0 |
| 3 | Slough | 37 | 2 | 5.6 |
| 4 | Ealing | 85 | 5 | 5.4 |
| 5 | Harrow | 65 | 3 | 5.1 |
| 6 | Redbridge | 74 | 4 | 5.1 |
| 7 | Hounslow | 67 | 3 | 5.1 |
| 8 | Waltham Forest | 65 | 3 | 4.6 |
| 9 | Leicester | 82 | 4 | 4.5 |
| 10 | Tower Hamlets | 54 | 2 | 4.3 |
| 11 | Luton | 53 | 2 | 4.2 |
| 12 | Bradford | 141 | 6 | 4.0 |
| 13 | Birmingham | 271 | 11 | 3.9 |
| 14 | Sandwell | 86 | 3 | 3.6 |
| 15 | Hillingdon | 73 | 3 | 3.5 |
| 16 | Haringey | 62 | 2 | 3.3 |
| 17 | Barking and Dagenham | 49 | 2 | 3.3 |
| 18 | Blackburn with Darwen | 40 | 1 | 3.2 |
| 19 | Greenwich | 65 | 2 | 3.2 |
| 20 | Wolverhampton | 69 | 2 | 3.2 |
| Source: 2011 Census, Office for National Statistics | ||||
| Notes: | ||||
| 1. Figures rounded to the nearest thousand | ||||
| 2. 2011 Census table LC1110EW was used to produce table 2 | ||||
Download this table Table 2: Twenty local authorities with the greatest percentage of concealed families, 2011
.xls (25.6 kB)Notes for Geographical distribution
Some numbers and percentages throughout this report may not sum due to rounding
The City of London was excluded owing to small overall population size
5. Concealed family types
In 2011, the majority of all families were couple families (82 per cent, 12.9 million). This included 41 per cent (6.5 million) with no children living in the family, 31 per cent (4.8 million) with dependent1 children, and 10 per cent (1.5 million) with non-dependent children only. Unconcealed families showed the same distribution.
While the majority of concealed families were also couple families, they accounted for a smaller proportion (63 per cent, 182,000) compared to all families; the concealed couple families proportion comprised 44 per cent (128,000) living with no children, 14 per cent (41,000) with dependent children and 4.6 per cent (13,000) with non-dependent children only (figure 3). A higher proportion of concealed couple families (seven in ten families) had no children living in the family, compared to unconcealed couple families (five in ten families).
Lone parent families accounted for twice the proportion (37 per cent) of concealed families compared with unconcealed families (18 per cent). Concealed lone parent families included 29 per cent (84,000) with dependent children and 7.9 per cent (23,000) with non-dependent children only. Almost eight in ten concealed lone parent families included dependent children, while this group accounted for seven in ten unconcealed lone parent families.
Figure 3: Concealed and unconcealed families by type, 2011
Source: Census - Office for National Statistics
Notes:
- 2011 Census table LC1110EW was used to produce figure 3
Download this chart Figure 3: Concealed and unconcealed families by type, 2011
Image .csv .xlsThe much greater proportion of concealed families accounted for by lone parent families is reflected in the concealment percentages for each family type in 2001 and 2011 (figure 4). Lone parent families that included dependent children were the family type most likely to be concealed in both 2001 (3.3 per cent) and 2011 (4.3 per cent). Couple families that included children (dependent or non-dependent) were the family types least likely to be concealed with less than one per cent of each family type concealed in both 2001 and 2011.
Figure 4: Percentage of families concealed by family type 2011 and 2001
Source: Census - Office for National Statistics
Notes:
- 2011 Census table LC1110EW and 2001 table CAS011 was used to produce figure 4
Download this chart Figure 4: Percentage of families concealed by family type 2011 and 2001
Image .csv .xlsThe reasons for families living in multi-family households will vary by area, and therefore the types of concealed families will differ; the highest proportions of concealed families who were lone parents with dependent1 children was in Knowsley (Merseyside) where this category accounted for the majority (55 per cent) of all concealed families; the lowest proportion of concealed families accounted for by this category (13 per cent) was in Harrow.
Figure 5 shows the concealed family types within Knowsley and West Devon, the LAs with the highest proportion of lone parents with dependent children (55 per cent) and couples with no children (65 per cent) respectively; 44 per cent of concealed families with no children in West Devon had an FRP of age 65 or over. The types of family concealed may relate to demographic and cultural differences between local populations in addition to economic influences such as the cost of housing locally. The census comparator tool shows that the age structure of Knowsley is younger than that of West Devon, with the population aged 65 or over accounting for 16 per cent and 23 per cent respectively. Both areas had low proportions of other households with a non-white HRP (3.1 per cent and 2.2 per cent respectively) compared to England and Wales as a whole (24 per cent).
Figure 5a: Concealed families by type in Knowsley, 2011
Source: Census - Office for National Statistics
Notes:
- 2011 Census table LC1110EW was used to produce Figure 5
- 846 concealed families
Download this chart Figure 5a: Concealed families by type in Knowsley, 2011
Image .csv .xls
Figure 5b: Concealed families by type in West Devon, 2011
Source: Census - Office for National Statistics
Notes:
- 2011 Census table LC1110EW was used to produce Figure 5
- 263 concealed familes
Download this chart Figure 5b: Concealed families by type in West Devon, 2011
Image .csv .xlsNotes for Concealed family types
- Dependent children are those aged under 16 living with at least one parent, and those aged 16 to 18 in full-time education (excluding those who have a spouse, partner or child living in the household). Non-dependent children are those aged over 18 living with at least one parent, and those aged 16 to 18 and not in full-time education (excluding those who have a spouse, partner or child living in the household)
6. Age of Family Reference Person (FRP)
Of the 15.8 million families in England and Wales, less than 20 per cent had a FRP aged under 35 in 2011; 3.1 per cent (483,000) had a FRP aged under 25. Figure 6 shows the proportions of unconcealed families (totalling 15.5 million) and concealed families (totalling 289,000) by FRP age groups. The FRPs of concealed families had a much younger age profile than those of unconcealed families. This will, however, be partly related to the use of age as a criterion in determining the HRP and therefore which family is concealed; in a two family household where both FRPs are working full time, the concealed family will be the family with the younger FRP.
Over half (54 per cent) of all concealed FRPs were aged under 35 including 21 per cent aged under 25, while the majority (63 per cent) of unconcealed FRPs were aged 35-64 in 2011. This suggests that concealed families were more likely to be younger parents/couples living with their parents in multi-generational households. The younger age of concealed FRPs may also relate to the age profile of some ethnic groups.
Almost half (48 per cent) of all unconcealed FRPs were aged 50 or over in 2011, compared to around one in three concealed FRPs; proportions of families with a FRP aged 65 or over were similar for both concealed and unconcealed families at around one in five families.
Figure 6: Age distribution of FRP by family type, England and Wales 2011
Source: Census - Office for National Statistics
Notes:
- 2011 Census table LC1110EW was used to produce figure 6
Download this chart Figure 6: Age distribution of FRP by family type, England and Wales 2011
Image .csv .xlsFigure 7 provides further detail on the age distribution for concealed family FRPs by family type. While overall the proportion of concealed families with a FRP aged under 25 is more than six times that of unconcealed families, this varies considerably by concealed family type. The youngest FRP age distribution is seen for lone parent families with dependent children; 40 per cent were aged under 25. The oldest FRP age distribution of any concealed family type is for couple families with non-dependent children only; more than 90 per cent were aged 50 or over.
Figure 7: FRP age distribution of concealed families by family type, 2011
Source: Census - Office for National Statistics
Notes:
- Totals for each column shown above are rounded to the nearest thousand
- 2011 Census table LC1110EW was used to produce figure 7
Download this chart Figure 7: FRP age distribution of concealed families by family type, 2011
Image .csv .xls7. Concealed lone parent families
Of the 15.8 million families in England and Wales in 2011, 2.9 million (18 per cent) were lone parent families. These included lone parent families with dependent children and those with non-dependent children only. This was an increase in both number and percentage from 2001 when 2.4 million families (16 per cent) were lone parents.
Of the 2.9 million lone parent families in England and Wales, 2.5 million (86 per cent) were living in one family households. The remaining 405,000 lone parent families (14 per cent) were living in ‘other households’. Just over a quarter (26 per cent, 107,000) of these were concealed families living in multi-family households1.
The remaining unconcealed lone parent families in ‘other households’ included those living in multi-family households where the lone parent is the HRP. These will include: a lone parent living with two children where one child also has a partner living in the household, and those living with other adults (related or unrelated), such as a lone parent with a lodger.
Lone parent families were the family type most likely to be concealed in 2011, at 3.7 per cent of all lone parent families; the proportion of lone parent families who were concealed has also increased from 2.8 per cent in 2001. However, the proportion of concealed families who were lone parents fell from 39 per cent in 2001 to 37 per cent in 2011. This is a result of greater proportional increases in concealed couple families (76 per cent increase) compared with concealed lone parent families (62 per cent increase).
In 2011, lone parent families with dependent or non-dependent children2 accounted for 37 per cent of all concealed families; this was more than twice the proportion of unconcealed families who were lone parents (18 per cent). This was also the case in 2001.
Concealed lone parent families were more likely to include dependent children than unconcealed lone parent families. The majority (79 per cent) of concealed lone parent families included dependent children (the remaining 21 per cent including non-dependent children only). Of the 2.5 million one family lone parent households, the proportion that included dependent children was 67 per cent; the proportion of all unconcealed lone parent families that included dependent children was also 67 per cent (the majority of these were one family households).
Lone parent families with dependent children were more likely to be concealed (4.3 per cent) than those with non-dependent children only (2.4 per cent) in 2011 (see figure 4). Table 3 shows the twenty local authorities (LAs) with the highest proportions of concealed lone parent families with dependent children in England and Wales. The highest concealment percentages for this family type were in Newham and Bradford (8.1 per cent and 8.0 per cent respectively), at more than twice the percentage for England and Wales (3.7 per cent). Merthyr Tydfil was the LA with the highest proportion in Wales (6.4 per cent), ranking eleventh within England and Wales. The LA with the lowest rate in England and Wales was Norwich, with 2.0 per cent of lone parent families with dependent children concealed in 2011.
Table 3: Twenty local authorities with the highest proportions of concealed lone parent families with dependent children, 2011
| Rank | Local Authority | Lone parents with dependent children (Thousands) | Concealed lone parents: dependent children (Thousands) | % concealed |
| 1 | Newham | 14.6 | 1.2 | 8.1 |
| 2 | Bradford | 19.5 | 1.6 | 8.0 |
| 3 | Castle Point | 2.5 | 0.2 | 7.6 |
| 4 | Luton | 7.8 | 0.6 | 7.1 |
| 5 | Sandwell | 13.5 | 0.9 | 6.9 |
| 6 | Oadby and Wigston | 1.4 | 0.1 | 6.8 |
| 7 | Slough | 5.7 | 0.4 | 6.7 |
| 8 | South Bucks | 1.4 | 0.1 | 6.7 |
| 9 | Redbridge | 10.5 | 0.7 | 6.6 |
| 10 | Tower Hamlets | 9.2 | 0.6 | 6.4 |
| 11 | Merthyr Tydfil | 2.9 | 0.2 | 6.4 |
| 12 | Brent | 13.0 | 0.8 | 6.3 |
| 13 | Boston | 2.1 | 0.1 | 6.3 |
| 14 | Birmingham | 51.1 | 3.2 | 6.2 |
| 15 | Oldham | 9.8 | 0.6 | 6.1 |
| 16 | Hounslow | 9.7 | 0.6 | 6.1 |
| 17 | Rochford | 1.9 | 0.1 | 6.0 |
| 18 | Harrow | 7.1 | 0.4 | 6.0 |
| 19 | Walsall | 10.2 | 0.6 | 5.8 |
| 20 | Dudley | 10.3 | 0.6 | 5.8 |
| Source: Office for National Statistics | ||||
| Notes: | ||||
| 1. Figures rounded to the nearest thousand | ||||
| 2. Isles of Scilly excluded from top 20 table owing to small overall population size | ||||
| 3. 2011 Census tables LC1110EW and DC1115EW were used to produce table 3 | ||||
Download this table Table 3: Twenty local authorities with the highest proportions of concealed lone parent families with dependent children, 2011
.xls (27.6 kB)Concealed lone parents were much younger than unconcealed, with 31 per cent of concealed lone parents under the age of 25 (figure 8); this was more than four times the proportion of unconcealed lone parents (6.5 per cent). This is because concealed lone parents are more likely to be young adults, and therefore more likely to be living with their parents.
Figure 8: Distribution of concealed and unconcealed lone parent families by FRP age
Source: Census - Office for National Statistics
Notes:
- 2011 Census tables LC1110EW and DC1115EW were used to produce figure 8
Download this chart Figure 8: Distribution of concealed and unconcealed lone parent families by FRP age
Image .csv .xlsNotes for Concealed lone parent families
An example of a multi-family household including a concealed lone parent family is a household including a couple living with their child and grandchild; this would be an ‘other household’ with one couple family (unconcealed) and one lone parent family (concealed)
Dependent children are those aged under 16 living with at least one parent, and those aged 16 to 18 in full-time education (excluding those who have a spouse, partner or child living in the household). Non-dependent children are those aged over 18 living with at least one parent, and those aged 16 to 18 and not in full-time education (excluding those who have a spouse, partner or child living in the household)