1. Main points
- The sum of service exports from all regions and countries of the UK was £254.0 billion in 2016, up from £229.4 billion in 2015; London’s share of £117.3 billion of all service exports in 2016 was the highest at 46.2%, followed by the South East with 15.5%.
- In 2016, service exports from all NUTS1 areas, except the North West, increased compared with 2015; Northern Ireland’s service exports grew by the highest percentage of 17.0%, followed by the North East (14.3%) and London (13.2%).
- Almost one-quarter of service exports from the North West came from the manufacturing industry, and this was the only NUTS1 area for which manufacturing was the top category; the three categories of manufacturing, financial and transport services accounted for more than half of exports of services from each of the North East, North West and Yorkshire and The Humber.
- Service exports from Great Britain grew by 33.4% between 2011 and 2016; London contributed to more than half of the overall change in five of the 13 categories, while Scotland was the second-highest contributor to the growth of financial service exports, after London.
- New product-level analysis by NUTS1 area showed that business services was the most prominent type of service exported in 2016, accounting for £64.6 billion; over 60% of the business service exports came from London and the South East.
2. Introduction
As part of our ongoing analysis of subnational trade through the Office for National Statistics (ONS) Devolution programme, this article provides an update containing 2016-based estimates of the value of service exports arising from the NUTS1 countries and regions of the UK. In 2016, services accounted for 80% of total gross value added (GVA) in the UK, and according to the Pink Book, exports of services accounted for 46% of total UK exports. This highlights the importance of service sectors to the UK economy, and supports calls from the English combined authorities, the Greater London Authority and the devolved administrations of Wales, Scotland and Northern Ireland for more detailed analysis of trade at the subnational level.
The UK Balance of Payments shows the value of goods exports and of service exports, separately, from the UK to other countries. HM Revenue and Customs’ Regional Trade Statistics provides estimates of the value of goods exports from the NUTS1 areas of the UK, which are Wales, Scotland, Northern Ireland, and the nine English regions. In this article we present estimates of the values of services exported by each NUTS1 area.
Building on previous analysis, this article adds data for the year 2016 to the previous publication, which presented figures for 2011 to 2015. It also makes note of outcomes of the related consultation and will be followed by further analysis looking at other geographic breakdowns among other developments stated in Section 7. This article also compiles product-based estimates for each NUTS1 area in 2016, providing a more coherent picture of what specific services have been exported.
Analysis has been conducted on the same methodological basis as before and updates figures for 2015 to account for revisions made since previous publications. These estimates of services are broadly comparable with the UK Balance of Payments, and values of goods from Regional Trade Statistics, although further development work is ongoing to ensure full comparability.
This article contains figures for Northern Ireland, which have been published by the Northern Ireland Statistics and Research Agency (NISRA) in the paper entitled Northern Ireland Broad Economy Sales and Exports Statistics. Two other trade-related publications are also released today: UK trade in goods by industry, country and commodity, which provides new trade in goods data by industry, country and commodity produced as part of planned improvements to our trade statistics; and International trade in services by partner country, which provides more detailed and timely imports and exports of services at the UK level by trading partner country.
Notes for introduction:
- The Nomenclature of Units for Territorial Statistics (NUTS) is a hierarchical classification of administrative areas, used across the EU for statistical purposes. There are 12 NUTS1 areas in the UK: Wales, Scotland, Northern Ireland, and the nine former English Government Office Regions.
3. Things you need to know about this release
In July 2016, we published the first estimated values of service exports from the NUTS1 areas of the UK. That publication contained an explanation of an experimental methodology used to calculate values of exports of services from each country and English region of the UK (known as “NUTS1 areas”) and a commentary upon the initial set of results. This was followed by a 2015-based update released in May 2017, presenting data for the years 2011 to 2015. This article adds data for the year 2016, on the same methodological basis.
This release also updates figures for 2015 to account for revisions to the data for Northern Ireland, which are updated one year after initial publication1, and for revisions to the Pink Book, which affect figures for the transport, travel, finance and insurance and pensions categories across all NUTS1 areas. Data for 2016 are subject to the same change in subsequent releases.
The methodology takes figures primarily from the International Trade in Services survey (ITIS), and the Inter-Departmental Business Register (IDBR), but also combines data from the UK Balance of Payments (the Pink Book), the International Passenger Survey (IPS), the Business Register and Employment Survey (BRES), and Broad Economy Sales and Exports Statistics (BESES) for Northern Ireland. Estimates presented in this article are on a current price basis and therefore do not account for effects of inflation.
The Pink Book presents results compiled on a product basis at the UK level, however, our users stated they wanted data on an industry basis. In this article, as in the previous publications, we present results broken down by “functional category” (shown in Table 1 in the Appendix). This is a combination of product categories for the estimates produced by breaking down UK figures directly from the Pink Book, and UK Standard Industrial Classification 2007: SIC 2007 based industries for the estimates produced using ITIS and ABI data. In future releases, we aim to produce estimates on a full industry basis.
In this article, we have also produced product-level estimates for NUTS1 service exports based on the ITIS component. We present results for 28 product classifications (shown in Table 2 in the Appendix), which have been derived by aligning ITIS product codes from ITIS questionnaire returns with the Extended Balance of Payments Services (EBOPS) classification.
To calculate the results presented in this article, we divide export values provided at organisational level through ITIS survey returns to their constituent parts called “local units”, the individual physical locations making up the organisation. This is currently done using information on employee counts, geographic location and industrial sector of each local unit from IDBR microdata, thereby assuming all parts of an organisation contribute to exporting (rather than just the trading office). This creates NUTS1 area estimates of service exports from Great Britain for all functional categories except transport, travel, insurance and pension services, and financial services. The same principle has been applied to estimates by product from ITIS returns.
The ITIS sample excludes businesses that fall within travel, transport, banking and other financial institutions to avoid duplication in national accounts outputs and therefore we take this information from additional data sources. Figures for Northern Ireland are estimated separately by the Northern Ireland Statistics and Research Agency (NISRA) using BESES. For the four product-based categories, we apportion Pink Book UK-level figures using additional indicators: International Passenger Survey data for travel, BRES for transport, data from the Bank of England for parts of financial services, and BRES for insurance and pension services.
For more detailed information about the methodology, and the decisions made in creating this methodology, please refer to our previous publication.
In the rest of the article we first give an overview of the 2016 estimates of regionalised service exports for the UK alongside the revised 2015 estimates in Section 4. We then present estimates broken down by functional categories in Section 5 with a series of interactive charts and tree maps. We also analyse the growth in service exports that has occurred between 2011 and 2016. In Section 6 we introduce our product analysis, which examines the types of services that have been exported at NUTS1 level, before closing with next steps in Section 7.
Notes for: Things you need to know about this release
- NISRA revise data from the previous year based on ongoing data validation and clarification of responses from individual businesses. For example, this may involve dealing with late returns from businesses.
4. NUTS1 service exports, 2015 to 2016
The total value of UK service exports we have calculated was £254.0 billion in 2016, up from £229.4 billion in 2015, an increase of £24.5 billion1. This was the highest annual increase if we look at the period between 2011 to 2016. London continues to dominate the regional share of the total service exports, contributing a little less than half of UK service exports at £117.3 billion. The South East had the second-highest share of 15.5%, with Scotland and the North West contributing 7.3% and 7.2% respectively. During the period between 2011 and 2016, the share of service exports contributed by each NUTS1 area has remained relatively similar.
Figure 1: Total value of service exports from the UK by NUTS1 area
2015 and 2016
Download this chart Figure 1: Total value of service exports from the UK by NUTS1 area
Image .csv .xlsThe highest percentage increase in the value of service exports was seen in Northern Ireland, which increased by 17.0%, followed by the North East and London, which increased by 14.3% and 13.2% respectively, between 2015 and 2016. Only one NUTS1 area experienced a decline in service exports between 2015 and 2016, where the North West reduced by around 1%.
Notes for:
- The UK Balance of Payments estimated that exports of services from the UK in 2016 were £257.9 billion, up from £232.9 billion in the previous year. There is a small difference between the Pink Book value and the aggregate of the NUTS1 area values because the NUTS1 methodology slightly differs from the Pink Book methodology. It is our intention to align our subnational figures with the UK Pink Book value in future publications.
5. NUTS1 service exports by functional categories
In this section, we look more closely at the breakdown of service exports from parts of Great Britain1 split by functional category. As defined in the appendix, “functional category” is a hybrid of products and the UK Standard Industrial Classification 2007 classifications.
The total value of Great Britain service exports in 2016 was £251.2 billion, an increase of 10.6% up from £227.0 billion in 2015. Figure 2 shows the value of service exports by functional category, where we find the highest share was that of financial services, contributing 22.1% of total Great Britain service exports in 2016. The next two highest contributors were real estate, professional, scientific and technical services, amounting to £39.8 billion (15.9%), and travel services at £35.1 billion (14.0%).
Figure 2: Total value of Great Britain service exports by functional category
2015 and 2016
Source: UK Balance of Payments - The Pink Book; International Trade in Services
Notes:
- The 'primary and utilities' category is defined as sections A, B, D and E in the UK Standard Industrial Classification (SIC) 2007; these sections broadly include agriculture, mining, and supply of utilities (electricity, gas and water). The 'other services' category is defined as sections O, P, Q, R and S; broadly including the public sector, arts, entertainment, recreation, and other services. For further details, please see UK Standard Industrial Classification of Economic Activities.
Download this chart Figure 2: Total value of Great Britain service exports by functional category
Image .csv .xlsThe category “other services”2 experienced the highest increase of 40.5%, from £2.6 billion to £3.6 billion between 2015 and 2016. This was followed by information and communication, with an increase of 18.9%. Two categories experienced an annual fall in service exports: construction decreased by 23.5%, and retail by 10.8% between 2015 and 2016.
In Figure 3 we use a tree diagram to explore the breakdown of each NUTS1 area and its constituent functional categories. We can clearly see almost half of service exports originate from London, as mentioned in Section 4. The largest functional categories of exports from London were £32.7 billion of financial services, followed by £19.8 billion of real estate, professional, scientific and technical services. Financial services was the largest functional category in 7 of the 11 NUTS1 areas, although in the South East and the East of England, real estate, professional, scientific and technical services was the largest category.
Figure 3: GB service exports by NUTS1 area and functional category
Embed code
The North West exported £18.3 billion services, almost one-quarter (£4.5 billion) of which came from the manufacturing industry, and this was the only NUTS1 area for which manufacturing was the top category. The three categories of manufacturing, financial and transport services accounted for more than half of exports of services from each of the North East, North West and Yorkshire and The Humber (covering the whole of northern England). Those three categories were the top three categories for the North West and Yorkshire and The Humber, and three of the top four categories for the North East (along with travel services).
Wales was the only NUTS1 area where insurance and pension services was the top category of exports of services, exporting £1.4 billion in 2016, with manufacturing services the second-largest category, exporting £1.2 billion, followed by financial services, exporting £1.0 billion. These three categories were the same top three categories of services Wales exported in 2015. In fact, the top three categories of six NUTS1 areas remained the same in 2016 as they were in 2015.
In this publication, we also examine the distribution of different functional categories across the NUTS1 areas through a heat map (Figure 4). London has a substantial share in the majority of functional categories, contributing more than 38% of the service exports in many categories but not for primary and utilities (4.0%), manufacturing (4.2%), nor insurance and pension services (21.5%).
Exports of primary and utilities services, which includes agriculture, mining and utilities, were mainly concentrated in Scotland, producing 63.1% of total service exports in this category. Exports of manufacturing services were mostly focused in the North West (26.6%) and the South East (16.7%), while most exports of insurance and pension services originated from the South East (23.0%) and London (21.5%). Transport services exports were largely focused in London, with 38.3% of the share, but elsewhere exports for this category were somewhat more evenly spread out, with 18.5% in the South East, 9.6% in the North West, 9.2% in the East of England and 8.0% in Scotland. The South East was the second-largest contributor to service exports overall, having the largest or second-largest share in 10 of the 13 categories.
Figure 4: Distribution of functional categories across GB NUTS1 areas
Embed code
It is also useful to analyse changes in values of service exports over the whole period 2011 to 2016. Overall, Great Britain service exports increased from £188.3 billion in 2011 to £251.2 billion in 2016, an increase of 33.4%. In terms of growth in service exports by NUTS1 area, the highest increase was seen in Scotland where service exports grew by 51.6%. This was followed by the North East (51.1%), Wales (45.1%), the West Midlands (44.5%) and the North West (42.2%), with the other six NUTS1 areas growing between 20% and 30%. These values have been calculated on a current price basis and therefore do not account for the effects of inflation.
Figure 5 shows the contribution each NUTS1 area made to the change in exports of services for each of the four selected categories between 2011 and 2016. Wholesale and motor trades was the only category to experience a decline in exports of services between 2011 and 2016. It fell by 33.6%, and this decline was driven largely by London, accounting for 70.9% of the change.
Figure 5: Contribution to growth of four functional categories by GB NUTS1 area
2011 to 2016
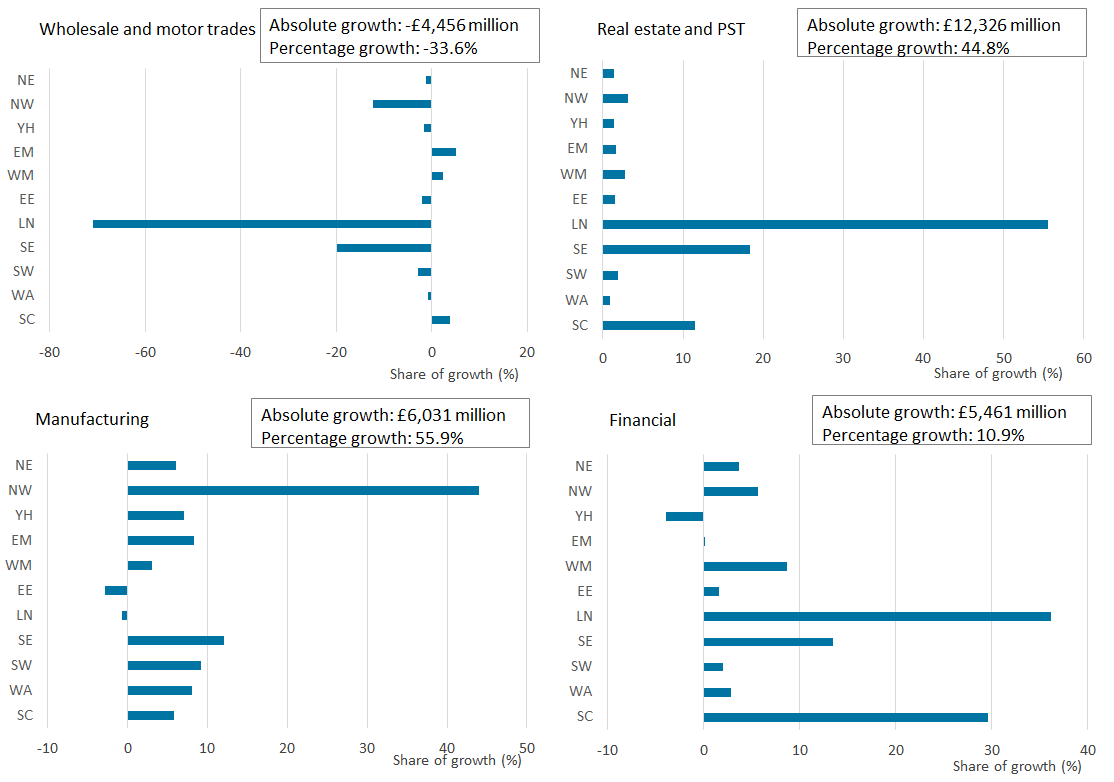
Source: UK Balance of Payments - The Pink Book; International Trade in Services
Notes:
The countries and regions have each been labelled with two characters in this graphic. These refer to: NE is the North East, NW is the North West, YH is Yorkshire and The Humber, EM is the East Midlands, WM is the West Midlands, EE is the East of England, LN is London, SE is the South East, SW is the South West, WA is Wales, and SC is Scotland.
The industries presented in this graphic are defined according to the Standard Industrial Classification 2007: SIC 2007 classifications. The category "Wholesale and motor trades" refers to divisions 45 and 46, "Real estate and PST" refers to sections L and M, and "Manufacturing" refers to section C. The category "Financial" refers to financial services as defined in the UK balance of payments.
Download this image Figure 5: Contribution to growth of four functional categories by GB NUTS1 area
.png (39.8 kB) .xlsx (12.8 kB)
For real estate, professional, scientific and technical services, London, the South East and Scotland contributed the most to the 44.8% growth in this category between 2011 and 2016. In contrast, the North West contributed more than 40.0% to growth in manufacturing, whereas London and the East of England contributed negatively to this category. Even though London has the largest share (36.1%) of the growth in exports of financial services, it is followed very closely by Scotland, which contributed 29.6% to the change.
Notes for: NUTS1 service exports by functional categories
Data for Northern Ireland by functional category are not included because selected categories had to be suppressed for reasons of confidentiality and reliability.
The category “other services” includes the UK Standard Industrial Classification sections O (public administration), P (health), Q (education), R (arts, entertainment and recreation) and S (other service activities).
6. NUTS1 service exports by product
For the first time, we have analysed service exports by product at the NUTS1 geographic level. In the context of this analysis, the term “product” specifically refers to the type of service that has been exported. The following product-level analysis is informative because it allows us to estimate the value of specific products that have been traded using information reported directly in the International Trade in Services (ITIS) survey. For example, from the functional category analysis, we know that the contribution of the manufacturing industry to total service exports was 6.7% in 2016, however, it would be useful to know the value of manufacturing services as a product. Moreover, a sector may be exporting products that may not directly align with the industry they belong to. For example, a firm in the retail industry may be exporting manufacturing services as a product, especially if the retailer is a diversified business.
Previously in this article, we analysed NUTS1 service exports by functional category, which are a combination of the Standard Industrial Classification 2007: SIC 2007 classifications from ITIS data and product or commodity information for finance, insurance, travel and transport products, which are not covered by ITIS. In this section, we solely focus on data from ITIS excluding the finance, insurance, travel and transport categories. Therefore, in value terms, the analysis in this section only includes 45.0% of total UK service exports and covers only Great Britain. Please note that although we have excluded finance, insurance, travel and transport categories from this analysis, there are certain related products such as postal and courier services and selected financial services excluding financial intermediation services indirectly measured (FSIM) that have been exported from different sectors that are captured in ITIS.
The product a business traded is reported directly within the ITIS survey at the organisational level. As mentioned in an earlier section, we present 28 product classifications (shown in Table 2 in the Appendix), which have been derived by aligning ITIS product codes from ITIS questionnaire returns with the Extended Balance of Payments Services (EBOPS) classification.
Figure 6 presents the value of different product categories in NUTS1 areas. Business services formed the largest product category for all NUTS1 areas in 2016, with exports of £64.5 billion (56.4% of all ITIS-based service exports). Most exports of business services, a little over 60%, came from London and the South East. Outside London and the South East, exports of business services were also prominent in Scotland and the North West (£5.7 billion and £5.6 billion respectively).
Telecommunications, computer and information services was the second-highest category for 7 of the 11 NUTS1 areas. For the North West, Wales and the East of England, the second-largest product category exported was charges for the use of intellectual property services. Manufacturing, maintenance and repair services was the second-largest product category in the North East.
Figure 6: ITIS-based service exports by product group and GB NUTS1 area
Source: Office for National Statistics – International Trade in Services
Notes:
- This chart includes only exports of services covered by the International Trade in Services survey. ITIS covers 45% of total UK exports of services.
- The products presented have been derived by aligning ITIS product codes from ITIS questionnaire returns with the Extended Balance of Payments Services (EBOPS) classification.
Download this chart Figure 6: ITIS-based service exports by product group and GB NUTS1 area
Image .csv .xlsIn terms of product subcategories, the most prominent subcategory within business services was professional and management consulting services. This subcategory includes services such as accounting, legal services, business and management consulting, and advertising services, and it accounts for around 42.9% of exports of business services. This was followed by technical services, which accounted for 14.1% of business services and is primarily driven by engineering services, but also includes architectural services, and other technical services. Research and development services was the third-largest subcategory within business services, accounting for 11.0% of exports of business services across Great Britain.
Figure 7 provides an interactive heatmap for selected product subcategories, to illustrate the share of each NUTS1 area in that category. This graphic shows that 41.4% of research and development services were exported from the South East, whereas 18.4% were exported from the East of England and 13.2% from London. Looking at the subcategories within professional and management consulting, London exported 84.9% of total legal services reported in the ITIS survey, while the remaining NUTS1 areas had a small share of less than 3% each. Accounting, auditing, bookkeeping, and tax consulting services were also predominately exported from London (61.2%), followed by the South East (9.4%) and the West Midlands (5.2%). Advertising services, which accounted for 5.6% of the service exports reported in the ITIS survey, was mainly exported from London (73.4%), followed by the South East (11.6%) and the North West (4.8%).
Figure 7: Share of selected product categories exported by each GB NUTS1 area
Embed code
Exports of construction services were fairly widely distributed across NUTS1 areas, where 23.2% of construction services were from London, followed by the South East (16.5%), Scotland (15.9%) and the North East (12.3%). However, some products were far more geographically focused, such as the subcategory of telecommunications services, which were predominately exported from London and the South East, exporting 75.9% in total of this product. All other NUTS1 areas had a share of telecommunication services exports at less than 6%. The subcategory "computer services" were a little less concentrated in London and the South East at 66.4% in total, but similar to telecommunications, all other NUTS1 areas had a share of this product category less than 7%.
Manufacturing services and maintenance and repair accounted for a 4.0% share of the service exports reported in the ITIS survey. These services consist of processing, assembly, labelling and packing of goods that are owned by another foreign business, as well as maintenance and repair work on goods that are owned by foreign residents. The South East was the prime exporting area for these services (30.4% of manufacturing services and maintenance and repair), followed by the North West (19.5%) and the North East (9.1%). All other NUTS areas had a share of less than 7%, with Wales exporting the lowest share of 2.9%.
For the full breakdown of the 28 products by NUTS1 area, please refer to the data published alongside this article. Having introduced products in this article, further analysis on products may involve examining which products are being exported from each industry to produce a full industry-by-product breakdown for different NUTS1 areas. This would establish the link between products and industry in greater detail.
Nôl i'r tabl cynnwys7. Further developments
These estimates remain experimental, but we are continuing development work. Based upon responses to the consultation we conducted in September 2017, and associated discussions, in the coming months we intend to:
- convert the current functional categories onto a fully industry basis
- generate further geographic breakdowns beyond the NUTS1 “regional” level
- ensure the service exports are fully consistent with the Pink Book and aligned with HM Revenue and Customs’ (HMRC’s) goods export statistics
- complete work on breakdowns of service exports by country of destination
This continued development of the NUTS1 estimates of service exports remains part of the Office for National Statistics (ONS) Devolution programme, and also part of the UK trade development plan. The current aim is to complete analysis toward creating an ongoing publication containing all the breakdowns and consistencies listed previously before April 2020, with a view to the completed suite of subnational outputs becoming official statistics thereafter. Other developments including alternative weighting methodologies and analysis of imports may form part of our analysis but these topics depend upon resourcing and outputs of other programmes.
In December 2016, HMRC made improvements to its Regional Trade Statistics methodology for goods exports, bringing it more in line with our estimates of service exports. However, users are advised to proceed with caution in comparing the two sets of export statistics. We continue to work with colleagues at HMRC in aligning our outputs even further.
We welcome feedback from users, through the statistical contact for this release, particularly suggestions toward improving the methodology or upon whether this approach meets user needs.
Nôl i'r tabl cynnwys8. Appendix: Functional categories and product classifications
Table 1 provides details of the functional categories used in analysis of service exports at NUTS1 level. These categories are defined using definitions from the Pink Book, and from the UK Standard Industrial Classification 2007: SIC 2007 classifications.
Table 1: Functional categories used in analysis of NUTS1 service exports
| Functional category | SIC07 section |
|---|---|
| Primary and utilities (agriculture, mining, utilities) | A, B, D, E |
| Manufacturing | C |
| Transport* | - |
| Travel* | - |
| Construction | F |
| Wholesale and motor trades | G (divisions 45 & 46) |
| Retail excl motor trades | G (division 47) |
| Information and communications | J |
| Real estate, professional, scientific and technical services | L, M |
| Insurance and pension services* | - |
| Financial* | - |
| Administrative and support services | N |
| Public admin, health and education; arts, entertainment and recreation; other services | O, P, Q, R, S |
| Sources: The Pink Book; UK Standard Industrial Classification | |
| Notes: | |
| 1. The categories shown above are UK Standard Industrial Classification 2007 (SIC07) sections used to analyse the ITIS and ABI data, excepting the categories indicated by an asterisk (*) symbol which are compiled on a product basis from the Pink Book. | |
Download this table Table 1: Functional categories used in analysis of NUTS1 service exports
.xls (33.8 kB)Table 2 provides a list of product classifications used in this analysis of International Trade in Services (ITIS)-based service exports at NUTS1 level. This classification has been built using the Extended Balance of Payments Services (EBOPS) classification.
Table 2: Product classification used in this analysis of ITIS-based NUTS1 service exports
| Product | EBOPS code |
|---|---|
| Manufacturing services on physical inputs owned by others | 1 |
| Maintenance and repair services n.i.e. | 2 |
| Postal and courier services | 3.4.11 |
| Construction | 5 |
| Insurance and pension services | 6 |
| Financial services excluding FSIM1 | 7.1.511 |
| Charges for the use of intellectual property n.i.e. | 8 |
| Telecommunications, computer, and information services | |
| Telecommunications services | 9.1 |
| Computer services | 9.2 |
| Information services | 9.3 |
| Business services | |
| Research and development services | 10.1 |
| Professional and management consulting services | |
| Legal services | 10.2.1.1 |
| Accounting, auditing, bookkeeping, and tax consulting services | 10.2.1.2 |
| Business and management consulting | 10.2.1.31 |
| Public relations services | 10.2.1.35 |
| Recruitment services | 10.2.1.37 |
| Property management | 10.2.1.32 |
| Advertising services | 10.2.2.2 |
| Other business & management consulting services | 10.2.1.33 |
| Technical services | |
| Architectural services | 10.3.1.1 |
| Engineering services | 10.3.1.2 |
| Scientific and other technical services | 10.3.1.3.2 |
| Waste treatment and de-pollution, agricultural and mining services | 10.3.2 |
| Operating leasing services | 10.3.31 |
| Other business services n.i.e. | 10.3.5 |
| Personal, cultural, and recreational services | 11 |
| Merchanting and other trade related services | |
| Merchanting2 | n/a |
| Other trade-related services | 10.3.41 |
| Notes: | |
| 1. ‘FSIM’ denotes Financial intermediation Services Indirectly Measured | |
| 2. Merchanting does not align to the EBOPS classification and is an adjustment made to the International Trade in Services (ITIS) survey. | |
| 3. The term 'n.i.e' denotes the phrase 'not included elsewhere'. | |
| 4. For further information on the EBOPS classification, please refer to | |
| https://unstats.un.org/unsd/tradeserv/TFSITS/msits2010/ebops2cpc.htm | |
Download this table Table 2: Product classification used in this analysis of ITIS-based NUTS1 service exports
.xls (39.4 kB)Manylion cyswllt ar gyfer y Erthygl
james.p.harris@ons.gov.uk
Ffôn: +44 (0)1329 44 4656