2. Executive summary
The Consumer Prices Index, including owner occupiers’ housing costs (CPIH), is used to measure consumer price inflation in the UK. It was introduced in 2013 as a more complete measure of inflation as it included owner occupiers’ housing costs (OOH), which make up a major portion of household budgets. In July 2017 the CPIH was re-designated as a National Statistic, after improvements to the OOH calculations and some other elements were made.
This report assesses the feasibility of calculating the CPIH at a regional level for the nine regions of England, and Wales, Scotland and Northern Ireland from existing data. A regional CPIH measure would provide valuable insight into the nature of how variable inflation rates are within the UK and the potential causes of inter-regional inflation differences. However, the major restriction is whether the currently available data sources for the CPIH lead to sufficiently reliable measures at the regional level.
A provisional regional CPIH is constructed using methods as close as possible to the national construction. The immediate challenges of a provisional regional CPIH are small sample sizes in the price-quote data, a modification of region-based weights within strata, and a lack of expenditure weights at the item level. Practical solutions to these challenges allowed for provisional measures to be calculated, which are presented and compared to the national CPIH measure. This comparison highlighted the problem of the small sample sizes, which lead to irregularities in the indices over time. An attempt to measure the reliability of the regional CPIH was made by estimating approximate confidence intervals of the indices, though not accounting for all the stages in the price collection design. The methods for this are also outlined in this report.
The study concludes that regional CPIH are not suitably reliable statistics when using methods currently utilised for the national CPIH. However, the regional CPIH does capture the general trends similar to that of the CPIH, which shows there is potential for it to be developed to be more useful. An investigation into alternative statistical methods is suggested to overcome the limitations of the smaller regional sample sizes. Such statistical methods, which may provide improved regional CPIH reliability, would be small-area estimation methods, smoothing methods and finite population corrections. Also, aggregating the available data in larger categories may provide more robust (but less sensitive) indices, and a provisional assessment of such an aggregation is presented.
Nôl i'r tabl cynnwys3. Introduction
Users of price statistics have for a long time suggested that regional indices of consumer prices would be valuable statistics in helping to understand how inflation varies across the UK, and whether there are important differences in regional inflation (RPI Advisory Committee 1971, Fenwick and O’Donoghue 2003, UK Statistics Authority 2013). The assumption has been that the number of price quotes is too small at a regional level to support the calculation of indices, and it has not been a sufficiently high priority to invest in additional price collection for this purpose. Some limited information on variation in regional prices has been made available through Office for National Statistics (ONS) publications on Relative Regional Consumer Price Levels (RRCPLs) (Wingfield et al. 2005, ONS 2011, ONS forthcoming). These publications have used information from additional price collections made every six years for the purposes of adjusting Purchasing Power Parity (PPP) statistics. PPP prices are collected in the capital city of the country, and a periodic exercise is undertaken to adjust to the whole country. RRCPLs show the differences in price levels between regions, but are not designed to show price change (inflation), and because of the methodology and differences in the weights, they cannot be used even for a once-every-six-years approximation to regional inflation.
Therefore the ONS has commissioned some work to investigate the potential for the existing consumer price collections to support the calculation of regional price indices, and that is the subject of this report. We will consider regional Consumer Prices Indices including owner occupiers’ housing costs (rCPIH), region-specific indices with definitions corresponding to CPIH, for each of the 12 regions of the UK.
This document explores the feasibility of rCPIH and introduces methods for rCPIH, highlighting particular challenges unique to the regional level as well as areas of future research. The methodology presented aims to be as close as possible to the national CPIH, with changes introduced only where the regional limitations make it necessary. Methodological differences between rCPIH and CPIH are needed due to limitations in data availability at the regional level. These data limitations can be split into two broad groups: limitations due to small sample sizes and limitations due to a lack of regional data sources. Consequentially, modifications must be made to the methodology to maintain the integrity of the rCPIH despite this limitation. The weaknesses of the methodology are discussed with suggested methods that aim to improve them. Lastly, attempts at estimating simple variances of the rCPIH are made to help identify the quality of the resulting indices at the regional level.
The rCPIH calculated here are Experimental Statistics, provided as part of the development process for the purposes of gathering feedback and for quality assurance. They are not fully developed statistics, and may be subject to changes. Therefore caution should be used when interpreting the indices, and they should not be used as the basis for decision-making in their current form.
Nôl i'r tabl cynnwys4. Methodology
Ideally, the methodology for regional Consumer Prices Indices including owner occupiers’ housing costs (rCPIH) should be kept as close as possible to the national CPIH. The conceptual framework for regional price indices is set out in Annex A, and we have attempted to follow these concepts wherever possible. However, some properties and availability of the data sources, and small sample sizes at the regional level, mean that divergent methods are required in some of the approaches.
National CPIH overview
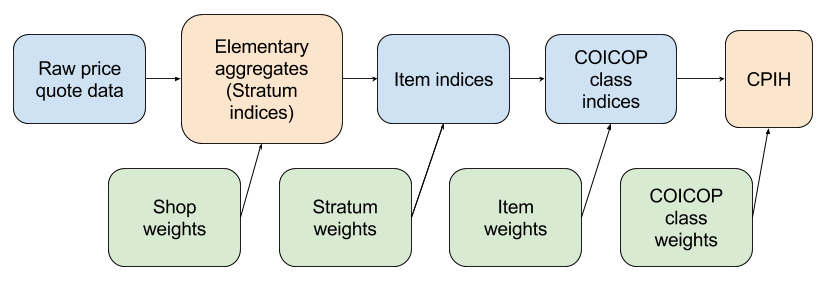
For a detailed explanation of how the national CPIH is constructed see the Consumer Price Indices Technical Manual 2014. A simplified summary of how the national CPIH is calculated is shown in Figure 1.
Figure 1: Calculation of the national CPIH
Source: University of Southampton, Office for National Statistics
Download this image Figure 1: Calculation of the national CPIH
.png (29.7 kB)
The national CPIH is based on an extensive price collection, covering prices from throughout the UK and online. The price-quote data provides the logarithm of the relative prices, which are weighted by the shop weights. Elementary aggregates are calculated as weighted geometric means of the relative prices within each stratum. These can also be thought of as stratum indices. The stratum level is based on variations by region and/or shop type (independent versus multiple). The weighted arithmetic mean of the elementary aggregates using the stratum weights gives the item indices.
Once the item indices have been constructed, the corresponding weights are required for further aggregation. These weights are proportional to the national consumption of the item and are derived from the national accounts expenditure data, Living Costs and Food survey (LCF) data, market research data and other sources including administrative data. Two further weighted arithmetic means are then calculated at the classification of individual consumption by purpose (COICOP) class level and then combined over all the classes to give the overall CPIH. It should be noted that there are various other processes involved in calculating the national CPIH, and this is merely an abridged description of the method.
Data sources for regional CPIH
CPIH indices rely on data sources for two distinct purposes. Firstly, the price-quote data that can be used to track price changes of items in the fixed basket of goods and services, and secondly, expenditure data so these prices can be weighted appropriately.
The price-quote data is available from the ONS website for all months as far back as January 2010. These price quotes are categorised by region hence it is feasible for the price quotes to be aggregated regionally. However, subdividing the data into regions leads to smaller sample sizes. Not all items are represented in the price-quote data because some are collected centrally by the ONS. Data on these items are available in the item indices data alongside the price-quote data. Approximately 55% of the basket is comprised of these centrally collected items. These item indices are not reported regionally like the price quotes, which means they cannot contribute toward any differences between regions in the final rCPIH. However, many of the centrally collected items have nationally fixed pricing so this is unlikely to be an issue.
Dividing expenditure data up at the regional level is not as straightforward because multiple data sources are involved. A significant limitation is that the national accounts expenditure data does not offer a regional breakdown, although this is an area of current research (ONS, 2016). A further limitation is that partitioning the LCF data regionally results in small sample sizes. Hence accurate regional-level expenditure data is not readily available. The ONS has identified this as an issue and methods to collect regional-level expenditure data are currently being investigated. Increases to the LCF sample size in Northern Ireland and Scotland are already being implemented. To assist in the immediate construction of rCPIH, regional-level expenditure data for each of the 87 COICOP classes has been provided. The suitability of these expenditure data as index weights will be assessed in a later section.
Limitations
To adapt the method for national CPIH to the regional level the limitations must first be considered. As mentioned, these limitations fall broadly into limitations due to small sample sizes, and limitations due to a lack of regional data sources. Since the regional CPIH data sources are different to the national data sources, different methods in the construction of the index must be considered. There are three broad methodological changes to consider for the rCPIH when adapting the national CPIH:
Small sample sizes
The price-quote data are collected using a sample design that is intended to give a representative and accurate estimate of the national price increases for different items. This means that the sample size at the national level is suitably large. In order to estimate price changes at each of the 12 regions, the price-quote data must be divided accordingly. Consequently, the sample size within each region is approximately one-twelfth of the national sample size. This reduction can lead to imprecise estimates of the price changes.
Improper stratum weights
The stratum weights are based on strata, some of which are dependent on the region. One of the purposes of the stratum weights in the national CPIH is to adjust for the differing purchasing patterns across regions and shop types. However, when constructing CPIH within regions, no adjustment for differences between regions is necessary. Hence the stratum weight for regional indices reduces to a shop-type weight.
No regional item weights
The item weights, and subsequently the higher-order COICOP class weights are primarily determined by the national accounts, which provide reliable estimates of total expenditure nationally. However, this fully balanced source is available only at a national level, and cannot currently be determined regionally. This is a major shortfall in information for accurately weighting the indices at the regional level. Despite this, methods for calculating CPIH consistent regional weights at the COICOP class level have been developed by the ONS. The class-level weights are not broken down by item, so these weights are unavailable at the regional level.
These three changes lead to an adjusted methodology for rCPIH as shown in Figure 2.
Figure 2: Calculation of the regional CPIH

Source: University of Southampton, Office for National Statistics
Download this image Figure 2: Calculation of the regional CPIH
.png (38.7 kB)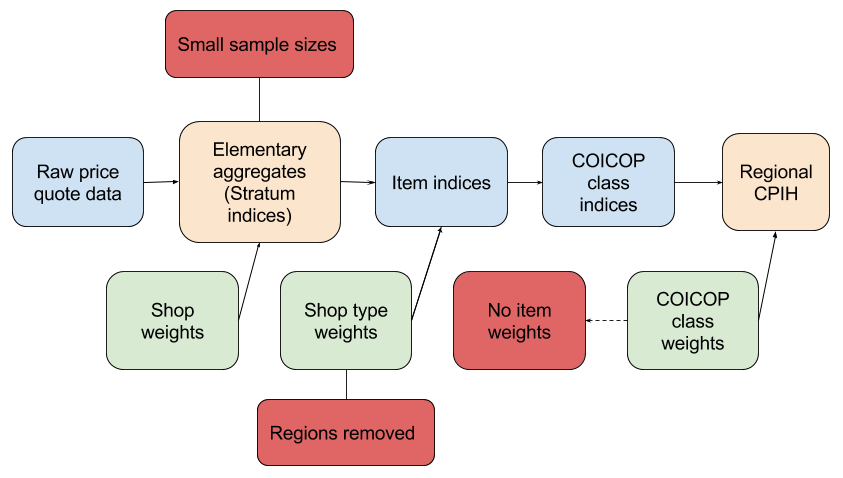
Although it is clear that these three limitations require approximations and therefore render the rCPIH less reliable than the national CPIH, the extent of this unreliability remains to be determined. To assess this a provisional rCPIH is proposed and constructed. This provisional rCPIH is initially constructed as simply as possible and its purpose is to:
- detail a framework of the methods required to construct the rCPIH
- outline areas of weakness in the feasibility and reliability of the rCPIH
- provide preliminary indices to quantify the differences in rCPIH between different regions in the UK
We reiterate that the constructed indices are provisional and so their accuracy and credibility are not assured.
Provisional regional CPIH methodology
To detail the methodology as well as the practical shortfalls of the available data, such as small sample sizes, the methods and some outputs are included together. This is also done due to the methods being so similar to the national CPIH, which is already methodologically well-described. The steps taken to construct the provisional rCPIH are outlined, with commentary on the issues that arise. A specific focus on rCPIH calculations for the arbitrary year of 2014 are used to highlight the explicit data shortfalls. As all years have similar sample sizes all will have very similar challenges. The rCPIHs for all years where price-quote data is readily available are constructed and chained together.
Calculating regional elementary aggregates
The first step is to collate the price quote and item indices data for each year. As mentioned, the item indices data are national-level indices but are still required as not all items are available in the price-quote dataset. Consequentially, the regional item indices cannot be calculated for these items with the data available, and so the national item indices are used. Of the 699 items listed in the 2014 item indices dataset, 538 items were available in the price-quote dataset, so regional versions can be calculated. This leaves 161 items (23.0%) that have only national series, and which will therefore not contribute to differences in indices between regions. Note that the 699 items account for 96.04% of the total weight, leaving just under 4% of items being unaccounted for. One of the more notable exclusions is Council Tax (2.5%), which is added separately after chaining as will be described. This leaves approximately 1.5% remaining that will not contribute towards the final index. For a more formal rCPIH these missing items should be included.
Before the 538 regional item indices can be calculated the elementary aggregates must first be calculated. These elementary aggregates are aggregated within stratum, and the geometric means of the relative prices are calculated, weighted by the shop weights (the geometric mean is used for all commodities in this construction, although the Dutot index would be used for some commodities in a true replication of the CPIH). Note that not all items have shop weights; around half of items making up 30% of the basket are not weighted by shop type. As with any statistic, the reliability of the geometric mean increases with the sample size, assuming the sample is unbiased. However, since the price-quote data has been divided by region there is a risk of small sample sizes, so it is important to assess this. The sample size of the regional elementary aggregates within each stratum are summarised in Table 1.
Table 1: Numbers of strata with 1, 2, …, ≥10 price quotes for each region in 2014
| Region | 1 | 2 | 3 | 4 | 5 | 6 | 7 | 8 | 9 | 10+ |
| London | 108 | 202 | 143 | 281 | 460 | 503 | 463 | 411 | 364 | 6194 |
| South East | 184 | 327 | 338 | 250 | 241 | 276 | 253 | 147 | 152 | 6961 |
| South West | 157 | 215 | 316 | 464 | 565 | 291 | 402 | 435 | 459 | 5525 |
| East of England | 483 | 412 | 259 | 412 | 328 | 257 | 313 | 348 | 270 | 5874 |
| East Midlands | 415 | 363 | 174 | 164 | 251 | 384 | 486 | 670 | 923 | 4762 |
| West Midlands | 505 | 496 | 382 | 326 | 343 | 444 | 526 | 425 | 672 | 4795 |
| Yorkshire and The Humber | 281 | 373 | 329 | 223 | 275 | 423 | 298 | 499 | 658 | 5567 |
| North West | 482 | 502 | 392 | 360 | 210 | 173 | 111 | 182 | 288 | 6363 |
| North East | 702 | 637 | 537 | 535 | 967 | 1790 | 431 | 212 | 215 | 2569 |
| Wales | 1073 | 293 | 354 | 360 | 704 | 1377 | 1070 | 361 | 162 | 2703 |
| Scotland | 696 | 307 | 183 | 265 | 214 | 234 | 222 | 221 | 380 | 5308 |
| Northern Ireland | 452 | 912 | 879 | 1369 | 1511 | 642 | 377 | 278 | 307 | 1930 |
| Total | 5538 | 5039 | 4286 | 5009 | 6069 | 6794 | 4952 | 4189 | 4850 | 58551 |
| Total percentage | 5.3% | 4.8% | 4.1% | 4.8% | 5.8% | 6.5% | 4.7% | 4.0% | 4.6% | 55.6% |
| Source: Office for National Statistics | ||||||||||
Download this table Table 1: Numbers of strata with 1, 2, …, ≥10 price quotes for each region in 2014
.xls (28.2 kB)Clearly there are large numbers of strata that have extremely small sample sizes, with a large proportion with only one observation. The majority of these strata with small sample sizes are for quotes from independent shops. Obviously the geometric mean of very small samples is not very reliable, and furthermore, estimated variances are even less reliable. This problem is perhaps the biggest limitation in constructing the rCPIH. Although it is inadvisable to do so, for the purposes of this provisional CPIH the small sample sizes have been treated as if they are satisfactory and the regional elementary aggregates are used.
With the elementary aggregates now calculated the item indices can then be calculated by taking the arithmetic mean weighted with the shop-type weights. These shop-type weights are merely the stratum weights with the regional weights ignored. With the 538 regional item indices calculated, the 161 national item indices not represented in the price-quote data can then be added to give the full set of item indices required to proceed to calculate COICOP class indices (except for the 4% not provided).
The next step is to calculate the next level up, which is the regional COICOP class indices. However, as mentioned, the item weights are not available at a regional level, but only at the class level. In order to deal with this problem the proportion of the item weights wk within each class weight wc was calculated at the national level:
The regional item weights
This ensures that the item weights sum up to the class weight for each region. Ideally, item weights at the regional level would be used.
With the item indices as well as the weights all calculated it is then possible to derive the COICOP class indices and also the unchained 2014 rCPIH for each region. This process can then be replicated for the years 2010 to 2017 where price-quote data was readily available. The rCPIH can then be chained together according to the Consumer Price Indices Technical Manual 2014, and with January 2010 set to 100 for all regions.
Once chained at the COICOP class level, two additional classes are required to be added. Firstly the national Council Tax (40900) indices can be added. It is assumed here that this index is the same across all regions, although in a more detailed calculation, regional differences in Council Tax should be accounted for. The second class is for the owner occupiers’ housing costs (40200), which is a very influential class making up approximately 17% of total national expenditure in the CPIH basket. It is also important for regional CPIH because of the expectation that this will vary substantially between regions. In order to capture the differences in the price changes for this class among regions, the Index of Private Housing Rental Prices was used as a proxy measure. This provides regional-level indices except for Northern Ireland. The national indices for the 40200 class were used for Northern Ireland, which may not represent the price changes particularly well. With these two classes added to the chained COICOP class indices, the chained rCPIH can then be calculated.
Assessing the regional CPIH
We consider two ways of assessing the performance of the provisional rCPIH:
Estimating the variance and confidence intervals of the rCPIH – the lower the variance the less uncertainty.
Comparing the regionally weighted average of the rCPIH to the national CPIH – if they are similar then the rCPIH provides an accurate breakdown of the CPIH in different regions.
The second assessment is relatively trivial compared with the first where variances must be estimated. The estimation of variances for consumer price indices accounting for all the sampling and weighting procedures is very challenging, and is an open research topic (O’Donoghue 2017). We therefore use a simplified approach to calculating variances in order to be able to make an initial assessment of the quality of the regional indices. Part of this simplification is assuming that the weights are fixed, hence variability is only incorporated from the price changes. Accounting for the variability in the weights increases the variance estimates, ranging approximately from minimally up to a one-third increase (O’Donoghue 2017).
Estimating variances
Let Ii,t be the elementary aggregate or the i-th stratum index. These elementary aggregates are weighted geometric means of the relative increase of the price for a given month t compared with the base price, weighted by the shop weights Ws. The relative price is denoted by x=Pt / Po, and the elementary aggregates are calculated using:
Estimating the variance of the elementary aggregates can give valuable insight into the effect of the reduction in the sample size on one component of the regional indices. It allows approximate confidence intervals to be calculated so that the prices in different regions can be compared sensibly. It can be shown that:
where ni is the sample size of the i-th stratum, and
Note that Xlnx is the sample mean of the natural logarithm of the relative prices in the strata. When the sample size was one, the estimated variance was assumed to be the median of the variance of all other items across all regions. This is likely to substantially underestimate the variance, but it provides a proxy variance estimate for the purposes of the provisional CPIH.
With the elementary aggregates and corresponding variances now available at the stratum level, the item-level variances can then be derived. Let Itk be the item index of the k-th item in month t where
and wi are the stratum weights for each stratum index. If we assume that the weights are fixed, the variance can then be calculated as:
The variances of the item indices not represented in the price-quote data are approximated by taking the variance over previous months’ item indices. All available prior item indices were used to estimate the arithmetic variance. Other, more detailed estimation approaches may provide better estimates, but this gives an initial estimate suitable for assessing the quality of the approximate provisional rCPIH. A comparison of these variances to the variances from the price-quote data using the 2014 data shows reasonably similar values, which supports the use of this approximate method:
Item index variances:
| Item index variances: | Mean | Min | 1st Qu. | Median | 3rd Qu. | Max |
|---|---|---|---|---|---|---|
| From price quote | 29.4 | 0 | 2.3 | 10.3 | 29.5 | 8,323.30 |
| From retrospective data | 33.3 | 0.05 | 5.2 | 14.6 | 31.9 | 1,239.40 |
| Source: Office for National Statistics | ||||||
Download this table Item index variances:
.xls (26.6 kB)The class indices ItC are calculated using the item weights Wk:
and the variance can be calculated in the same way as the item indices. The variances for the two added classes for Council Tax and owner occupiers’ housing costs are calculated from the retrospective series back until 2010. The same variance is used for all years.
Lastly the rCPIH is calculated using class weights Wc:
and variances calculated again using the same formula as above except at the class level instead of the stratum level. The variances are assumed to be unaffected by the chaining though this is an area for future research.
We know that the expenditure weights at the different levels are derived from survey sources, but with other data sources and processes used to calculate the final weights. The sampling variation in the survey would therefore be expected to contribute some variability in the weights. O’Donoghue (2017) undertook some analysis that suggests that variation in the weights may contribute to a standard error of around 0.1 index points in the Consumer Prices Index (CPI) and Retail Prices Index (RPI).
Provisional regional CPIH findings
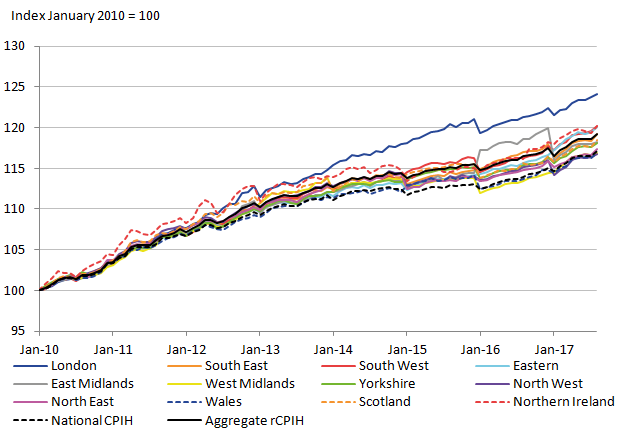
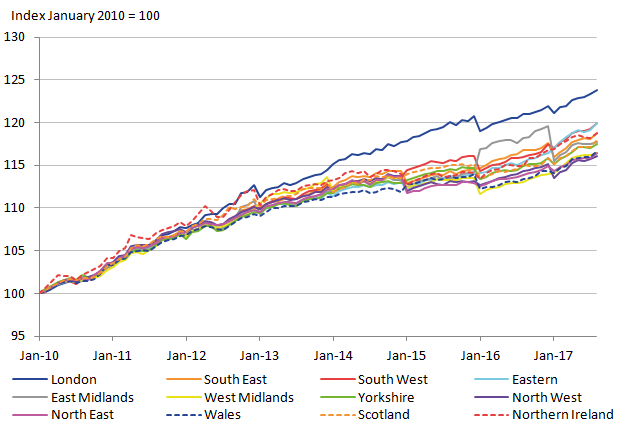
The provisional chained regional CPIH series are shown in Figure 3.
Figure 3: Provisional regional CPIH for 2010 to 2017
UK

Source: University of Southampton, Office for National Statistics
Download this image Figure 3: Provisional regional CPIH for 2010 to 2017
.png (34.7 kB) .xls (49.7 kB)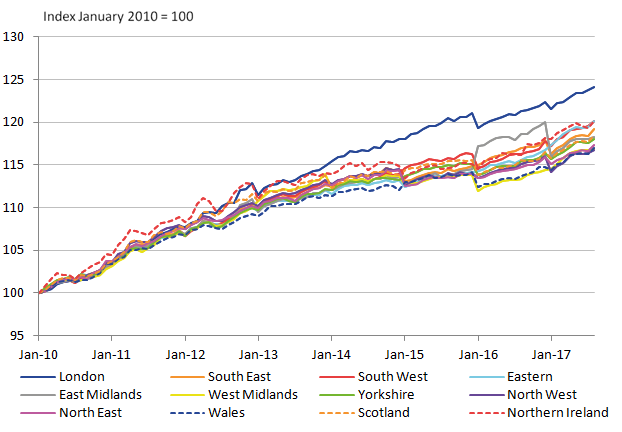
This figure broadly shows the regions following a similar trend in price levels over the years, except for London, which diverges around 2014. Also the Northern Ireland (NI) rCPIH is noticeably larger than most other regions between 2010 and 2015.
There are clear irregularities in the series that highlight the shortfalls in the provisional construction of the regional CPIH. These irregularities also highlight the need to ensure improved methods to ensure regular and reliable rCPIHs can be constructed in the future. The most distinctive irregularity in the series is in 2016 when there is a step change decrease for some regions, with the exception of the East Midlands, which increases. The cause of this irregularity can be largely explained by the education (100000) class, and removing it makes for a far less irregular series (as shown in Figure 4).
Figure 4: Provisional regional CPIH for 2010 to 2017 – with education removed
UK
Source: University of Southampton, Office for National Statistics
Download this image Figure 4: Provisional regional CPIH for 2010 to 2017 – with education removed
.png (33.8 kB) .xls (49.7 kB)
The education COICOP class nationally made up 1.7% of expenditure in 2017 so it is certainly unexpected that it should have such a large impact on the rCPIH. A closer inspection shows that the indices are rather high for education, but also that the change in the weight is irregular, for East Midlands the weight changes from 24.5 in 2015 to 59.4 in 2016 and then back down to 18.5 in 2017. This irregularity highlights the issues that can come with small sample sizes, and the potential benefits that methods such as smoothing can have.
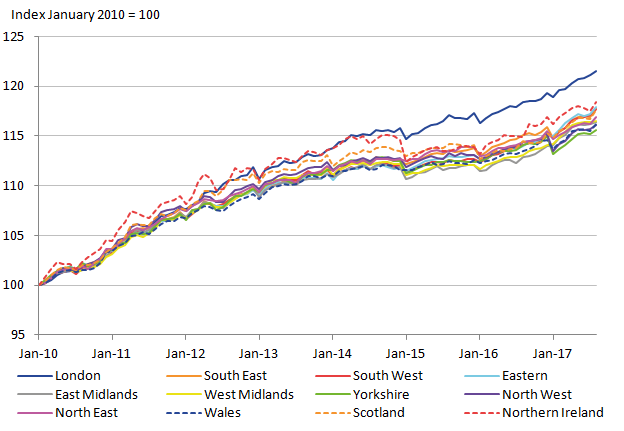
To assess how closely these rCPIH trends follow the national trend, the national CPIH is added using values from the CPIH time series dataset. Additionally, an aggregate rCPIH is also added that weights the regional CPIHs based on respective population sizes. Ideally these two lines should be similar, although deviations can be expected due to simplifications of the methodology for the provisional rCPIH.
Figure 5: Provisional regional CPIH for 2010 to 2017 with added national CPIH
UK
Source: University of Southampton, Office for National Statistics
Download this image Figure 5: Provisional regional CPIH for 2010 to 2017 with added national CPIH
.png (35.3 kB) .xls (53.2 kB)
The two national indices follow very similar patterns. However, there is a divergence in the level that suggests that the rCPIH is not effectively capturing the movement of the national CPIH. The divergence only noticeably occurs between 2011 and 2015, and the cause of this divergence remains to be explored. It is likely to be a result of the small sample sizes caused by the subdividing of the available data.
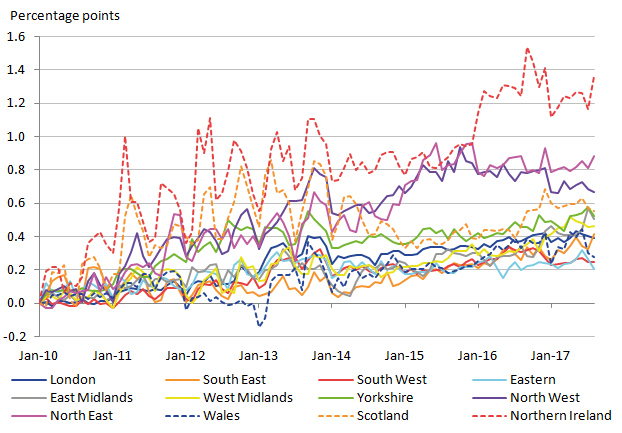
With the provisional rCPIH calculated, the regional inflation rates (the 12-month change in the rCPIH) can also be calculated. These are shown in Figure 6, along with the national inflation rates reported on the ONS website.
Figure 6: Provisional regional CPIH inflation rates for 2010 to 2017
UK
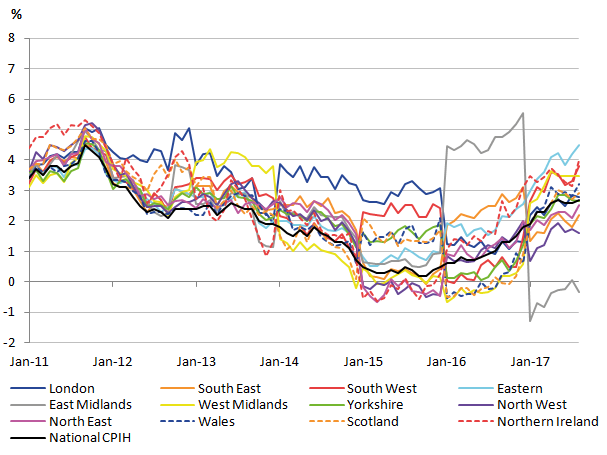
Source: University of Southampton, Office for National Statistics
Download this image Figure 6: Provisional regional CPIH inflation rates for 2010 to 2017
.png (62.1 kB) .xls (48.1 kB)
Again, the provisional regional inflation rates reveal the irregularities already highlighted in Figure 4. The irregularities are perhaps even more pronounced, but there are similarities in the overall trends between the national and regional CPIHs.
The approximate variances of the rCPIH can be used to derive 95% confidence intervals for the indices that give a general idea about the level of variability associated with them. It should be noted that the variances are underestimates due to assuming that the weights are fixed, and from the underestimate of the variance when the sample size was one. Hence the confidence interval should be interpreted almost as a best-case demonstration of the level of variability that would be expected in a fully developed rCPIH. Figure 7 displays the rCPIH with the corresponding 95% confidence intervals; the aggregate rCPIH indices are included as a point of comparison.
Figure 7: Provisional regional CPIH for 2010 to 2017 with 95% CIs compared to the aggregate rCPIH
UK
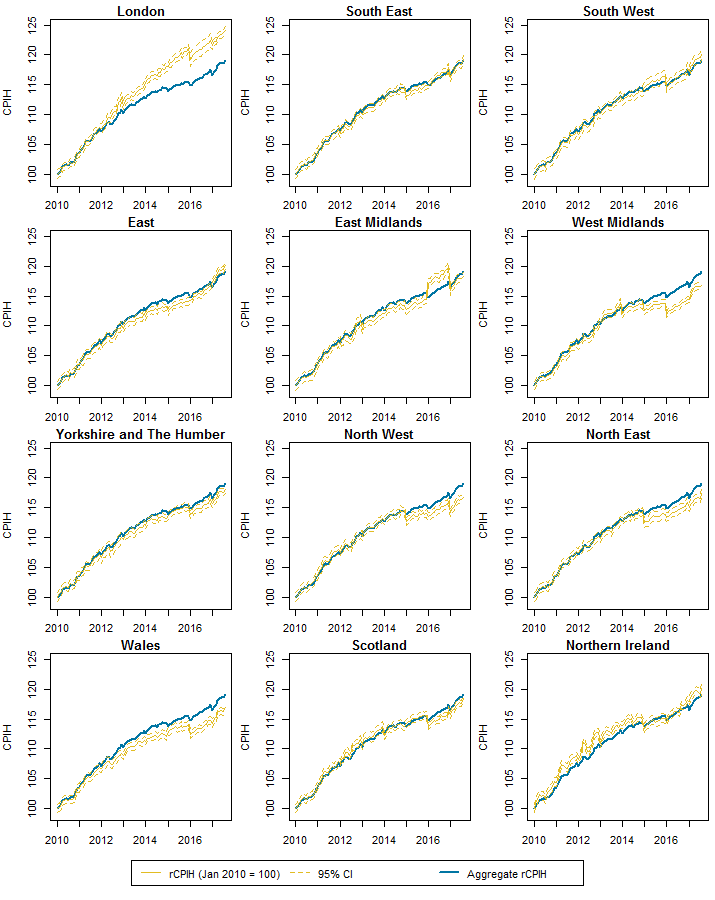
Source: University of Southampton, Office for National Statistics
Download this image Figure 7: Provisional regional CPIH for 2010 to 2017 with 95% CIs compared to the aggregate rCPIH
.png (24.3 kB) .xls (71.7 kB)
Post-analysis
In order to get an understanding of what caused the differences between the 12 regions, a post-analysis is conducted. This can help ascertain which aspects of the basket cause the biggest regional differences. The final month presented is August 2017. This month is examined more closely to find which COICOP classes contributed the most towards deviations of the regional indices from the regionally weighted rCPIH, which acts as a national comparator on the same methodology. The total deviation between the regional and national CPIHs caused by each COICOP class is depicted in Figure 8, with a difference of zero indicating a similar contribution to the rCPIH and the national CPIH.
Figure 8: Differences in regional and national CPIH for each COICOP class
UK
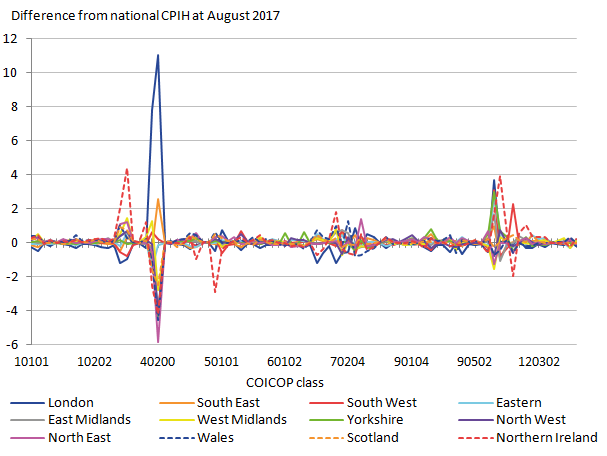
Source: University of Southampton, Office for National Statistics
Notes:
- The graph shows the difference from national CPIH for each COICOP class (x axis). The graph labels only show a small number of COICOP classes but the chart download contains all the relevant information.
Download this image Figure 8: Differences in regional and national CPIH for each COICOP class
.png (37.6 kB) .xls (48.6 kB)
As would be expected, the class that has the most significant effect on regional differences is the owner occupiers’ housing costs (40200), as well as actual rentals for housing (40100). For these two classes London price levels are significantly higher than the national ones, whereas most other regions except the South East and South West are below the national amount. A few other classes show substantial deviations from the national, including tobacco (20200), clothes garments (30102), transportation costs (70***), education (100000) and catering services (1101**). Northern Ireland shows particular peaks in tobacco, clothes garments and catering services, and troughs for Council Tax and accommodation services. The South West region is substantially higher for accommodation services.
Nôl i'r tabl cynnwys5. Options for future extensions to rCPIH methods to improve quality
To summarise, the main challenges of constructing the regional Consumer Prices Indices including owner occupiers’ housing costs (rCPIH) are:
- item indices collected centrally which do vary regionally are not reported regionally hence national indices must be used
- national accounts data are not currently available at a regional level
- within strata there are very small sample sizes including many (around 5% of all inputs to rCPIH as constructed here) with only one observation
- there are no item data for approximately 1.5% of the total expenditure
- item weights not available at the regional level, hence must be approximated based on national proportions of regional classification of individual consumption by purpose (COICOP) class weights
- Index of Private Housing Rental Prices used as a proxy measure for COICOP class owner occupiers’ housing costs (40200), which does not include Northern Ireland (national indices used for Northern Ireland as a proxy)
- regional weights at the COICOP class level exhibit irregularities over time that lead to erratic regional CPIHs
- variances of the item indices not included in the price-quote dataset are estimated from the temporal variation in using the national item indices (rather than using the component quotes)
In the following section there are some recommendations on how to overcome the challenges and proceed in improving the reliability of the rCPIH.
Overcoming small sample sizes
The problem of small samples sizes has demonstrably been a substantial limitation to developing reliable rCPIHs. However, there are various methods that can improve this.
Increase sample size
One obvious approach is to extend the price collection so that it gives adequate samples in each region, though this may not be practical due to resource constraints. If there is a possibility of some increases in sample sizes it is useful to know how to focus them where they are most beneficial. Using the methods presented on estimating the variances of item indices, the variances can be used to identify where increased samples will contribute most in reducing the variance. This could be in certain items, shop types or certain regions.
Population correction
A significant cause of very small sample sizes is within independent shops. However, in some regions there may be very small numbers of independent shops that sell the selected item, hence a small sample is understandable. By knowing the population of the shops that sell an item, the uncertainty around the item index can be greatly reduced, leading to more reliable indices.
Aggregate data
If data are aggregated within larger groups, the sample size of the larger group will naturally be larger too. There are two feasible ways in which data aggregation can be applied to rCPIH. Firstly, the elementary aggregates can be calculated at the item level instead of the shop-type level. This essentially pools together the shop types at the expense of losing the shop-type weights and therefore some of the specificity of the index. As the independent shops are a major cause of the very small sample sizes, pooling these with the multiple shops increases the sample sizes noticeably. The sample sizes for the new elementary aggregates within item levels for 2014 improve considerably, as shown in Table 2. Over 80% now have a sample size of 10 or over, compared with 55.6% when aggregated at the stratum level.
Table 2: Numbers of item levels with 1, 2, …, ≥10 price quotes for each region in 2014
Price quotes 1 2 3 4 5 6 7 8 9 10+ London 0 4 6 15 41 45 61 41 51 6027 South East 0 1 5 11 42 33 55 10 15 6119 South West 0 3 16 45 47 53 73 77 182 5795 East of England 0 0 11 13 31 72 102 44 56 5962 East Midlands 0 2 19 36 66 160 166 254 482 5093 West Midlands 1 3 13 41 68 112 211 207 374 5249 Yorkshire and The Humber 1 9 14 36 42 64 65 117 198 5733 North West 0 10 17 46 68 47 29 42 85 5947 North East 18 39 80 205 623 1128 474 299 286 3138 Wales 27 20 65 127 349 812 851 451 226 3351 Scotland 5 10 17 52 69 90 93 131 273 5550 Northern Ireland 19 108 272 649 1120 489 372 383 416 2449 Total 71 209 535 1276 2566 3105 2552 2056 2644 60413 Total percentage 0.1% 0.3% 0.7% 1.7% 3.4% 4.1% 3.4% 2.7% 3.5% 80.1% Source: Office for National Statistics Download this table Table 2: Numbers of item levels with 1, 2, …, ≥10 price quotes for each region in 2014
.xls (28.2 kB)With the sample sizes considerably better, it is important to assess what difference this makes to the rCPIH and the variances. Figure 9 shows the resulting regional CPIH, which in comparison to Figure 4 is very similar. To assess the differences between the two indices in more detail the rCPIH for the item-level elementary aggregates are subtracted from the rCPIH aggregated at the stratum (shop type) level, shown in Figure 10.
Figure 9: Provisional regional CPIH for 2010 to 2017 – elementary aggregates at item level
UK

Source: University of Southampton, Office for National Statistics
Download this image Figure 9: Provisional regional CPIH for 2010 to 2017 – elementary aggregates at item level
.png (32.2 kB) .xls (50.2 kB)Figure 10: Differences between the rCPIH when constructed from elementary aggregates at the item level compared to the stratum level
UK
Source: University of Southampton, Office for National Statistics
Download this image Figure 10: Differences between the rCPIH when constructed from elementary aggregates at the item level compared to the stratum level
.png (62.5 kB) .xls (50.2 kB)All regions except Northern Ireland deviate by less than one index point (equivalent to around 1%). This shows that the overall effect on the rCPIH is not very severe, which suggests aggregating at this higher level may be beneficial.
To compare the impact that the aggregating has on the variance, the percentage decrease in the variance is shown in Figure 11. Before 2014 there are mostly decreases in the variance due to the higher level aggregation. However, after this there is not much difference, with no strong evidence of a decrease at all. The decrease in variance may be underestimated due to there being far fewer item-level elementary aggregates with a sample size of one.
Figure 11: Percentage decrease (or increase) in variance due to elementary aggregation at item level
UK

Source: University of Southampton, Office for National Statistics
Download this image Figure 11: Percentage decrease (or increase) in variance due to elementary aggregation at item level
.png (48.8 kB) .xls (50.2 kB)Further analysis of the differences between these two aggregation levels is needed to explain this pattern in the variances.
A second form of aggregation can be over time, for example, aggregating monthly data and hence reporting on the indices quarterly. This may be problematic as it will not align with the national CPIH, and also the price changes would not exactly be quarterly since prices are sampled within each month. The resulting index would be an average quarterly price index rather than a point-in-time index, which is closest to the concept of CPIH. Some additional “temporal” collections do however take place so that this can approximate a monthly average index nationally. This would require further research to overcome this problem; however, the sample sizes would all increase by a factor of three, and hence the variances of the elementary aggregates would decrease by a factor of three.
Small-area estimation
Small-area estimation (SAE) utilises statistical methods to borrow strength from a population-level data source to improve estimates of subregions within the population. SAE is most effective when the data source is a reliable population data source such as a census, and when strong predictors are available within each region.
For the price quotes it is difficult to utilise the beneficial aspects of SAE. This is because the sampling units are shops. Hence in order to effectively use SAE, comprehensive and informative data about the shop or price population would be required. This could include population numbers of shop types (independent and multiple) by region, number of supermarkets, and perhaps even these numbers per division or class. An assessment of available shop data could help determine whether it is possible to use SAE to improve estimates of the regional price increases per item.
SAE has more potential to be useful for expenditure data. This is mainly because the sampling unit for expenditure data is households, about which there is plenty of national and regional data available due to the census. By primarily using the Labour Costs and Food Survey (LCF) as the sample expenditure data, improved estimates of the expenditure by regions can be made using SAE. This requires the predictive potential for some data items such as household types, total salary, total expenditure, household ages and number of children. The national-level data for these items can be used in combination with the LCF data to get improved estimates of the expenditure for each item or class. Recent methods have been developed that aim to estimate proportions of expenditure for various items within subregions of a population (Scealy and Welsh 2017). Applying similar methods may bring about estimated regional expenditure weights for the rCPIH with smaller variances and less change from year to year, which would lead to less irregularities and smoother indices. These approaches remain to be tested.
Smoothing
Making use of the longitudinal nature of the data can provide methods for smoothing the regional price quotes and expenditure in a way that allows for less erratic estimates. An investigation into smoothing methods could lead to less irregular indices, at the expense of reduced sensitivity to more recent changes.
Further recommendations and next steps
Improving the reliability of the regional CPIH could always be done one way or another at greater or lesser cost. This raises the question of where the limit of the required reliability for such indices lies. Through specifying criteria and standards for the quality and reliability of the rCPIH, a goal can be set. This will also provide criteria to use to determine whether the rCPIH has developed sufficiently to meet users’ needs.
Some more immediate critical analysis of the provisional methods used in this document would also be beneficial, including:
- investigating the assumptions of the provisional rCPIH such as using national item indices when not available in the price-quote data. The consequences of these assumptions can be explored
- explore what contributed towards the divergence between the regionally weighted rCPIH and national CPIH in Figure 5.
6. Summary
It is possible to construct regional Consumer Prices Indices including owner occupiers’ housing costs (rCPIH) series from the available data sources. The basic patterns in the series are similar to those in the national CPIH. The individual rCPIH differ in ways that could be expected, for example, with London prices increasing at a greater rate than other regions, driven primarily by housing. Although these provisional rCPIH are somewhat useful, the reliability of specific components of the data and procedures is generally low. Small sample sizes create a great deal of irregularities and uncertainty in the indices as measured by approximate variances, which is the crux of the problem.
The estimates of the confidence intervals offer an insight into the uncertainty and perhaps a foundation for improved methods to capture the uncertainty around the indices. However, the variance estimates themselves are also approximate and are likely to underestimate the true variance of the indices. So although it has shown to be feasible to construct regional CPIHs, considerable further development would be needed to ensure that the rCPIH can reliably represent the inflation within each of the regions.
References
Fenwick, D and O’Donoghue, J (2003) Developing estimates of relative regional consumer price levels
O’Donoghue, J (2017) ‘The effect of variance in the weights on the CPI and RPI’ Survey Methodology Bulletin 77 1 to 27
Office for National Statistics (ONS) (forthcoming) ‘UK Relative Regional Consumer Price levels for Goods and Services for 2016’
ONS (2011) UK Relative Regional Consumer Price levels for Goods and Services for 2010
ONS (2014) Consumer Price Indices Technical Manual, 2014 Edition
ONS (2016) The feasibility of producing regional household final consumption expenditure, UK: 2016
RPI Advisory Committee (1971) ‘Proposals for retail prices indices for regions’ Cmnd 4749, HM Stationery Office, London.
Scealy, J and Welsh, A (2017) ‘A Directional Mixed Effects Model for Compositional Expenditure Data’, Journal of the American Statistical Association, 112, 24 to 36
UK Statistics Authority (2013) Statistics on Consumer Price Inflation- Assessment Report 257
Wingfield, D, Fenwick, D and Smith, K (2005) ‘Relative regional consumer price levels in 2004’ Economic Trends, 615, 36 to 45
Nôl i'r tabl cynnwys
7. Annex A
Regional CPIs - conceptual basis and options for construction
Paul A Smith, S3RI, University of Southampton
Introduction
In order to have a sound basis for the methodology of regional consumer price indices, it is important to set out the variations in the conceptual framework from the calculation of a national CPI. This document starts that process, by addressing the elements that are related to regions and highlighting issues with regional boundaries (which may be considered by analogy with national boundaries, but are typically much more porous to trade). We will set out a target concept that we would ideally like to cover, though in most cases there will not be a data source that follows this definition sufficiently precisely. So we will consider the options for data sources, how close they come to the concept required, and therefore what the best approximation to the ideal definition of a regional consumer price index is.
Because there will in general be no ideal data source, it will be very difficult to quantify the approximation error in the calculation of regional consumer price indices, but we will attempt a broad brush description of these errors, and make an assessment of their effects on the interpretation of the experimental indices.
Basic structure
The Consumer Prices Index (CPI) is a fixed basket index where a range of goods and services (the “basket”) is priced each month. The expenditure shares on items in the basket are adjusted for various quality issues (such as coverage) and by balancing through the national accounts. They are then price updated (for January, price updating is to the latest December and for February to December it’s to the latest January) and used to weight the price information together. The basket is updated each year, and the 13-month-long segments of monthly prices are joined together by chain-linking. The current implementation of the UK CPI involves a double chain-link in December and January, which (from March 2017) is price updated in a manner that makes it consistent with a single chain-link (from February’s index).
CPIH or CPI?
In commissioning this work, Office for National Statistics (ONS) has asked for it to be undertaken with Consumer Prices Index with owner occupiers’ housing costs (CPIH), which is their lead measure. CPIH is expected to show more regional variation than CPI because of the differences in housing costs between regions.
Regional indices
Price levels or price changes
Regional price levels have been produced a few times (Baran and O’Donoghue 2002, ONS 2011), and involve comparing price levels across regions – a spatial index. This was also the focus of other reviews of regional prices (RPI Advisory Committee 1971, Fenwick and O’Donoghue 2003), and shows the relative costs of a fixed basket of goods and services in different regions. Many prices are expected to vary rather little by region, and some prices that are set more or less nationally may not vary at all (for example, mail order prices). A few commodities may behave very differently in different regions, and chief amongst these is housing. This would not be needed for a CPI-style index, but would by very important (and a major component of regional differences) in a CPIH-style index.
The existing publication on Relative Regional Consumer Price Levels (RRCPLs) is derived from the information used in the six-yearly benchmarking of the Purchasing Power Parity (PPP) series. PPP price quotes are collected only from the capital city (mainly on cost grounds, but also because they include items for which quotes are difficult to source), and every six years a separate exercise is undertaken to rescale these series to be representative of the prices across the country. The information used in this rescaling also gives estimates of regional price levels for a fixed, national basket of goods and services, excluding housing costs (neither owner occupiers’ costs nor property rents are included). They use regional weights for the aggregation of the 111 basic headings, derived from the Living Costs and Food Survey, reflecting at least part of the differences in expenditure patterns by region.
The regional price levels are produced by imposing transitivity on the calculated indices, to produce a set of regional indices that can be satisfactorily compared (for an overview see ONS 2011, Annex 2).
An alternative approach, also considered by the RPI Advisory Committee (1971) is to produce a temporal price index in each region. In effect this means replicating the production of the CPIH in each region, and the conceptual challenges outlined in this article apply more to this type of index. The RPI Advisory Committee thought that such indices could be produced annually (for London, Wales, Scotland and Northern Ireland) with some additional price collection.
In this project we take the challenge to be one of constructing experimental regional temporal price indices, that is, measuring the difference in the rate of inflation in each region. It should be made clear that such indices will not produce information that is suitable for comparing price levels between regions. In order to have both regional inflation and regional levels, it will be necessary to produce two types of index.
Regional basket
The starting point for a regional price index should be the regional basket of goods and services. The national basket is derived from the Living Costs and Food Survey (LCF) together with a range of other sources, taking the products (COICOP-4 up to January 2017 and COICOP5 from February 2017) with the largest proportion of expenditures (broadly speaking, other factors such as expenditure trends are also considered). The maximum threshold is set at one part per thousand (ppt) according to the EU regulation 1687/98 on HICP.
The UK implementation, however, uses a lower threshold such that categories with a minimum national expenditure of £400 million per year are always included unless they are satisfactorily represented by other items, and items with expenditure less than £100 million are not normally included (Gooding 2016). Commodities between these values are reviewed to consider whether their pattern of sales suggests that they are emerging and should be added to the basket or waning and should be removed from it.
Based on total household expenditure estimates from the LCF (2014 to 2016), £100 million amounts to 0.14 ppt and £400 million to 0.56 ppt. Although it is possible to produce regional thresholds by applying regional expenditure proportions to the £100 million and £400 million values, this seems unnecessarily complicated. For these exploratory calculations we therefore propose to take a strict application of a ppt rule, and suggest taking 0.5 ppt initially. One element of the investigation should be to consider the implication of this value on the size of the basket and the accuracy of the quantities within it, including the sampling variation in quantities near the threshold. A case could be made for lowering the threshold to something more intermediate between the £100 million and £400 million equivalents, or indeed for raising it to the 1 ppt of the EU regulation in order to simplify calculations and reduce the impact of large sampling variances.
The regional procedure will therefore emulate the national one by using an expenditure threshold. A process of deciding on inclusion or exclusion for borderline cases could be undertaken, but for this project we will use the estimated proportions without manual intervention to define the baskets.
The LCF remains more or less the only source of information on consumers’ purchases with sufficient detail to produce this information. The sample size is naturally much smaller for regions (approximately 6000/12 ≈ 500 households per region), so the accuracy of the information on the basket will be reduced.
Table 3: Regional sample sizes of households in the 2013 LCF
| Government office region modified | Number of sample households |
|---|---|
| North East | 251 |
| North West and Merseyside | 585 |
| Yorkshire and The Humber | 462 |
| East Midlands | 424 |
| West Midlands | 526 |
| East | 497 |
| London | 480 |
| South East | 681 |
| South West | 429 |
| Wales | 246 |
| Scotland | 412 |
| Northern Ireland | 151 |
| Total | 5,144 |
| Source: Office for National Statistics | |
Download this table Table 3: Regional sample sizes of households in the 2013 LCF
.xls (27.1 kB)It is still likely that sample sizes will be sufficient for direct estimation of expenditure patterns. Some care may be needed with Northern Ireland, and we should check whether the variance is unusually large. If there were to be consideration of still smaller areas, then there would need to be an assessment of whether small-area methods might be needed. These are discussed further in the following sections.
Firstly, from survey year 2016 to 2017, Northern Ireland Statistics and Research Agency (NISRA) has boosted the LCF in Northern Ireland to around 500 households (from 150 households). In the past three years of LCF data were grouped when producing outputs. This idea of merging years may still be needed, even with 500 households to bring reasonable stability to the basket estimates.
Statistical challenge 1:
How do you assess the accuracy of a composition (breakdown, in this case of consumer purchases, into proportions which must sum to 1? There are related ideas in the accuracy of the national accounts which could be applied, and there are methods for regression analysis using compositions.
It is quite likely that some products included in the regional baskets will be insufficiently important nationally to be included in CPIH price collection. For this exploratory calculation we will not attempt to provide price quotes for such products, and will treat them as adding their weight to the nearest similar product group.
Statistical challenge 2:
Small-area estimation for baskets. The standard approach of small-area estimation is to use a model to borrow strength across different areas, so as to reduce the variance, but also introducing some bias. The relative importance of the original data and the model depend on the sample size of the regular data. The effect is to “shrink” the direct estimator towards the mean for the model. This sort of approach could be applied variable by variable for each product, but then there would be a need for some normalisation to return to a composition, and it is not clear that the resulting composition would be shrunk towards the mean composition. Instead there are versions of Generalised Linear Models (GLMs) that deal with compositions (the standard approach (ref) based on a transformation, but a new approach (Firth et al.) fitting the compositional data directly with a suitable error function). It would be interesting to investigate these models for small-area estimation of baskets). An alternative small-area approach is to use Structure Preserving Estimator (SPREE) type estimators and their generalisations to estimate the region multiplied by expenditure table based on the latest LCF and some older, more accurate information (maybe 2002 to 2014 LCF as available in Prices Division within ONS).
There is a need for longitudinal consistency for baskets. The basket quantities should not fluctuate from year to year largely through sampling variation. One approach to this is to use information from several years of the LCF in calculating the baskets. More explicit smoothing is also possible. Any of these approaches risk introducing a small bias through lack of response to changes (since smoothing reduces responsiveness to change).
Regional weights
Section weights for the CPIH are derived from household final consumption expenditure (HHFCE), with a few exceptions. Regional HHFCE is not currently produced (although Consumer Price Inflation: The 2016 Basket of Goods and Services discusses the feasibility of calculating it). Conceptually we should use these regional weights to be consistent with CPIH construction. But we can approximate this by using the LCF regional expenditure patterns to break the weights into regional pieces, and then rescale the sum of weights in each region to 1,000. So
where wi and wir are respectively the national and regional weight for section i, and LCFi and LCFir are respectively the national and regional estimates of household spending on section i derived from the LCF (and related sources in a few cases). The
CPIH is not weighted only at the section level, however. More detail is obtained for commodity groups based on LCF and related sources below the level of HHFCE. These too can be calculated by a further application of the above equation, which will subdivide each of the regional weights based on LCF expenditure patterns.
Statistical challenge 3:
Small-area estimation for weights (which is almost the same as statistical challenge 2). The estimated expenditure on commodity groups, particularly at detailed levels of the COICOP classification, is likely to be very volatile where based on LCF responses. One possibility is to pool multiple years of LCF data to increase the sample size. Another is to consider a small area estimation approach for the weights. Ideally this would be constrained to the overall expenditure total, and this could use some benchmarking or a SPREE type approach
Data challenge 1:
Are there better sources of regional expenditure than the LCF? Regional accounts may have estimates of consumers’ expenditure based on a wider array of sources (or at least balanced with a wider array of sources even if they are based largely on LCF). Are there other alternatives? These could easily be substituted for LCF in the above equation at any level of the hierarchy for which they are available.
Boundary issues: What is the definition of “region” that a regional consumer price index should cover?
There are two competing ways to define a region for consumer price index purposes. The first is to use the region in which expenditure takes place, and the second is to use the “usual residence” of the person making the spend. The Consumer Price Indices - Technical Manual uses the former definition in the calculation of the national index, which should include the spend of foreign nationals visiting the UK. For some products we would not expect there to be large differences, whichever definition is used. But for other products (particularly perhaps for larger or more expensive purchases) there may be a noticeable difference with consumers making trips for particular shopping purposes.
By analogy with the national index, we would want to use the region of expenditure in a regional CPI, so that it would reflect the prices and weights of spend in a region. However, we do not have consumers’ expenditure broken down by region by product, though it may be possible to construct a version just by region based on regional accounts. This could perhaps be used for benchmarking to make an adjustment.
There are some boundary issues specific to Northern Ireland, with the Irish Republic, where items like petrol have lower taxation levels and provide advantages for Northern Ireland residents buying in the Irish Republic. We do not propose to attempt to calculate weights for cross-border sales, or to use price quotes obtained in the Irish Republic, but it should be noted that this is a simplifying assumption that may lead to differences in what the regional index measures and what is experienced by the population in Northern Ireland.
Additionally, we need to define a suitable procedure for dealing with non-locational purchases such as mail-order goods, or services provided over the internet. One simple approach is to take the national price index for mail order etc goods in this case. But if there are considerable differences in pattern of purchases by region, it may be better to construct bespoke indices of mail order etc goods for different regions using price quotes only for the appropriate products.
Data challenge 2:
Would it be reasonable to collect information on region of expenditure (and non-regional expenditure) from the LCF? Need to investigate whether this information is already potentially available, or whether it can be coded from receipts provided when the LCF diary is completed (LCF certainly includes shop codes, but need to investigate further what they relate to). Once this data is available we can look to assess the difference in the basis of the regional definition using the information, although there is a risk that it will be insufficiently detailed. Ultimately a wide provision of scanner data would enable a much better assessment of differences caused by the way region is defined
There is a benefit too in public understanding since a “regional CPI” intuitively feels like the inflation rate for prices in a region, not the rate experienced by people living in a region who may shop regularly outside it. Though it may be that the difference is small and too subtle for non-expert users.
The alternative option, of regional prices weighted according to the region of usual residence of the spender, is less like the concept of the CPI, but more practical in its application. It can be estimated directly from the LCF data, and does not have any definitional challenges for non-locational purchases. There is a small issue over whether overseas spending can be identified and excluded.
So accepting that the concept should match the CPI, we nevertheless recommend using the region of usual residence of the spender for this exploration. This should drive the derivation of the regional weights. This does leave outstanding the question of what to do with expenditure of foreign visitors. These are covered in CPI, and an adjustment to the LCF data inputs is made for them in balancing the national accounts. The first step is to examine whether the same adjustment process can be applied for a rescaling of LCF inputs. More sensitive approaches based on numbers (and possibly spend) of foreign visitors may be worth pursuing.
Regional price quotes
Clearly the price information is needed from the region to which the spending relates. Price collectors already geolocate their physical collections, and central shops also have prices defined by a particular shop within a region, so regional versions of all prices are available. Care needs to be taken with central pricing for goods that are not stocked locally – ideally these should be excluded from the prices available for an index (if they can be identified).
Data challenge 3:
In central price collection, is it clear which products are available by region? For example, there are “national” beers that are available in all main Tesco stores, but there are also local beers that are only stocked in the region in which they are produced. Is it possible to distinguish that a Welsh beer is only for sale in Wales, based on central price data? And similarly for other regional products
References
Baran, D and O’Donoghue, J (2002) ‘Price levels in 2000 for London and the regions compared with the national average’, Economic Trends, 578, 28 to 38
Fenwick, D and O’Donoghue, J (2003) ‘Developing estimates of relative regional consumer price levels’, Economic Trends, 599, 72 to 83
Gooding, P (2016) Consumer Price Inflation: The 2016 Basket of Goods and Services
ONS (2011) UK Relative Regional Consumer Price levels for Goods and Services for 2010
RPI Advisory Committee (1971) ‘Proposals for retail prices indices for regions’, Cmnd 4749, HM Stationery Office, London
Nôl i'r tabl cynnwys