Cynnwys
- Introduction
- Overview of 2018-based methodology
- Communal establishments and household population
- Household representative rates
- Numbers of households and geographic constraining
- Household type breakdowns
- Methods used for household projections for other parts of the UK
- Variant subnational household projections
- Annex A: Summary of assumptions made in the projections
1. Introduction
This article provides a high-level overview of the methodology used to produce the 2018-based household projections for England. These projections use the 2018-based subnational population projections (SNPPs) published on 24 March 2020.
Household projections show the potential number of households1 there would be in England in the future if a set of assumptions about the size and structure of the population, and that population’s patterns of household formation, were realised in practice. These assumptions are based on past demographic trends in the population and rates of household formation.
Household projections are not forecasts and do not take into account policy or development aims that have not yet had an impact on observed trends. It should also be noted that future demographic behaviour is inherently uncertain, meaning that any set of projections will almost inevitably be proved wrong, to some extent, when treated as a forecast or prediction of future numbers of households.2 These projections do not consider any demographic changes that may be observed following such events as the coronavirus (COVID-19) pandemic in 2020 or the UK’s exit from the EU in January 2020. Household projections should be thought of as a trend-based starting point for analysis, providing data produced on a consistent basis for England and its regions and local authorities.
The methodology for the household projections is split into two stages. Stage 1 provides a summary of the projected number of households based on trends in population change and household formation. Stage 2 gives a more detailed breakdown of household type. This article summarises both stages of the methodology.
Transfer to the ONS
The Office for National Statistics (ONS) took responsibility for the household projections in January 2017. The aim of the transfer was to improve the consistency between the household projections and the SNPPs and allow us to make some efficiencies in their production. Previous sets of household projections, prior to 2016-based, are available from the Ministry of Housing, Communities and Local Government (MHCLG).
Household projections are normally published every two years, around three months after the publication of the SNPPs.
Notes for: Introduction
- The household projections are based on the 2011 Census definition of a household: “one person living alone, or a group of people (not necessarily related) living at the same address who share cooking facilities and share a living room or sitting room or dining area.” This includes sheltered accommodation units in an establishment where 50% or more have their own kitchens (irrespective of whether there are other communal facilities) and all people living in caravans on any type of site that is their usual residence. This will include anyone who has no other usual residence elsewhere in the UK. A household must contain at least one person whose place of usual residence is at the address. A group of short-term residents living together is not classified as a household and neither is a group of people at an address where only visitors are staying.
- This inherent uncertainty also applies to population projections that feed into the household projections, as discussed in Fifty years of United Kingdom national population projections: how accurate have they been?. A more recent discussion of the accuracy of national population projections is available in the National Population Projections Accuracy Report. For a discussion of the accuracy of SNPPs, please refer to the Subnational Population Projections Accuracy Report.
2. Overview of 2018-based methodology
The 2018-based household projections are compiled using a two-stage process.
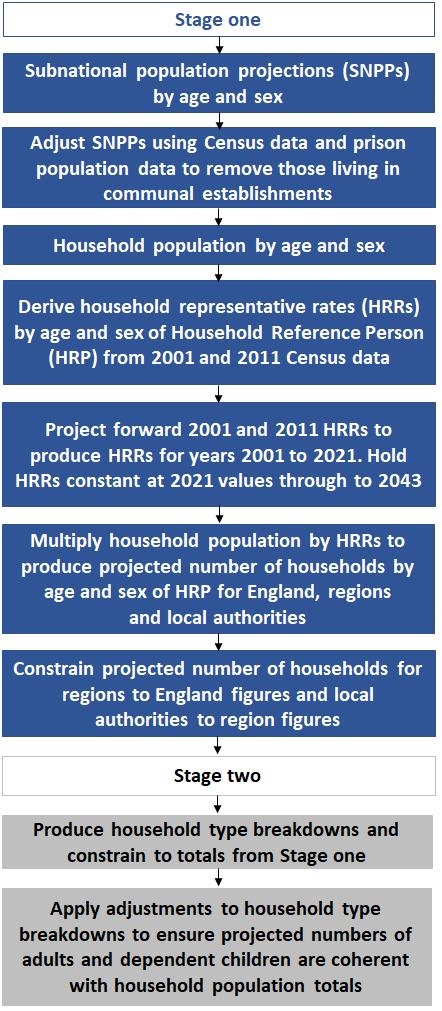
Stage 1 begins by taking the latest sets of mid-year population estimates (MYEs) and subnational population projections (SNPPs), by quinary age group and sex, and applying an adjustment to remove those living in communal establishments (CEs)1 using census data. This adjustment is also supplemented by administrative data about the prison population. This produces a projected household population for England and its regions and local authorities, by quinary age group and sex, for the years 2001 to 2043.
This projected population is then applied to household representative rates (HRR), calculated from both the 2001 and 2011 Censuses. These HRRs are projected forward to produce HRRs for the other years of the projection period to produce a projected number of households for 2001 to 2021. From 2022 to 2043, HRRs are held constant at rates calculated for 2021.
Totals for the regions are then constrained to the England total, with figures for local authorities constrained to the relevant regional totals.
Stage 2 begins by calculating household headship rates. Household headship rates show the proportion of people in a demographic group based on geography, age group, sex and household type who were the household reference person (HRP)2. These rates are calculated for 2001 and 2011 using census data and are then projected forward to produce headship rates for the other years of the projection period. They are then applied to the projected household population to produce an initial projected number of households for 2001 to 2021, with headship rates held constant for 2022 to 2043. Projected number of households produced are then constrained to the overall totals by age and sex from stage 1.
Finally, checks are carried out to ensure that the minimum number of adults and children implied by the projected household type breakdown for each geography and year does not exceed the number of adults and children in the projected household population for that geography and year. Where this is not the case, adjustments are made to the number of households allocated to each household type within that geographic area and year so that the implied numbers of adults and children are coherent with the projected household population.
Therefore, although the initial HRRs and headship rates for 2022 to 2043 are held constant at rates calculated for 2021, the final HRRs and headship rates published in the detailed data for modelling and analysis may differ slightly across these years because they account for the effect of these checks of the numbers of adults and children and geographic constraining.
Figure 1 illustrates the 2018-based household projections process.
Figure 1: Household projections methodology for England
Source: Office for National Statistics – Methodology used to produce household projections for England
Download this image Figure 1: Household projections methodology for England
.png (43.1 kB)
Notes for: Overview of 2018-based methodology
- The full definition of a CE can be found in the 2011 Census glossary.
- In the 2018-based household projections, the HRP is the eldest economically active person in the household.
3. Communal establishments and household population
The first step in the methodology requires adjustment of the 2018 mid-year population estimates (MYEs) and the 2018-based subnational population projections (SNPPs) so that they only refer to usual residents living in private households. This adjustment is made by subtracting the population living in communal establishments (CEs) from the MYEs and SNPPs.
Estimates of the population living in CEs, by quinary age group and sex, are obtained from the 20011 and 20112 Censuses at England and local authority level. We adjust the CE population in the non-census years to account for changes to this population that have taken place since the last census. The size of the CE population for the years 2002 to 2010 stays constant at 2001 levels, by quinary age group and sex, for those aged under 75 years, and the proportion of the CE population stays constant at the 2001 proportion, by quinary age group and sex, for those aged 75 years and over. The same assumptions are made for the years 2012 to 2043 but using 2011 Census data.
The CE population is then subtracted from the total usual resident population in the MYEs and SNPPs, by quinary age group and sex, to leave the private household population, split by age and sex in the years required for the household projections. One adjustment users should be aware of for CEs in the 2018-based household projections is for the local authority of Richmondshire, which has a large armed forces population. For males aged 20 to 24 years, we have used constant proportions of those in CEs instead of constant counts because of an identified decrease in the population of males in this age group for this local authority.
Prison population adjustments
One population group living in CEs that we can obtain information on are prisoners. The 2018-based household projections use 2011 to 2018 prison population data from the Ministry of Justice to update the number of prisoners in the population. In our projections, only prisoners serving sentences of six months or more are included in this adjustment; those serving sentences of less than six months are enumerated at their household and so are included in the household population.
The proportion of all prisoners for each age–sex group who are serving sentences of less than six months are calculated and multiplied by each local authority’s total prison population by sex and year. This amount is then subtracted from the original total prison population figure to produce figures adjusted to only include those serving sentences of six months or more.
Prisoners serving sentences of less than six months who were excluded from our data were categorised as follows:
- untried
- convicted unsentenced
- fine defaulter
- less than or equal to six months
- recalls
- sentence length not recorded
- non-criminal prisoners
The number of prisoners serving sentences of six months or more by age, sex and local authority in England are calculated using prison population data from the Ministry of Justice. The number of prisoners in each prison in England are first grouped by age, sex and local authority for the years 2011 to 2018. Further data are then collated on the total number of prisoners by sentence length in England and Wales in June 2011 to June 2018. The age–sex data are then separated out so they can be reformatted into the quinary age bands used in the household projections.
The age groups 15 to 17 years, 18 to 20 years and 21 to 24 years are divided into single years of age, assuming equal shares of each single year of age in each group. The 25 to 29 years age group is left unchanged, with the remaining age groups from 30 to 39 years to 60 to 69 years divided by two, assuming equal proportions in each quinary age group.
The age group 60 years and over is used in 2011 to 2017, but a 60- to 69-years-old and 70 years and over split is available in 2018. Therefore, the proportions of 60- to 69-years-old and 70 years and over are used in 2018 to split up the 60 years and over age group for the earlier years. We assumed that 60% of the age group 70 years and over were aged 70 to 74 years in all years of the data because of the smaller numbers of those aged 75 years and over in prisons. These data were then grouped into the quinary age bands used for household projections.
Finally, the number of prisoners in each age group is divided by the total number of prisoners to calculate what proportion of the total number of prisoners should be assigned to each age group. These proportions were applied to the local authority level figures by sex, to produce an age–sex breakdown of prisoners serving sentences of six months or more, by local authority.
There are two main limitations of this approach to the age distribution. First, an age distribution for England and Wales is applied to institutions in England only, the inherent assumption being that the overall age distribution of prisoners in England and Wales compared with England alone is broadly similar.
Secondly, the same age distribution is applied to all institutions, even though some institutions will only hold prisoners aged 15 to 21 years (for example, youth justice board and young offenders’ institutions). This may have the effect of removing more people aged 21 years and over from the household population than should be removed, although the numbers involved are likely to be relatively small compared with the overall population of a local authority. This is an area of the methodology we will seek to improve upon in future sets of household projections.
The difference between the 2011 prison population and the prison population of the year in question is added to the CE totals from the 2011 Census, and this total amount is removed from the SNPPs. We assume the size of the prison population for the years after 2018 is the same as in mid-2018.
While these adjustments have a very small impact at the England level, they provide a more realistic picture of the CE population for local authorities where prisons have opened or closed between the 2011 Census and the base year of the household projections in 2018.
In the 2018-based projections, we made a small adjustment to the calculation of prisoners to ensure that those in Immigration Removal Centres (IRCs) were removed when calculating proportions applied specifically to prisons. We found that in previous sets of projections, this had not been the case, leading to a very slight overestimation of the number of prisoners removed for serving less than six months.
Notes for: Communal establishments and household population
- For more information, see 2001 Census table CS001, age by sex and resident type.
- For more information, see 2011 Census table CT0731, sex by age – local authorities in England.
4. Household representative rates
The next stage of the method is to produce household representative rates (HRRs), which can be multiplied by the household population figures to produce a projected number of households. The HRR is the proportion of people in a demographic group who were the household reference person (HRP). The value of the HRR will be between zero and one.
Defining the HRP
The HRP is a person chosen for statistical reasons because of economic activity, age and/or sex as the representative of a household. The 2018-based household projections for England use the 2011 Census definition of HRP for both stage 1 and stage 2 of the methodology; that is, the eldest economically active person in the household, then the eldest inactive person if there was no economically active person.
Calculating base HRRs using 2001 and 2011 Census data
The 2018-based household projections use base HRRs calculated using both the 2001 and 2011 Censuses. The household populations from these censuses are divided by the number of HRPs (by age group, sex, area and year), also taken from both censuses. City of London was merged with Westminster and Isles of Scilly merged with Cornwall when producing the HRRs, as these local authorities have small counts and projecting them could result in unreliable trends.
Smoothing and projecting base HRRs
To counteract a cohort effect1 impacting projected HRRs for older age groups, the base HRRs produced from 2001 and 2011 Census data were smoothed across age groups for males and females.
In the 2018-based projections, the HRRs for 2001 and 2011 were smoothed using a three-point moving average; for example, the HRRs for 20- to 24-year-olds in the smoothed method are an average of the HRRs for 16- to 19-year-olds, 20- to 24-year-olds and 25- to 29-year-olds. All age groups were smoothed in this way except for the 16- to 19-year-olds and those aged 90 years and over. This was because they are the start and end of the age range and their HRRs would be calculated as an average of two groups rather than three. For the 16- to-19-year-olds, smoothing resulted in an implausibly large number of HRPs at that age, so we decided that retaining the unsmoothed HRRs would be preferable for this group. HRRs for those aged 90 years and over were not smoothed, to be consistent with the unsmoothed 16- to 19-years-old age group.
Once smoothed, the base HRRs for 2001 and 2011 are projected forward to produce HRRs for the other years of the projection period.
The 2018-based household projections use a two-point exponential model2 to project forward HRRs calculated using 2001 and 2011 Census data for each demographic group. The formula for projecting forward base HRRs is as follows:
yi = k + abx i
Where:
i is the year, from 2001 to 2043
y i is the headship rate in year i
c is the most recent census year (2011)
d is the furthest away census year (2001)
k is 1 if y c > = y d and k is 0 if y c < y d
a is yd minus k
b is (yc – K) / (yd – k)
xi is (i – d) / (c – d)
The values of c and d are constants; that is, for each year of the projection period, c will equal 2011 and d will equal 2001.
HRRs calculated using 2001 and 2011 Census data for each demographic group are projected forward through to 2021. From 2022 to 2043, HRRs by age, sex and geography are held constant at 2021 rates.
The 2018-based household projections method assumes that trends in average household size and household formation will continue for a maximum of another 10 years (that is, from 2011 to 2021).
As trends become less certain after 2021 and beyond the 10-year point, HRRs are then held constant at the level they are at in 2021 for the rest of the projection period.
Notes for: Household representative rates
- The cohort effect in question relates to changes in retirement patterns and the impact of World War Two, which may have changed the relative size and structure of these cohorts and therefore their likelihood of being HRPs.
- For more information, see Household Composition and Housing Need.
5. Numbers of households and geographic constraining
Once projected numbers of households have been calculated for England and its regions and local authorities, regional numbers of households are then constrained to the England total and local authority level numbers of households are constrained to the regional totals. This constraining takes place on the assumption that England and regional level projections will be less subject to variation because of smaller populations than household projections for local authorities. This approach also provides consistency across geographies.
Nôl i'r tabl cynnwys6. Household type breakdowns
Calculating household headship rates
The second stage of the 2018-based household projections is to calculate projected numbers of households by household type and age.
This begins by calculating base household headship rates, which show the proportion of people in a particular demographic group (based on geography, quinary age group, sex and household type) who were the household reference person (HRP). Headship rates use the same age groups as household representative rates (HRRs) (see Section 4).
Headship rates are calculated using 2001 and 2011 Census data, based on the current definition of a HRP – the eldest economically active person in the household. The base headship rates for 2001 and 2011 for each geography, sex and household type were smoothed over the age distribution using the same three-point moving average as used in stage 1, with HRRs for those aged 16 to 19 years and 90 years and over left unsmoothed.
Headship rates are calculated separately for males and females because they are smoothed across age groups (maintaining consistency with the stage 1 HRRs) and males and females have different distributions of headship rates.
These smoothed headship rates are then projected forward using the same two-point exponential model as used in stage 1, to produce projected headship rates for the years 2001 to 2021. As in stage 1, headship rates for 2022 to 2043 are held constant at 2021 rates.
Stage 2 household types
The stage 2 2018-based household projections are divided into six household types:
- One-person households: male
- One-person households: female
- Other households with two or more adults
- Households with one dependent child
- Households with two dependent children
- Households with three or more dependent children
The category “Other households with two or more adults” is made up of three more household types that have been combined:
- One family and no others: Couple households: No dependent children
- Couple and one or more other adults: No dependent children
- Other households with two or more adults
We are planning to review the household type breakdowns provided as part of future household projections. Part of this review will involve ensuring that consistent breakdowns and categorisations can be produced across multiple years and data sources.
Constraining to stage 1 totals
Once base headship rates have been produced, smoothed and projected forward, they are multiplied by the household population for each quinary age, sex, geography and year grouping to produce initial projected numbers of households by type. These initial projected numbers of households are then constrained to the projected household totals produced in stage 1.
Although headship rates are calculated separately for males and females, the final headship rates do not contain a sex breakdown (except for one-person households, for which the sex split is retained). This is because the sex breakdown for the household projections by household type is removed prior to the application of minimum adult and child checks (except for one-person households). This is because our research identified some implausible trends between males and females for some of the disaggregated household types that were merged. The final constrained headship rates are then produced by dividing the number of projected households by household type with the projected household population.
Minimum adult and child checks
The next part of the stage 2 processing is to ensure that the minimum number of adults and children implied by the projected household type breakdown for each geography and year does not exceed the number of adults and children in the projected household population for that geography and year.
As household population data include an age breakdown for those aged 16 to 19 years, we are required to make an assumption about the future numbers of 16- to 19-year-olds who would be considered dependent children1. To do this, we use a combination of 2001 and 2011 Census data and Annual Population Survey (APS) data. For each local authority, we calculate the estimated proportion of people aged 16 to 19 years who are dependent children using census data for the years 2001 and 2011 and APS data for the years 2004 to 2010 and 2012 to 2018. APS data were not available for the years 2002 and 2003, so figures for these years are interpolated between the 2001 Census estimate and 2004 APS estimate.
Given the fluctuations in the APS data arising from small sample sizes2, we smoothed the APS and census data using a three-year moving average for all years apart from 2001, where the census data are used unchanged, and the last year of data (2018), where we took the average of 2017 and 2018. We held constant the averaged 2017 to 2018 proportion of dependent children for each local authority in future years of the projection period and applied this proportion to the household population estimates of the number of 16- to 19-year-olds.
We then compare the number of dependent children in each local authority and year in the household population with the minimum number of dependent children implied by the household type breakdown for that local authority and year. When the latter is greater than the former, we reduce the number of households with dependent children by the number of children in excess of the household population.
Once the projections have been adjusted for the number of children in the household population, we compare the minimum number of adults3 implied by the household projections with the number of adults in the household population. No adjustments were required in any years of the projection period to reduce the minimum number of adults implied by the household type breakdowns.
Limitations of minimum adult and child checks
We recognise that there are limitations to the way in which we have applied the minimum adult and child checks. First, we remove the same number of households from household types with dependent children as there are excess dependent children. This means that we remove more children than the excess implied, because in removing a household with two dependent children, we reduce the number of excess children by two, not one. On the other hand, removing more children than the minimum excess implied may account more effectively for households with three or more children, some of which will have four, five or more children.
Similarly, where the minimum number of children implied by the household type breakdown is equal to, or only slightly lower than, the household population of children, we make no adjustment. This means we may not be making enough of an allowance for those households with three or more dependent children who will have four, five or more children.
For the minimum number of adults, we have assumed that the minimum number of adults in households with dependent children is one and that the minimum number of adults in households with two or more adults and no dependent children is two. We recognise that this is likely to indicate a lower minimum number of adults than is reasonable for many local authorities.
Using alternative household type breakdowns in the future will allow us to explore using more granular data about the minimum numbers of adults in households, to provide more detailed checks. We will continue to review the most effective ways of applying minimum adult and child checks to household projections as part of our future research.
Notes: Household type breakdowns
- A dependent child is defined as any person aged 0 to 15 years living in a household or a person aged 16 to 18 years in full-time education and living in a family with their parent(s) or grandparent(s). It does not include any people aged 16 to 18 years who have a spouse, partner or child living in the household.
- APS estimates based on a sample of less than three people were suppressed, and missing values were linearly interpolated between the nearest years with APS or census data.
- Adults are anyone aged 19 years and over, plus the proportion of 16- to 18-year-olds who were not considered to be dependent children.
7. Methods used for household projections for other parts of the UK
The methods described in this article relate to household projections for England only. Household projections are produced separately for England, Wales, Scotland and Northern Ireland. A user guide to the household projections across the UK was published on 29 June 2020, which compares the methods and data sources used across the four countries.
Data table 401 brings together household projections published separately for England, Wales, Scotland and Northern Ireland (last updated 29 June 2020). The latest data and information on data sources and methods for household projections for Wales, Scotland and Northern Ireland are available.
Nôl i'r tabl cynnwys8. Variant subnational household projections
Variant subnational household projections were published alongside the principal projections on 29 June 2020.
Five subnational variant household projections have been produced:
- a high international migration variant
- a low international migration variant
- an alternative internal migration variant
- a 10-year migration variant
- continuous projection of the household representative rates (HRRs), which were held constant from 2022 onwards in the principal projection
The alternative internal migration variant uses five years of data for internal migration: two using the new method and three using the old method. The 10-year migration variant (internal, cross-border and international) are migration trends based on 10 years of data. More information on the alternative internal migration variant and the 10-year migration variant are discussed in our article on the Impact of different migration trend lengths.
Nôl i'r tabl cynnwys9. Annex A: Summary of assumptions made in the projections
The mid-year population estimates (MYEs) and subnational population projections (SNPPs) are an accurate reflection of the past and projected size and structure of the usual resident population of England by age and sex.
The size of the communal establishment (CE) population aged 0 to 74 years by sex for 2002 to 2010 will be the same as it was in the 2001 Census.
The size of the CE population aged 0 to 74 years by sex for 2012 to 2043 will be the same as it was in the 2011 Census.
The proportion of those aged 75 years and over, by sex, living in CEs for 2002 to 2010 will be the same as it was in the 2001 Census.
The proportion of those aged 75 years and over, by sex, living in CEs for 2012 to 2043 will be the same as it was in the 2011 Census.
The age structure of the prison population aged 0 to 74 years serving sentences of six months or more will be similar across local authorities, as a national distribution of age and sentence length is applied to all local authorities.
Household representative rates (HRRs) calculated by age, sex and geography will produce an accurate reflection of the numbers of households in future years.
Using two years of census data (2001 and 2011) will provide a long enough trend to provide a reasonably accurate projection of both headship rates and HRRs for the years 2011 to 2021.
HRRs after 2021 are constant, reflecting the uncertainty of household-formation patterns in future years.
Projected numbers of households for England are more accurate than those for regions, which in turn are more accurate than those for local authorities; therefore, geographic constraining is applied to figures for regions and local authorities.
Headship rates after 2021 (prior to the application of constraining and minimum adult and child checks) are constant, reflecting the uncertainty of household-formation patterns in future years.
Projected numbers of households by age and geography from stage 1 are more accurate than those from the aggregated stage 2 figures; therefore, initial stage 2 projections are constrained to stage 1 totals.
The proportion of 16- to 18-year-olds who are dependent children in the years 2018 to 2043 will remain constant at the 2017 to 2018 levels calculated from Annual Population Survey (APS) data.
The distribution of household types (with and without dependent children) remains the same after adjustments have been applied to account for minimum numbers of children.
Where there are more dependent children implied by the projected numbers of households than there are in the household population, the number of households removed should be equal to the excess number of dependent children.
Where the minimum number of dependent children implied by the household type breakdown is equal to, or only slightly lower than, the household population of dependent children, no adjustment is required.
The minimum number of adults implied by a household with dependent children is one.
Nôl i'r tabl cynnwys