
1. Introduction
This report provides detailed information on the principal and variant mortality assumptions used in the 2016-based national population projections. The long-term mortality assumption for the UK projects period1 life expectancy at birth to be 83.4 years for men and 86.2 years for women for the year ending mid-2041.
Notes for: Introduction
- Period life expectancy is calculated on the basis of the mortality rates for a particular calendar year and, unlike cohort life expectancy, does not allow for future known or assumed changes in mortality rates. Full definitions of period and cohort life expectancy are available on the National Archives website.
2. General approach
When formulating the mortality assumptions for the population projections the focus is on mortality rates and annual percentage changes in mortality rates by age and year rather than life expectancy. The annual percentage changes are also referred to as rates of improvement in mortality (or mortality improvements) because at most ages in most years mortality rates have improved and are projected to continue to do so.
Rates of improvement by age and sex for 2016, the base year of the projections, were derived by analysing and projecting trends in mortality improvements derived from data for the period 1961 to 2015. These data were also used to derive assumed age- and sex-specific mortality rates for 2016. The rates of improvement derived for 2016 were then projected into the future and applied successively to the assumed mortality rates by age and sex for 2016 to derive projected mortality rates. The mortality rates for the first year of the projection, from mid-2016 to mid-2017, were adjusted to provide the best estimates that could be made in the autumn of 2017 of the numbers of deaths in 2016 to 2017.
Nôl i'r tabl cynnwys3. Principal assumptions
The assumptions used in the 2016-based projections are that annual rates of improvement in mortality rates would converge to 1.2% for most ages in 2041 (the 25th year of the 2016-based projections), and remain constant at 1.2% a year thereafter. However, there is little evidence of past mortality improvements at the very oldest ages in the UK. As a result, and in order to avoid implausible numbers surviving to extreme ages, for those born before 1924 the target rate is assumed to decline from 1.1% to 0.1% for those born in 1906 and earlier.
This target rate was based on an analysis of past rates of improvement and expert advice. This differs slightly from the 2014-based projections, where higher rates of improvements were assumed for those born between 1923 and 1938 (also known as the “golden cohort”). These higher rates peaked at 2.5% for those born in 1931 and 1932.
These differentials experienced by the “golden cohort” appear to have reduced or disappeared in the data for the most recent years (see Figure 4.1). Until recently, the clearest cohort effects were for those born in the early 1930s who will be centenarians in 2041; high rates of improvement for these cohorts are likely to be too optimistic an assumption based on current evidence.
Over the 53-year period between 1960 to 1962 and 2013 to 2015, the average rates of improvement in age-standardised mortality rates were around 1.6% per year for males and 1.3% per year for females. These rates of improvement are derived from aggregate mortality rates for ages 0 to 99 calculated using the 2011 population estimates for the UK as the standard population. The rate of improvement over the latter half of this period was higher than over the first half, particularly for males. This appears to be partly due to differential trends in smoking behaviour between males and females. Relatively higher numbers of men have now given up smoking and mortality rates for males at older ages have shown large rates of improvement in recent years.
The average annual rate of improvement in age-standardised mortality over the whole of the 20th century was around 1.2% for both males and females, although the actual improvement rates vary by age. There is considerable debate as to whether the impact of future technical, medical and environmental changes will have a greater or lesser effect on improvements in mortality in the future than they had over the 20th century.
The transition from current rates of mortality improvement by age and sex, derived from recent trends, to the assumed rates of 1.2% in 2041 is not assumed to take place linearly, but is assumed to converge at the same speed for males and females. There is evidence of generational effects for those born after 1940. Thus, in these projections, convergence to the assumed rate of improvement in 2041 has been calculated by cohort for all those born before 1960. For those born in 1960 and later, for whom there is little evidence of generational effects, the changes in the rates of improvement to the target rate are projected by calendar year.
The heat maps (Figures 4.1a and 4.1b) show the resulting historical and projected annual rates of mortality improvement for the UK by age and year. The highest improvements are shown by the areas denoted by 2.5% and 3% per year improvement (shaded orange and red in Figures 4.1a and 4.1b).
Figure 4.1a: Historic and projected percentage change in smoothed mortality rates, males, UK, 1962 to 2041

Source: Office for National Statistics
Download this image Figure 4.1a: Historic and projected percentage change in smoothed mortality rates, males, UK, 1962 to 2041
.png (57.1 kB)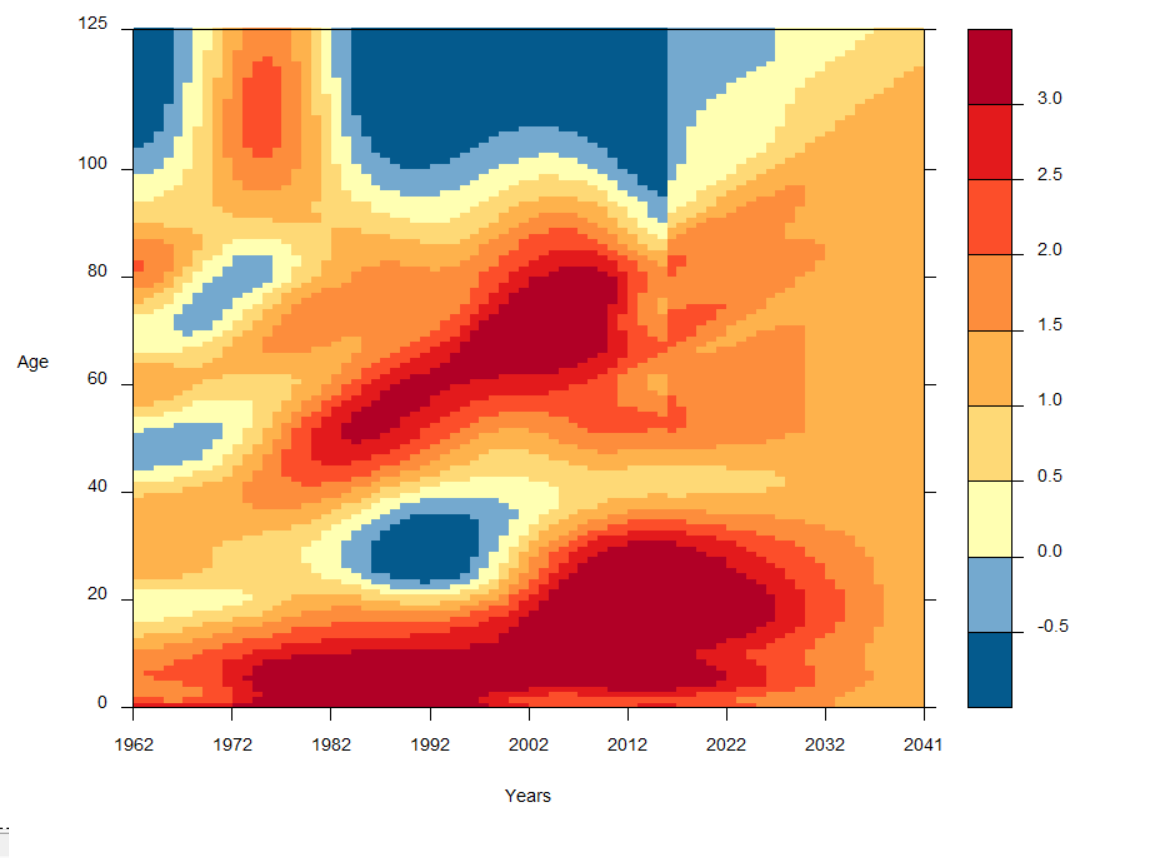
Figure 4.1b: Historic and projected percentage change in smoothed mortality rates, females, UK, 1962 to 2041

Source: Office for National Statistics
Download this image Figure 4.1b: Historic and projected percentage change in smoothed mortality rates, females, UK, 1962 to 2041
.png (54.5 kB)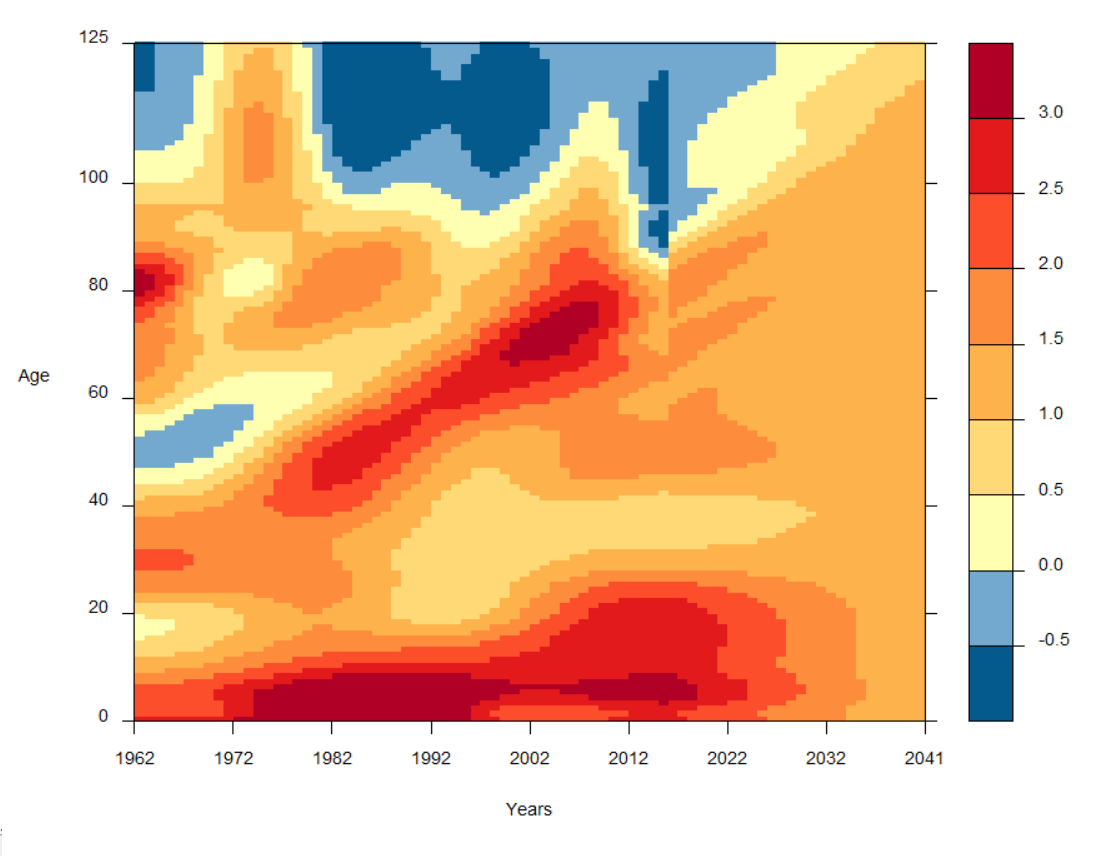
The rates of improvement after 2041 are assumed to remain constant (by cohort or by age, as described earlier) at the rate assumed in 2041 for each year thereafter. Taking account of the generally higher rates of improvement assumed prior to 2041, this produces average annualised rates of mortality improvement of around 1.3% for males and 1.2% for females over the projection period to 2091 (75 years). This is slightly lower than those experienced over the past 75 years, of around 1.4% per year for both males and females.
Comparisons of the recent historical rates of improvement experienced in each individual country with those experienced in the UK as a whole suggested that the same assumed initial rates of improvement by age and sex for 2016 could be adopted for each individual country, except for Scotland. Mortality for Scottish males and females at some ages has been improving more slowly or worsening at a faster rate than elsewhere in the UK in recent years. As a result, different initial rates of mortality improvement than those derived for the UK were assumed for Scottish males and females at several ages. Lower rates of improvement have been assumed for Scottish males in their 30s, 40s, early 50s and late 60s to early 90s, with higher rates assumed for those aged 53 to 67. For Scottish females, lower rates have been assumed for those aged 24 to 53 and 67 to 89, with higher rates assumed for those aged 54 to 66, than for the rest of the UK. The improvement rates for the other countries were then adjusted so that the weighted country-specific improvements by age were the same as those initially derived for the UK as a whole. The resulting assumed smoothed changes in mortality rates between 2015 and 2016 for each country are shown in Figures 4.2a and 4.2b.
Figure 4.2a: Assumed smoothed percentage changes in mortality rates between 2015 and 2016 by age, Scotland compared with combined figures for England, Wales, and Northern Ireland
Source: Office for National Statistics
Download this chart Figure 4.2a: Assumed smoothed percentage changes in mortality rates between 2015 and 2016 by age, Scotland compared with combined figures for England, Wales, and Northern Ireland
Image .csv .xls
Figure 4.2b: Assumed smoothed percentage changes in mortality rates between 2015 and 2016 by age, Scotland compared with combined figures for England, Wales, and Northern Ireland
Source: Office for National Statistics
Download this chart Figure 4.2b: Assumed smoothed percentage changes in mortality rates between 2015 and 2016 by age, Scotland compared with combined figures for England, Wales, and Northern Ireland
Image .csv .xlsAs a result, a slightly different set of future rates of improvements has been assumed for Scotland compared with the other countries of the UK, as was done in recent past projections. These rates generally assume slightly smaller improvements in the period to 2041 at some ages for males and females.
In 2041, period expectation of life at birth for the UK is around 0.9 years lower than in previous projections for both males and females. These differences are mainly due to:
a combination of the changes in initial rates of mortality improvement and base mortality rates compared with those projected for 2016 in the 2014-based projections
the change in the target year
the improvement rates assumed at some ages in the target year
After 2041 the life expectancies for males continue to diverge from those in the 2014-based projections to around 1.2 years lower by 2091, whilst those for females fall to around 1.3 years lower.
Period expectations of life at birth and at age 65, based on the projected mortality rates, are shown for selected future years in Table 4.1. The base year mortality rates for individual countries are shown for selected ages in Table 4.2 and a summary of the assumed percentage rates of mortality reduction for selected years and ages is shown in Tables 4.3 and 4.4.
Table 4.1 Period expectation of life at birth and at age 65 according to mortality rates assumed for selected years, UK
| Years | |||||||||||||||||
| Period expectation of life at birth | |||||||||||||||||
|---|---|---|---|---|---|---|---|---|---|---|---|---|---|---|---|---|---|
| 2016 to 2017 | 2020 to 2021 | 2030 to 2031 | 2040 to 2041 | ||||||||||||||
| Males | Females | Males | Females | Males | Females | Males | Females | ||||||||||
| England | 79.6 | 83.2 | 80.7 | 84.0 | 82.3 | 85.3 | 83.6 | 86.4 | |||||||||
| Wales | 78.5 | 82.5 | 79.8 | 83.2 | 81.5 | 84.5 | 82.8 | 85.7 | |||||||||
| Scotland | 77.4 | 81.3 | 78.5 | 82.0 | 80.3 | 83.3 | 81.7 | 84.5 | |||||||||
| Northern Ireland | 79.0 | 82.4 | 79.7 | 83.2 | 81.4 | 84.6 | 82.8 | 85.8 | |||||||||
| UK | 79.4 | 83.0 | 80.4 | 83.7 | 82.1 | 85.0 | 83.4 | 86.2 | |||||||||
| Period expectation of life at age 65 | |||||||||||||||||
| 2016 to 2017 | 2020 to 2021 | 2030 to 2031 | 2040 to 2041 | ||||||||||||||
| Males | Females | Males | Females | Males | Females | Males | Females | ||||||||||
| England | 18.8 | 21.2 | 19.5 | 21.7 | 20.7 | 22.7 | 21.7 | 23.6 | |||||||||
| Wales | 18.1 | 20.7 | 19.0 | 21.2 | 20.2 | 22.2 | 21.2 | 23.1 | |||||||||
| Scotland | 17.5 | 19.8 | 18.2 | 20.3 | 19.5 | 21.3 | 20.5 | 22.2 | |||||||||
| Northern Ireland | 18.6 | 20.6 | 19.0 | 21.2 | 20.2 | 22.2 | 21.2 | 23.2 | |||||||||
| UK | 18.6 | 21.0 | 19.4 | 21.5 | 20.5 | 22.5 | 21.5 | 23.4 | |||||||||
| Source: Office for National Statistics | |||||||||||||||||
Download this table Table 4.1 Period expectation of life at birth and at age 65 according to mortality rates assumed for selected years, UK
.xls (33.8 kB)
Table 4.2: Assumed base year mortality rates (mx) per 100,000 population, by selected ages, UK, 2016
| Males | Females | ||||||||
|---|---|---|---|---|---|---|---|---|---|
| Age | England | Wales | Scotland | Northern Ireland | England | Wales | Scotland | Northern Ireland | |
| 0 | 413 | 400 | 341 | 539 | 332 | 294 | 303 | 387 | |
| 2 | 13 | 12 | 12 | 15 | 11 | 9 | 10 | 11 | |
| 12 | 9 | 8 | 10 | 9 | 7 | 7 | 8 | 7 | |
| 22 | 48 | 52 | 61 | 77 | 21 | 21 | 25 | 26 | |
| 32 | 75 | 100 | 123 | 105 | 41 | 51 | 61 | 45 | |
| 42 | 165 | 204 | 253 | 183 | 100 | 109 | 133 | 103 | |
| 52 | 346 | 383 | 451 | 372 | 235 | 279 | 313 | 263 | |
| 62 | 887 | 972 | 1087 | 947 | 578 | 663 | 710 | 657 | |
| 72 | 2259 | 2474 | 2900 | 2444 | 1510 | 1672 | 1956 | 1593 | |
| 82 | 6825 | 7227 | 7841 | 7235 | 4999 | 5318 | 5977 | 5266 | |
| 92 | 22113 | 23006 | 23480 | 23006 | 18352 | 19163 | 20166 | 19041 | |
| 102 | 57690 | 58511 | 59111 | 57764 | 53032 | 53032 | 53705 | 53099 | |
| Source: Office for National Statistics | |||||||||
Download this table Table 4.2: Assumed base year mortality rates (m~x~) per 100,000 population, by selected ages, UK, 2016
.xls (27.1 kB)
Table 4.3: Assumed percentage reduction in death rates (mx) between calendar years for England, Wales and Northern Ireland
| Percentage | ||||||||||||||
| 2016 to 2017 | 2020 to 2021 | 2030 to 2031 | 2040 to 2041 | over 25 years | ||||||||||
| Age last birthday | Males | Females | Males | Females | Males | Females | Males | Females | Males | Females | ||||
| 0 | 2.5 | 2.62 | 2.25 | 2.34 | 1.66 | 1.7 | 1.2 | 1.2 | 36.4 | 37.3 | ||||
| 2 | 2.63 | 2.69 | 2.35 | 2.39 | 1.7 | 1.72 | 1.2 | 1.2 | 37.3 | 37.8 | ||||
| 12 | 3.63 | 2.84 | 3.15 | 2.52 | 2.05 | 1.77 | 1.2 | 1.2 | 44.3 | 38.9 | ||||
| 22 | 4.25 | 2.55 | 3.65 | 2.29 | 2.27 | 1.67 | 1.2 | 1.2 | 48.2 | 36.8 | ||||
| 32 | 2.62 | 1.15 | 2.34 | 1.16 | 1.7 | 1.18 | 1.2 | 1.2 | 37.3 | 25.7 | ||||
| 42 | 0.95 | 1.12 | 1 | 1.13 | 1.11 | 1.17 | 1.2 | 1.2 | 23.9 | 25.4 | ||||
| 52 | 2.07* | 1.84* | 1.9 | 1.71 | 1.5 | 1.42 | 1.2 | 1.2 | 33.1 | 31.3 | ||||
| 62 | 1.54* | 1.32* | 1.83* | 1.53* | 1.47 | 1.34 | 1.2 | 1.2 | 31.8 | 28.9 | ||||
| 72 | 2.22* | 1.71* | 1.92* | 1.66* | 1.47* | 1.34* | 1.2 | 1.2 | 32.1 | 29.5 | ||||
| 82 | 2.08* | 1.83* | 1.8* | 1.61* | 1.51* | 1.4* | 1.2* | 1.2* | 32.7 | 30.2 | ||||
| 92 | 0.65* | 0.08* | 1.41* | 0.97* | 1.46* | 1.38* | 1.2* | 1.2* | 29.4 | 25.7 | ||||
| Source: Office for National Statistics | ||||||||||||||
| Note: | ||||||||||||||
| 1. Projections are made by calendar year, except figures marked with an *, where projections are made by cohort. | ||||||||||||||
Download this table Table 4.3: Assumed percentage reduction in death rates (m~x~) between calendar years for England, Wales and Northern Ireland
.xls (28.7 kB)
Table 4.4: Assumed percentage reduction in death rates (mx) between calendar years for Scotland
| Percentage | ||||||||||||||
| Reduction | ||||||||||||||
| 2016 to 2017 | 2020 to 2021 | 2030 to 2031 | 2040 to 2041 | over 25 years | ||||||||||
| Age last birthday | Males | Females | Males | Females | Males | Females | Males | Females | Males | Females | ||||
| 0 | 2.5 | 2.62 | 2.25 | 2.34 | 1.66 | 1.7 | 1.2 | 1.2 | 36.4 | 37.3 | ||||
| 2 | 2.63 | 2.69 | 2.35 | 2.39 | 1.7 | 1.72 | 1.2 | 1.2 | 37.3 | 37.8 | ||||
| 12 | 3.63 | 2.84 | 3.15 | 2.52 | 2.05 | 1.77 | 1.2 | 1.2 | 44.3 | 38.9 | ||||
| 22 | 4.25 | 2.55 | 3.65 | 2.29 | 2.27 | 1.67 | 1.2 | 1.2 | 48.2 | 36.8 | ||||
| 32 | 2.11 | 0.06 | 1.93 | 0.28 | 1.52 | 0.8 | 1.2 | 1.2 | 33.5 | 15.7 | ||||
| 42 | 0.49 | 0.9 | 0.63 | 0.96 | 0.95 | 1.09 | 1.2 | 1.2 | 19.7 | 23.4 | ||||
| 52 | 2.04* | 1.41* | 1.87 | 1.37 | 1.49 | 1.27 | 1.2 | 1.2 | 32.9 | 50.6 | ||||
| 62 | 2.58* | 2.1* | 2.16* | 1.68* | 1.62 | 1.41 | 1.2 | 1.2 | 35.9 | 31.7 | ||||
| 72 | 1.91* | 1.3* | 2.03* | 1.61* | 1.62* | 1.41* | 1.2 | 1.2 | 35 | 30.7 | ||||
| 82 | 1.84* | 1.33* | 1.59* | 1.25* | 1.56* | 1.38* | 1.2* | 1.2* | 31.9 | 27.8 | ||||
| 92 | 0.65* | 0.08* | 1.13* | 0.54* | 1.37* | 1.22* | 1.2* | 1.2* | 27.3 | 22.2 | ||||
| Source: Office for National Statistics | ||||||||||||||
| Note: | ||||||||||||||
| 1. Projections are made by calendar year, except figures marked with an *, where projections are made by cohort. | ||||||||||||||
Download this table Table 4.4: Assumed percentage reduction in death rates (m~x~) between calendar years for Scotland
.xls (28.7 kB)
Figure 4.3a: Estimated and projected period expectation of life at birth, UK, 1981 to 2091
Source: Office for National Statistics
Notes:
- Historic estimates are displayed on a calendar year basis while projected assumptions are displayed on a mid-year to mid-year basis
Download this chart Figure 4.3a: Estimated and projected period expectation of life at birth, UK, 1981 to 2091
Image .csv .xls
Figure 4.3b: Estimated and projected period expectation of life at age 65, UK, 1981 to 2091
Source: Office for National Statistics
Notes:
- Historic estimates are displayed on a calendar year basis while projected assumptions are displayed on a mid-year to mid-year basis
Download this chart Figure 4.3b: Estimated and projected period expectation of life at age 65, UK, 1981 to 2091
Image .csv .xls
Figure 4.4a: Estimated and projected period expectation of life at birth, males, 1981 to 2066
Source: Office for National Statistics
Notes:
- Historic estimates are displayed on a calendar year basis while projected assumptions are displayed on a mid-year to mid-year basis
Download this chart Figure 4.4a: Estimated and projected period expectation of life at birth, males, 1981 to 2066
Image .csv .xls
Figure 4.4b: Estimated and projected period expectation of life at birth, females, 1981 to 2066
Source: Office for National Statistics
Notes:
- Historic estimates are displayed on a calendar year basis while projected assumptions are displayed on a mid-year to mid-year basis
Download this chart Figure 4.4b: Estimated and projected period expectation of life at birth, females, 1981 to 2066
Image .csv .xls4. Assumptions for mortality variants
Current annual improvements in mortality rates vary considerably by age and sex. For mortality, it is assumed that for most ages these improvements will gradually converge to common "target rates" of improvement, at each age and for both sexes, by the year 2041, and continue to improve at that constant rate thereafter. In contrast to previous years’ projections it is no longer assumed that those born in the years after 1922 and before 1939 (cohorts which have consistently experienced relatively high rates of mortality improvement over the last 25 years) will experience higher rates of mortality improvement than the rest of the population after 2041.
The target rate assumptions for the variant mortality projections for the UK and its constituent countries are as follows:
High variant: 1.9% annual improvement at 2041, thereafter annual improvement remaining at 1.9%. For those born before 1924 the target rate is assumed to decline from 1.9% to 0.8% for those born in 1906 and earlier.
Moderately high variant: 1.6% annual improvement at 2041, thereafter annual improvement remaining at 1.6%. For those born before 1924 the target rate is assumed to decline from 1.6% to 0.5% for those born in 1906 and earlier.
Principal projection: 1.2% annual improvement at 2041, thereafter annual improvement remaining at 1.2%. For those born before 1924 the target rate is assumed to decline from 1.2% to 0.1% for those born in 1906 and earlier.
Moderately low variant: 0.6% annual improvement at 2041, thereafter annual improvement remaining at 0.6%. For those born before 1924 the target rate is assumed to decline from 0.6% to 0.1% for those born in 1906 and earlier.
Low variant: 0% annual improvement at 2041, thereafter mortality rates remaining constant (improvements at 0%) for all ages.
Table 4.5 shows period expectation of life at birth in 2041 that result from the principal and variant assumptions.
Table 4.5 Period expectation of life at birth in the year ending mid-2041 for the standard variants, UK
| High | Moderately high | Principal | Moderately low | Low | |
|---|---|---|---|---|---|
| Males | |||||
| England | 84.8 | 84.4 | 83.6 | 82.6 | 81.8 |
| Wales | 84 | 83.6 | 82.8 | 81.8 | 80.9 |
| Scotland | 82.9 | 82.5 | 81.7 | 80.6 | 79.8 |
| Northern Ireland | 84 | 83.5 | 82.8 | 81.7 | 80.9 |
| UK | 84.6 | 84.1 | 83.4 | 82.4 | 81.6 |
| Females | |||||
| England | 87.4 | 87.1 | 86.4 | 85.5 | 84.8 |
| Wales | 86.8 | 86.4 | 85.7 | 84.8 | 84 |
| Scotland | 85.6 | 85.2 | 84.5 | 83.6 | 82.8 |
| Northern Ireland | 86.8 | 86.4 | 85.8 | 84.8 | 84.1 |
| UK | 87.2 | 86.9 | 86.2 | 85.3 | 84.5 |
| Source: Office for National Statistics | |||||
Download this table Table 4.5 Period expectation of life at birth in the year ending mid-2041 for the standard variants, UK
.xls (26.6 kB)
Figure 4.5: Estimated and projected period expectation of life at birth, UK, 1981 to 2041
Source: Office for National Statistics
Notes:
- Historic estimates are displayed on a calendar year basis while projected assumptions are displayed on a mid-year to mid-year basis
Download this chart Figure 4.5: Estimated and projected period expectation of life at birth, UK, 1981 to 2041
Image .csv .xls5. Links to further information
More detailed information on the method used to set the mortality assumptions as well as discussion of historical trends in mortality can be found in the mortality consultation papers.
The latest trends in period life expectancy for the UK and constituent countries are presented in the 2014 to 2016 National life tables.
All life expectancy figures given within this release are period life expectancies. Projected cohort life expectancies are due to be published in our Past and projected life tables publication in early December.
6. Appendix A: England charts
Figure 4.6a: Estimated and projected period expectation of life at birth, England, 1981 to 2066
Source: Office for National Statistics
Notes:
- Historic estimates are displayed on a calendar year basis while projected assumptions are displayed on a mid-year to mid-year basis
Download this chart Figure 4.6a: Estimated and projected period expectation of life at birth, England, 1981 to 2066
Image .csv .xls
Figure 4.6b: Estimated and projected period expectation of life at age 65, England, 1981 to 2066
Source: Office for National Statistics
Notes:
- Historic estimates are displayed on a calendar year basis while projected assumptions are displayed on a mid-year to mid-year basis
Download this chart Figure 4.6b: Estimated and projected period expectation of life at age 65, England, 1981 to 2066
Image .csv .xls7. Appendix B: Wales charts
Figure 4.7a: Estimated and projected period expectation of life at birth, Wales, 1981 to 2066
Source: Office for National Statistics
Notes:
- Historic estimates are displayed on a calendar year basis while projected assumptions are displayed on a mid-year to mid-year basis
Download this chart Figure 4.7a: Estimated and projected period expectation of life at birth, Wales, 1981 to 2066
Image .csv .xls
Figure 4.7b: Estimated and projected period expectation of life at age 65, Wales, 1981 to 2066
Source: Office for National Statistics
Notes:
- Historic estimates are displayed on a calendar year basis while projected assumptions are displayed on a mid-year to mid-year basis
Download this chart Figure 4.7b: Estimated and projected period expectation of life at age 65, Wales, 1981 to 2066
Image .csv .xls8. Appendix C: Scotland charts
Figure 4.8a: Estimated and projected period expectation of life at birth, Scotland, 1981 to 2066
Source: Office for National Statistics
Notes:
- Historic estimates are displayed on a calendar year basis while projected assumptions are displayed on a mid-year to mid-year basis
Download this chart Figure 4.8a: Estimated and projected period expectation of life at birth, Scotland, 1981 to 2066
Image .csv .xls
Figure 4.8b: Estimated and projected period expectation of life at age 65, Scotland, 1981 to 2066
Source: Office for National Statistics
Notes:
- Historic estimates are displayed on a calendar year basis while projected assumptions are displayed on a mid-year to mid-year basis
Download this chart Figure 4.8b: Estimated and projected period expectation of life at age 65, Scotland, 1981 to 2066
Image .csv .xls9. Appendix D: Northern Ireland charts
Figure 4.9a: Estimated and projected period expectation of life at birth, Northern Ireland, 1981 to 2066
Source: Office for National Statistics
Notes:
- Historic estimates are displayed on a calendar year basis while projected assumptions are displayed on a mid-year to mid-year basis
Download this chart Figure 4.9a: Estimated and projected period expectation of life at birth, Northern Ireland, 1981 to 2066
Image .csv .xls
Figure 4.9b: Estimated and projected period expectation of life at age 65, Northern Ireland, 1981 to 2066
Source: Office for National Statistics
Notes:
- Historic estimates are displayed on a calendar year basis while projected assumptions are displayed on a mid-year to mid-year basis