
Cynnwys
1. Introduction
We publish national population projections by age and sex for the UK and constituent countries every two years. We base them on the latest mid-year population estimates together with assumptions of future levels of fertility, mortality and migration.
The primary purpose of the projections is to provide information on potential future population levels. They are used as a common framework for national planning in a number of different fields.
The Government Actuary’s Department (GAD) produced the first projections of the population of the UK in the 1920s. These earliest projections were mainly used in connection with long-term financial estimates under the Contributory Pensions Acts and other schemes of social insurance. Projections made since the war, however, have been increasingly used in all areas of government planning. GAD produced projections each year from 1955 to 1979 and then every second year until 1991. There was then a 1992-based set and since then projections have reverted to being produced every second year. Office for National Statistics (ONS) took over responsibility for the production of the national population projections in 2006.
We occasionally produce additional “interim” projections. We published 2001-based projections following the 2001 Census and an additional set based on the 2003 estimates to incorporate revisions to the population estimates for England and Wales.
The main focus of the 2016-based projections is on the next 25 years up to 2041, though we also produce longer-term projections to 2116. The uncertainty of population projections increases the further they are carried forward and particularly so for smaller geographical areas and age-sex breakdowns. In addition to the principal (main) projections, we also make available variant projections, based on alternative assumptions of future fertility, mortality and migration. For more information on how ONS projections meet users’ needs along with information on their fitness for purpose, please see the report on quality and methodology.
The 2016-based projections supersede the 2014-based projections published on 29 October 2015.
We produce the projections on behalf of the National Statistician and the Registrars General of Scotland and Northern Ireland. We agree the underlying assumptions in liaison with the devolved administrations – Welsh Government, National Records of Scotland (NRS) and Northern Ireland Statistics and Research Agency (NISRA) – following consultation with the main users of projections in each country and advice from an expert advisory panel.
This report contains background information for the 2016-based national population projections. Included are sections on:
- defining the base population
- the method of projection
- background on principal and variant projections
- summary of the long-term assumptions of future levels of fertility, mortality and migration
- datasets available
- changes to State Pension age
- national population projections expert advisory panel
2. Base population
Definition
We use estimates of the usually resident population of the UK and its constituent countries at mid-2016 as our starting population. The usually resident population is defined by the standard United Nations definition for population estimates, and includes people who reside in the area for a period of at least 12 months whatever their nationality. Members of HM Armed Forces in the UK are included, but members of HM Armed Forces and their families who are abroad are excluded. Members of foreign armed forces in the UK are included, with any accompanying dependants.
Base populations for individual countries
We base the projections for England and Wales on the mid-2016 population estimates published by Office for National Statistics (ONS) on 22 June 2017. The projections for Scotland are based on the mid-2016 population estimates published by NRS on 27 April 2017, and likewise the projections for Northern Ireland are based on the mid-2016 estimates published by NISRA on 22 June 2017. Population estimates use the 2011 Census as the starting population and then update these annually to account for population change.
Table 1.1: Base population estimates for 2016-based projections, UK
| millions | |||||||||
| England | 55.3 | ||||||||
| Wales | 3.1 | ||||||||
| Scotland | 5.4 | ||||||||
| Northern Ireland | 1.9 | ||||||||
| United Kingdom | 65.6 | ||||||||
| Source: Office for National Statistics | |||||||||
Download this table Table 1.1: Base population estimates for 2016-based projections, UK
.xls (25.6 kB)Estimates of the population aged 90 and over
We prepare official mid-year population estimates by individual age to the age of 89 years, with an upper age band for all those aged 90 and over. We produce estimates of the population aged 90 to 104 years by single year of age and for the 105 and over age group using the Kannisto-Thatcher survivor ratio method, controlling the results to agree with the official estimates of all those aged 90 and over.
Nôl i'r tabl cynnwys3. Method of projection
We produce projections for successive years running from one mid-year to the next. For each age we take the starting population, account for net migration less the number of deaths, to produce the number in the population, one year older, at the end of the year. We then add survivors of those born during the year. Age is defined as completed years at the last birthday.
We assume migration occurs evenly throughout the year. For computing purposes, this is equivalent to assuming that half the migrants in a given year at a given age migrate at the beginning of the year and half at the end of the year. The number of net migrants we add to obtain the population aged x plus 1 at the end of the projection year therefore consists of half of those migrating during the year at age x and half of those migrating during the year at age x plus 1.
We obtain the number of deaths in a year by adding half of the net inward migrants at each age to the number in the population at the beginning of the year and applying the mortality rate qx+1/2, which is the probability of death between one mid-year and the next. The mortality rates we use in the projections represent the probabilities of death between one mid-year and the next, according to a person's age last birthday at the beginning of the period. The appropriate rate of infant mortality, the probability of a new-born child not surviving until the following mid-year, is also given. This is about 85% of the full, first year of life infant mortality rate more generally used in official statistics.
We calculate the number of births in the year by multiplying the average number of women at each single year of age during the year (taken as the mean of the populations at that age at the beginning and end of the year) by the fertility rate applicable to them during that year. We assume the total number of births in a year is divided between the sexes in the ratio of 105 males to 100 females, in line with recent experience. We calculate the number of infants aged zero at the end of the year by taking the projected number of births, deducting the number of deaths found by applying the infant mortality rate and adding half the number of net migrants aged zero at their last birthday.
We compute principal projections for each of the constituent countries of the UK and add together the results to produce projections for England and Wales, Great Britain and the UK.
Nôl i'r tabl cynnwys4. Summary of long-term assumptions
We base the new principal projections on the long-term assumptions of future fertility, mortality and net migration (that is, immigrants minus emigrants), summarised in Table 1.2. We agree the long-term assumptions in consultation with the Northern Ireland Statistics Research Agency (NISRA), the National Records of Scotland (NRS) and the Welsh Government. Table 1.2 compares figures for the 2016-based projections with the assumptions for the previous 2014-based projections.
Table 1.2: Long-term assumptions for the 2016-based national population projections compared with assumptions for the 2014-based projections, UK
| UK | England | Wales | Scotland | Northern Ireland | ||||||||||||||||||||||
|---|---|---|---|---|---|---|---|---|---|---|---|---|---|---|---|---|---|---|---|---|---|---|---|---|---|---|
| Fertility – Long-term average number of children per woman | ||||||||||||||||||||||||||
| 2016-based | 1.84 | 1.85 | 1.85 | 1.65 | 2.00 | |||||||||||||||||||||
| 2014-based | 1.89 | 1.90 | 1.90 | 1.70 | 2.00 | |||||||||||||||||||||
| Mortality - Expectation of life at birth in 20411 | ||||||||||||||||||||||||||
| Males 2016-based | 83.4 | 83.6 | 82.8 | 81.7 | 82.8 | |||||||||||||||||||||
| Males 2014-based | 84.3 | 84.6 | 83.7 | 82.5 | 83.6 | |||||||||||||||||||||
| Females 2016-based | 86.2 | 86.4 | 85.7 | 84.5 | 85.8 | |||||||||||||||||||||
| Females 2014-based | 87.1 | 87.4 | 86.7 | 85.2 | 86.7 | |||||||||||||||||||||
| Net international migration2 – Annual long-term assumption | ||||||||||||||||||||||||||
| 2016-based | +165,000 | +152,000 | +4,500 | +7,000 | +1,500 | |||||||||||||||||||||
| 2014-based | +185,000 | +170,500 | +4,000 | +9,500 | +1,000 | |||||||||||||||||||||
| Source: Office for National Statistics | ||||||||||||||||||||||||||
| Notes: | ||||||||||||||||||||||||||
| 1. Expectations of life for 25 years ahead given as specimen year. Note these are period expectations of life based on the mid-year mortality rates assumed for the year 2041 and do not take account of the continuing improvement in mortality projected beyond 2041. | ||||||||||||||||||||||||||
| 2. Net international migration does not include cross-border migration between the countries of the UK. | ||||||||||||||||||||||||||
Download this table Table 1.2: Long-term assumptions for the 2016-based national population projections compared with assumptions for the 2014-based projections, UK
.xls (28.7 kB)For the UK, the long-term assumption of average completed family size is 1.84 children per woman, 0.05 lower than the 2014-based projections. More information can be found in the Fertility assumptions section of the release.
Assumptions on improvements in principal mortality are broadly unchanged from the 2014-based projections. We assume annual improvement in mortality rates in 25 years time (2041) to be 1.2% for most ages for both males and females for all constituent countries of the UK. We assume lower annual rates of mortality improvement for those born before 1924.
Although we haven’t changed our assumptions about the long-term rate of improvement in life expectancy, actual life expectancy has increased less than projected since mid-2014. This means in each year of the 2016-based projections the projected life expectancy is lower than in the 2014-based projections. More information can be found in the Mortality assumptions section of the release.
The new long-term assumption for net international migration to the UK is +165,000 each year compared with +185,000 a year in the 2014-based projections. We calculate cross-border migration (moves between countries of the UK) by applying rates of movement between each pair of countries to the population by age and sex. The rates are derived as an average of the last five years’ estimates (2012 to 2016). More information can be found in the Migration assumptions section of the release.
Nôl i'r tabl cynnwys5. Datasets available
We have published projections to 100 years ahead. For each country and variant combination we have made two summary tables and a zipped open data file (XML format) available to download.
The first summary table contains the total projected population for all years of the projection, the components of change and other summary statistics.
The second summary table contains the projected population in five-year age groups for all years of the projection.
The XML open data files contain:
- population by single year of age (0 to 104 years), age groups (105 to 109 years, 110 and over) and sex
- fertility assumptions by single year of age of mother (15 to 46 years)
- mortality assumptions by single year of age (0 to 125 years) and sex
- cross-border rates for each country flow by single year of age (0 to 125 years) and sex
- births by age of mother (15 to 46 years)
- deaths by age (0 to 105 and over) and sex
- in, out and net cross-border migration by age (0 to 105 and over) and sex
- in, out and net international migration by age (0 to 105 and over) and sex
- in, out and net total migration by single year of age (0 to 105 and over) and sex
6. Changing State Pension age
Pensionable ages for men and women
Since 2010, State Pension age has been increasing. By 2020 it will change from 65 years for men and 60 years for women, to 66 years for both sexes. State Pension age will then increase to 67 years for both men and women between 2026 and 2028. Under the current law, State Pension age is due to increase to 68 years between 2044 and 2046.
The data presented in this bulletin do not reflect proposed further changes to State Pension age recently published by the government. Following a recent review, the government has announced plans to bring the current timetable forward. If these plans are adopted, State Pension age will increase to 68 years between 2037 and 2039.
The proportions used to calculate the population of working age and pensionable age, along with a worked example of how these proportions are applied, are available in the Table of State Pension Age Factors Pensions Act 2014.
Full details about the current and planned changes to State Pension ages under the Pension Acts of 1995, 2007, 2011 and 2014 can be found in Appendix C.
Nôl i'r tabl cynnwys7. National population projections expert advisory panel
An expert panel advises Office for National Statistics (ONS) early on in the assumption-setting process on current and emerging demographic trends and their possible implications for the national population projections. This panel met in 2017 to advise on the assumptions for 2016-based population projections.
The membership of the panel for the 2016-based national population projections was as follows:
- Professor Ann Berrington, University of Southampton
- Ben Corr, Greater London Authority
- Professor Peter Goldblatt, University College London
- Professor Carol Jagger, Newcastle University
- Dr Nik Lomax, University of Leeds
- Professor Mike Murphy, London School of Economics
- Professor John Salt, University College London
- Professor Ludi Simpson, University of Manchester
Panel meeting
A note of the panel meeting held on 4 April 2017 is available in Appendix A.
Questionnaire
The panel completed a questionnaire where they were asked what they thought were the most likely future levels of fertility, life expectancy and migration. We also asked for their views on the validity and importance of a wide range of factors that might be thought likely to influence future trends. The questionnaire was originally devised by the International Institute for Applied Systems Analysis (IIASA) in Vienna and has been adapted by ONS for use in the UK. We review the questionnaire for each projection round to ensure that the experts’ views on current and emerging trends are collected.
Details of the panel’s views on the most likely levels of the total fertility rate, life expectancy at birth and total net migration to the UK (and associated 67% and 95% confidence intervals) in the years 2020 and 2040 can be found in Appendix B.
Nôl i'r tabl cynnwys8. Appendix A: Minutes of expert panel
2016-based national population projection (NPP) expert advisory panel meeting
Government Actuary’s Department, Finlaison House
15-17 Furnival Street, London, EC4A 1AB
Tuesday 4 April 2017, 10:30am to 3:00pm
Expert group
Professor Ann Berrington, University of Southampton
Ben Corr, Greater London Authority
Professor Carol Jagger, Newcastle University
Professor John Salt, University College London
Professor Ludi Simpson, University of Manchester
Professor Mike Murphy, London School of Economics
Dr. Nik Lomax, University of Leeds
ONS Population Statistics Division attendees
Paul Vickers, Head of Population Outputs (Chair)
Adrian Gallop, Demographic Analysis Unit and Government Actuary’s Department
Emily Knipe, Demographic Analysis Unit
Sophie Chapman, Demographic Analysis Unit
Andrew Nash, Population Projections Unit
Paula Guy, Population Projections Unit (Secretary)
Yifan Zheng, Population Projections Unit (Secretary)
Liam Fleming, Analytical Impact Team (Shadowing Paul Vickers)
Observers
Denise Patrick, National Records of Scotland
William Howes, National Records of Scotland
Catherine O’Donnell, Northern Ireland Statistics and Research Agency
Olga Krikun, Office for National Statistics
Dan Horscroft, Office for National Statistics
Alan Evans, Office for National Statistics
Apologies
Professor Peter Goldblatt, University College London
Alan Jackson, Welsh Government
1. Introduction
1.1 Paul Vickers welcomed attendees and opened the panel.
1.2 He explained that the aim of the panel is to hear the experts’ full range of views on what long-term assumptions should be and not seek consensus where none existed. Though all opinions would be considered, the final decision on the assumptions to be adopted for the next set of projections rests with the NPP committee, which includes representatives from Office for National Statistics (ONS) and the devolved administrations.
1.3 Attendees of the panel introduced themselves.
1.4 Currently the national population projections (NPPs) are due to be published in October or November 2017.
2. Fertility
Introduction
2.1 Emily Knipe delivered a presentation on fertility trends and the results of the expert questionnaire:
2.2 The current total fertility rate (TFR) for the UK is 1.80. The long-term assumption for the TFR in the 2014-based projections was set at 1.89.
2.3 Trends for the four constituent countries were compared. Since the 2001 low point, TFR has been increasing in all countries, at roughly equal rates until about 2009. The trends for England and Wales were very similar over this time period; however, Wales experienced a larger dip in 2009 than England did, but both countries then recovered in 2010. A divergence has been noted more recently. The TFR in Northern Ireland (NI) has remained consistently higher than England and Wales but has been broadly stable since 2009. The TFR in Scotland remains consistently below England and Wales. Scotland also showed no clear recovery from the 2009 dip, instead showing consistent decreases since the peak in 2008. All countries’ TFR declined in 2013, for Scotland this was just a continuation of their five-year trend. There was some recovery in 2014. England and Wales and NI have levelled whereas Scotland has fallen again slightly in 2015.
2.4 Fertility rates by age were explored. Age specific fertility rates (ASFRs) for women in their 30s and 40s have been rising consistently since the late 1970s. Those aged 30 to 34 years have been the peak age group for fertility since 2004; previously the peak age group was 25 to 29 years.
2.5 Trends in cohort fertility were presented. Completed family size (CFS) has declined gradually since the 1945 birth cohort. The most recent cohort to have completed fertility was the 1969 cohort who had 1.90 children on average, which is very similar to the 1965 cohort (1.91).
2.6 Fertility of recent cohorts was compared with the 1969 cohort. In general, cohorts since 1969 have experienced higher teenage fertility but lower fertility in their early 20s than the 1969 cohort. They are partially catching up in their late 20s and 30s; though still remain below the 1969 cohort level. The two most recent cohorts (1990 and 1995) have seen lower teenage fertility compared with the 1969 cohort and fertility levels are remaining low in their early 20s.
2.7 Results of the expert questionnaire were discussed. Experts’ UK TFR estimates for 2040 averaged 1.79, this was lower than the figure of 1.82 from the 2014-based NPP expert panel. The lowest long-term estimate was 1.60 with the majority between 1.80 and 1.90; however, there was less certainty around these estimates than was expressed by the experts in the previous expert group meeting prior to the 2014-based projections.
2.8 In terms of the experts’ responses to questions regarding the forces and impacts of fertility, the majority agreed that changes in population composition and differential trends in fertility among population sub-groups would have an upwards effect on fertility. Changing bio-medical conditions would have an upwards or little or no influence, while trends in ideal family size and trends in income would have a downwards effect or little or no influence. There was some disagreement amongst experts on the effect of the changing nature and stability of partnerships, and trends in patterns of education and work.
2.9 Graphs showing the estimated TFR and ASFRs for UK-born and non UK-born mothers were presented. The TFR among non UK-born women was clearly higher than for UK-born women. However, the rates seem to be converging over time. UK-born and non-UK born women show different patterns of ASFRs. For all age groups, the non UK-born ASFR was above that of UK-born; this holds true in 2015 except for the under 20s age group, which was almost the same as the UK-born.
2.10 Trends on period parity progression were presented. Progression to higher parities is much lower, so around 40% of women who have two births go on to have a third. A similar proportion of women who have three births go on to have a fourth and so on. Progression to the first child rose until 2013 when it dropped, but progression to second child has stayed fairly steady with a small decline in 2013.
Discussion
2.11 An expert questioned whether the period TFR is the right indicator to be analysing, since a quarter of births in the UK are from non-UK born mothers. These women have low fertility exposure before they arrive and high fertility subsequently. This means that the period TFR is artificially inflated upwards.
2.12 There was a discussion on the link between fertility and migration. The experts noted UK and non-UK groups have different trends in fertility.
2.13 One expert highlighted research they had done using the ONS Longitudinal Study to look at the effects of migration on fertility. It was noted that the fertility of EU migrants is not necessarily affected the most by migration patterns. There are counteracting forces. Some non-UK born women come to the UK and bear children, others do not and some will come but their family building might change. There are a lot of unknowns and the relationship between migration and fertility can also change. They suggested that ONS needs to consider looking at fertility rates by country of birth as part of the projection methodology, and suggested this may be an area of further research. Finally, one expert stated that migration creates the biggest uncertainty about fertility, having both a direct and second generation impact.
2.14 One expert proposed exploring links between the fertility and migration assumptions. Another noted views expressed at the British Society for Population Studies (BSPS) Sub-national Projections Variants Day, that too much information is lost if a bottom-up approach to projections is not adopted. It was asked whether there is scope to incorporate the research suggested into the 2016-based NPPs, to which Paul explained there is limited scope for the upcoming projection. Emily will revisit the work undertaken after the last round of projections and plan work for the future.
2.15 There was a discussion on the relationship between house prices and fertility.
2.16 One expert stated there was evidence suggesting a strong link between housing affordability and family or partnership formation. The young are now more likely to be living in the parental home. If this feeds through to child-bearing, some of the drop in fertility for those in their 20s might be related to housing costs. However, other factors may also have an effect. For example, people staying longer in education, different contraception options, and the lagged impact of the government’s teenage pregnancy agenda.
2.17 Another expert pointed out trends seen in Denmark; where young people generally left home earlier compared with the UK but there was no strong evidence to suggest they have children earlier. It was also noted that Greece has a TFR of 1.3. Nearly half of all 15- to 34-year-olds are living with their parents and there is 50% unemployment. Housing and economic uncertainty are important influences there.
2.18 There was discussion on the effect of the decline in the availability of social housing in explaining some of the decline in fertility rates at younger ages, with young socio-economically disadvantaged families tending to be more reliant on social housing. It was also noted that the media focus on lack of affordability of housing is likely to have an impact on young people’s behaviour. More research is needed in this area.
2.19 It was suggested that family friendly policies are more powerful than housing in explaining fertility trends for some countries, although it was noted that these policies have a different impact on different sectors of society. In the UK, less educated women tend to have higher completed family sizes than graduates, whereas in Scandinavian countries policies support women to combine a career and family, meaning that educational differences in completed family sizes are smaller in some Scandinavian countries than they are in the UK.
2.20 One expert reflected on research, which shows that the reason why we see relatively high completed family sizes in the UK, as compared with some other European countries, is that the less educated tend to have children earlier and have larger completed family sizes, and these patterns counteract the relatively high levels of childlessness among female graduates.
2.21 It was noted by the experts that the rate of increase in fertility at older ages is not levelling off. The experts questioned whether this increase in older age fertility relates to the recuperation of postponed births and whether this may be due to the impact of family friendly policies introduced under the Labour Government.
2.22 One expert pointed out that an important unknown is whether those currently in their teens and 20s who are postponing childbearing will end up with lower completed family size than previous cohorts when they reach 45.
2.23 One expert felt intended family size is the most important factor affecting fertility – if people want children, they will find a way to have them.
2.24 Long-term trends were discussed and an expert felt that the drop in first birth rates will have the most impact. Currently just under 20% of women remain childless at age 45 in the UK, which is higher than some other countries. This could justify a lower long-term trend.
2.25 One expert questioned why trends in Scotland might have diverged from trends seen in England and Wales and why there has been a continued drop in the number of births. NRS will look into this.
2.26 Another expert suggested looking at fertility rates according to “time since leaving education” rather than age. Staying in education longer may reduce the time available to have more children since people would generally be having children later. With 50% of people now going into higher education, the expert questioned whether we have reached a point where that trend will stop.
2.27 There was a discussion about how experts had reached their conclusion of lower long-term fertility. One expert noted the strong association between the age at which a woman has her first child and completed family size (CFS). If childbearing starts later, there is less time to have a CFS of three or more children. They also took into account their assessment of future levels of migration. Another based their assumption on the current precariousness of employment and housing. Whilst another agreed on the point made about employment and economic uncertainty, they based their assumption on climate and environmental change impacting on attitudes.
2.28 It was noted that the availability of Child Tax Credit for a third child has now been restricted within current UK welfare policy. One expert had undertaken an analysis, which showed that receipt of Child Tax Credit is associated with the likelihood of making the transition to a third birth. However, this association does not prove a causal connection between the policy and fertility. Research by Mike Brewer on the introduction of the Child Tax Credit showed a small effect with the least educated women showing a slight rise in fertility.
2.29 The general consensus was the long-term TFR assumption of 1.89 should be lowered.
2.30 Experts felt Assisted Reproductive Technology (ART) would only have a small effect in the short term, but they were uncertain of its effect in the long term (25 or more years). In Denmark, 4% of births are via ART, however, only a fraction of those who would have started their fertility earlier can benefit.
2.31 There was further discussion relating to research carried out on ethnic projections concluding that, regardless of assumption, the population becomes more diverse over time. However, there is much uncertainty on the effect of this on fertility. Integration into British culture and the culture of particular groups may also have an effect on fertility decisions.
2.32 There was a discussion about whether the fertility rates of second and third generation migrants converge to those of the native population. For those born in Pakistan and Bangladesh, the births rates have converged but are still higher. A PhD thesis by Ben Wilson contains a more detailed analysis, which suggests there is convergence. It was noted that birth rates for second-generation migrants from countries such as Pakistan and Bangladesh depend on lifestyle, desires and expectations of the roles of women. It was noted that Poland has a lower fertility rate than the UK and there was speculation as to whether the fertility rates of second-generation Polish mothers will increase towards the UK average. One expert suggested looking at research on the fertility of second-generation ethnic minorities undertaken by Hill Kulu and Tina Hannemann. It was also noted that these differences give a regional pattern.
2.33 Emily asked whether TFR is the right method to use or whether parity progression ratios (which are lower than the traditional TFR) should be used. One expert explained that if parity progression ratios were used it would be difficult to know if a change in a pattern was due to a change of methodology in collecting information about birth order, or is a real trend.
2.34 Attendees discussed the use of variant projections. Experts felt that the high and low variants around population projections should not produce impossible figures. So rather than arbitrarily setting variants to plus or minus a certain figure, care should be taken in assessing whether the resulting projections could actually happen. One expert suggested exploring the use of confidence intervals similar to the UN projections. Paul noted that the high and low variants do not need to be symmetrical around the principal assumption if this means that one and/or the other is implausible. Another expert asked whether variants aim to show confidence or whether they are scenarios. They felt that if the variants are to indicate confidence, asymmetry is more sensible.
3. Mortality
Introduction
3.1 Sophie Chapman and Adrian Gallop gave a presentation on mortality trends and summarised the results of the expert questionnaire:
3.2 Past trends in UK period life expectancy at birth were reviewed. From 1841 to 2015, there were three stages; a slow increase in period life expectancy over the last half of the 19th century followed by a faster increase in 1900 to 1950 before a slower increase again from 1950 onwards. Period life expectancy at birth in 2015 was 79.1 years for males and 82.7 years for females, a gap of 3.7 years. Period life expectancy at age 65 years for females rose from the early 1900s whereas for males increases only really began from the late 1960s.
3.3 Period expectations of life at birth in 2015 were compared internationally. Japan continues to have the highest life expectancy at birth in the world for females, at 86.8 years. For males, Switzerland, at 80.7 years, has overtaken Japan (at 80.5 years).
3.4 UK age standardised mortality rates (ASMR) from 1995 to 2015 were presented. ASMR for both males and females have been falling; however, a small increase was seen from 2014 to 2015 for both sexes.
3.5 The standardised numbers of deaths from 2002 to 2015 were presented. There has been a clear steady decrease in the standardised number of deaths seen in both males and females from 2002 to 2011; however, since 2011, the trend began to slow down, and increased between 2014 and 2015. It is difficult to tell what will happen in the next few years.
3.6 ASMR by selected major cause for males and females for 1983 to 2013 was shown. Recent improvements in mortality have been driven by large falls in deaths from circulatory diseases. The ASMR for cancer is now higher than for circulatory diseases so is likely to have greater effect on future rates of mortality improvement.
3.7 Dementia and Alzheimer’s were the leading causes of death in females in 2015, while the leading cause of death was ischaemic heart disease for males. In 2015, dementia and Alzheimer’s accounted for 11.6% of all deaths registered in England and Wales while 11.5% of deaths were attributed to ischaemic heart disease.
3.8 Lexis diagrams (heat charts) of mortality show those born around the early 1930s continue to show the highest rates of mortality improvement; this was true for both males and females. It was noted that perhaps period effects were starting to dominate improvements for those aged 70 and under in 2010.
3.8 Adrian presented two methodologies that will be dual run for the 2016-based projections:
The University of Southampton (UoS) methodology:
- models mortality improvements using a generalised additive model (GAM)
- accounts for variation in mortality differences over time and between different ages and cohorts
- uses a smoothed combination of age, age-specific improvements, period and cohort effects with the relative size of each determined by the input data
- for older ages baseline mortality and age specific mortality differences are estimated using a parametric model
- uses long-term inputs
The UK population mortality projections methodology:
- estimate current rates of mortality improvement by age and sex
- set target rates of mortality improvement for some future year (the target year)
- make assumptions on method and speed of convergence of current improvement rates to target rates and how improvement rates change after target year
- apply successively to assumed base mortality rates
3.9 Assumed percentage changes in smoothed death rates between 2013 and 2014 were presented for males and females. Scotland was assumed to have different, mainly lower levels of improvement at some ages.
3.10 Potential drivers for future mortality change were listed as:
- changes in bio-medical technology
- policy changes and funding cuts to NHS and social care
- behavioural changes related to health
- decline in smoking prevalence
- lifestyles
- obesity
- emergence of new diseases (for example, Alzheimer's)
- re-emergence of old diseases (for example, TB)
- environmental change, disasters, wars
- changes in population composition, cohort effects, migrants
3.11 The choice of the target rate of improvement was then addressed. Adrian noted that rates of improvement for the older ages are of most importance as these ages are where most deaths occur. The standardised average rate of improvement over the last 100 years has been around 1.2% per annum. Cohorts exhibiting the greatest improvement will be aged 100 to 110 years in 25 years and so will not contribute much to the overall rate of improvement. There is continuing debate as to whether future technical, medical and environmental changes will have greater or lesser impact than in the past.
3.12 It was assumed cohorts with the highest improvement rates will continue to show higher rates of improvement.
3.13 Comparisons were made for historical and assumed overall annual rates of mortality improvement.
3.14 Projected ONS period life expectancies at birth in 2060 were compared to those projected in other countries by national statistics agencies. ONS projected period life expectancies at birth were ranked around the middle for the countries shown.
3.15 The expert questionnaires were summarised. When asked about six drivers of future improvements in mortality identified, the majority of responses were either small changes up or down or little or no change. Only one response estimated a large upward change due to biomedical technology. Obesity levels are expected to remain at similar levels and have little effect on mortality.
3.16 The general opinion is that the target rate should vary by age and be the same for males and females. Opinion varied on what the target rate should be – 1.2% was the target rate in the 2014-based projections and most experts agreed with this for this round. There was some suggestion of females slowing to 1.0%. Most thought that the higher rates will continue for the golden cohort and reduce in the next 5 to 25 years. Having the higher target rates for the golden cohort doesn’t have a large effect.
3.17 The responses from the expert questionnaire gave an average life expectancy of 80.2 years for males and 83.8 years for females in 2020. Both male and female averages were lower by 0.1 compared with the previous expert panel.
3.18 In 2040, the expert responses gave average life expectancies of 84.4 years and 87.5 years for males and females respectively. In the 2014-based expert panel the life expectancies were averaged as 84.9 years for males and 88.2 years for females. The experts’ average life expectancy at birth for 2040 is higher than what was projected for that year in the 2014-based projections.
Discussion
3.19 Questions regarding the choice of target rate of mortality improvement were presented to the experts. These encouraged discussion around whether 1.2% is too optimistic, whether the improvement rates should be varied by age and whether the same rate should be assumed for men and women. It was noted that in the US and Canada projections for their social security programs, which also use long-term target rates of improvement, the assumed target improvement rates are varied by age. However, depending on the size and differentials in improvement rates between ages this can lead to mortality rates crossing over in future years with those at older ages falling below those at younger ages.
3.20 Adrian explained there has been little improvement over the last five years in mortality. For 2015 this was initially thought to be the result of an ineffective vaccine against the strains of flu prevalent in 2015 but recent research suggests this was not the main cause. It is not known whether this deviation from the long-term trend was simply a “blip” or whether it signalled the emergence of a new trend.
3.21 Adrian noted that there is more interest in what the long-term improvement rates should be. When looking at the drivers of mortality improvement, there is no evidence to suggest obesity is improving and it is believed that most of the gains from changes in smoking patterns have now been realised.
3.22 An expert noted that Danny Dorling’s research found the recent deviations in period life expectancy to be significant for those aged 60 and over.
3.23 Further discussion surrounded the advances in medicine and the effect of “levelling out” of disease treatments and whether an improvement rate of 1.2% was too optimistic. Paul gave the example of the advances in the treatment of heart disease providing less improvement to mortality in recent years. One expert explained these “flattening” trends are also seen in other countries. Another expert stated that although these trends are observed in other countries, the causes may be different; for example, they could be related to the use of recreational drugs in certain countries.
3.24 An expert asked what was known for those aged 65 to 74 and over and whether differences in life courses, drug and alcohol use were taken into account in mortality assumptions. Adrian explained the argument for assuming an improvement of below 1.2% includes considering life courses, alcohol consumption and drug use.
3.25 One expert pointed out social economic status (SES) affects mortality too, and another expert stated that mortality also varies by ethnic groups with additional differences dependent on ethnic composition and employment composition. However, the calculation of ethnic differentials is dependent on data availability. Adrian noted that migrants tend to be among the healthiest of their country but this varies by reason for migrating but they may be more, or less, healthy than the general population of the country they migrate to. The question is then whether the mortality of migrants tends to that of the home population over time; for instance, migrants to the UK receive the same medical support as the UK population.
3.26 One expert felt an improvement rate of below 1.2% may not be suitable despite the changes seen in the last five years as the starting mortality will be higher. The expert had heard no evidence to justify reducing the improvement rate.
3.27 The variant assumptions were discussed again. It was suggested that variants should be based on possibility as opposed to simply a different value of the assumptions as a variant that is very unlikely to occur is of little use. On the other hand such variants can be used to illustrate sensitivities to the choice of assumptions. One expert noted a strong argument for asymmetric bounds for mortality as improvement rates could be lower but there is not much chance they will be higher. Adrian noted that a 2.4% per annum long-term improvement rate (the higher variant for the 2014-based NPPs) is more difficult to explain as a possibility but could represent a continuation of the rate of improvements in the life expectancy observed in the past.
3.28 There was a brief discussion on the methodology employed by other statistical organisations such as the UN, which produces probabilistic mortality assumptions.
3.29 Adrian described the ONS methodology and explained the ONS currently use a top-down approach that analyses data for the UK as whole then derives assumptions for each constituent country from that. There is a 25-year run in period before the mortality assumptions are held constant and the same for all constituent countries. ONS is undertaking research into using a more bottom-up approach to mortality.
3.30 An expert asked what assumptions are made about the future trend in inequalities in mortality, or how changes would develop by socio-economic status (SES), to which Adrian responded ONS do not make assumptions by SES.
3.31 Another expert asked how much of the regional difference in life expectancy in the UK is due to regional patterns of industry, and whether in future generations, the regional patterns will converge.
3.32 One expert discussed evidence that obesity in the UK is increasing and asked whether other experts think a link between obesity and mortality will develop, stating obesity was not found to affect mortality in the past; however, with the recent “flattening” mortality trends, would obesity now have an effect? Another responded that obesity has a large effect on long-term morbidity but not on mortality. Also noted was the Foresight report, which stated that obesity is leading to increases in other causes of mortality. On the other hand, statins may be overcompensating for obesity.
3.33 An expert questioned the effect of Brexit on mortality, suggesting that the UK’s departure from the EU may lead to older generations returning to the UK. Although these people are likely to have lower mortality risk they might place a strain on the health care system.
3.34 One expert summarised that the experts cannot think of anything in particular that will have a major effect on mortality in the next 10 years.
4. Migration
Introduction
4.1 Paul opened the migration discussion and stated the overall consensus is migration is the most difficult component to project.
4.2 Andrew Nash gave a presentation on migration, highlighting recent trends and previous assumptions.
4.3 Under the 2014-based principal national population projection, the UK net migration projected for mid year ending 2015 was 329,000, the figure from the long-term international migration (LTIM) data series was estimated at 336,000 for the same period. The projected net migration for mid year ending 2016 was 256,000; the provisional LTIM figure was estimated to be 335,000.
4.4 Net migration remained relatively low until around 1997. Further increases were seen during the 2000s, this was in part as a result of immigration of citizens from the countries that joined the EU in 2004. Since the mid-2000s, annual net migration has fluctuated between around 150,000 and 300,000. There was a notable drop in net migration from 2010 to 2013 before rising to 332,000 in the year ending December 2015, the highest calendar year figure on record.
4.5 The latest provisional data indicate a statistically significant increase in Romanian and Bulgarian (EU2) immigration from 55,000 to 74,000 in the year ending September 2016.
4.6 The latest figures show around 43% of all immigration is from outside of the EU, 45% are from the EU and the rest are British. Historically, non-EU immigration has always exceeded EU immigration; provisional figures for the year ending September 2016 shows EU migration exceeding non-EU for the first time.
4.7 Work and study have been the main reasons for immigration in the recent past. Immigration for work-related reasons dropped off from the end of 2007 in the wake of the credit crunch. Study increased around the same time and overtook work as the most common reason for migration. This trend was then reversed in 2013 when work overtook study and peaked at 311,000 in the year ending June 2016. Immigration for study remained relatively stable over the same period but saw a statistically significant decrease most recently from 175,000 in the year ending September 2015 to 134,000 in the year ending September 2016. Work now accounts for 49% of immigrants while 22% immigrated for study.
4.8 The top five most common countries of last residence in 2015 were Romania, China, Poland, India and Spain.
4.9 In the latest available figures, around 40% of all emigration is by British citizens, 32% by non-EU and 29% by EU. Emigration of British citizens has remained stable since 2013; an increasing trend is seen for EU citizens since 2012.
4.10 Work is the most common reason from emigrating from the UK; over half (53%) of all emigrants left the country for work-related reasons in the year ending June 2016.
4.11 The most common countries of next residence in 2015 were Australia, US, Spain, France and China. Australia has remained the most common country of next residence since 1996. However, the number of people emigrating to Australia has fallen every year since 2011. In 2015 a total of 32,000 people emigrated to Australia, down from 38,000 in 2014.
4.12 Results of the expert questionnaire were discussed. There was much uncertainty from the experts indicated by mixed responses.
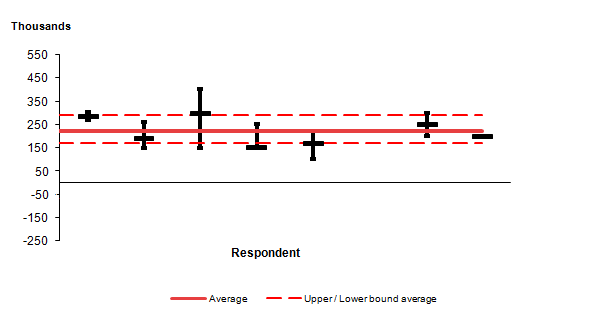
4.13 The average response of net migration in 2020 was 221,000 with average confidence ranges of 170,000 to 289,000 at 67% confidence and 64,000 to 354,000 at 95% confidence.
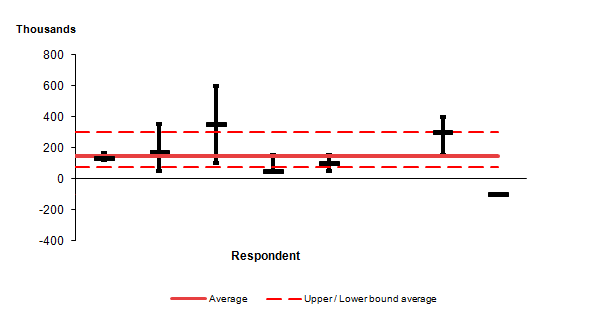
4.14 The average response of net migration in 2040 was 144,000 with average confidence ranges of 78,000 to 303,000 at 67% confidence and -61,000 to 374,000 at 95% confidence.
Discussion
4.15 When asked for thoughts on the effect of the economy, political instability and the UK’s exit from the European Union (“Brexit”), one expert pointed out they felt it was a difficult question to answer; there are distinct groups of migrants to consider. For example, those coming to study may be affected by exchange rates while those coming for work may be affected by policy. The expert also pointed out that policy changes could override the effects of all of those previously mentioned and that it was impossible to know the effect of any future policies at this stage.
4.16 The same expert highlighted the huge uncertainty on the UK’s exit from the EU explaining that although Brexit is a short-term process, it is impossible to predict the future, giving an example of “No one can say for sure whether the EU would still exist in its current form by 2040”.
4.17 One expert explained the need to look at different routes of entry for migration, summarising:
- there will probably not be much change to the number of asylum seekers; the UK has historically not been associated with accepting large number of refugees and asylum seekers in comparison with other EU countries
- there may be a change in the number of students; although there is demand from UK universities for international students, the attractiveness of UK universities may be decreasing due to other countries offering higher education in the English language
- there are currently work restrictions placed on non-EU students after graduation in the UK; other countries in the EU are actively encouraging international students to enter their work forces while there are no such policies in the UK at present
- although there may be a brief decline in net migration, the expert felt that over time net flows will again increase as a result of family reunification
- in terms of the UK’s dependency on EU workers in sectors such as agriculture, the expert highlighted that prior to the accession of EU8 countries, there was much more capital investments in these sectors, which stopped as more EU workers entered the work force; however, the capital investment may once again increase in response to a diminishing EU work force leading to less demand for low-skilled work – although specific skills will always be required, the expert felt that overall the net migration to the UK will decrease after Brexit
- reference was made to research by the National Institute of Economic and Social Research on National Insurance number registrations and International Passenger Survey (IPS) data; the research showed evidence to suggest that net migration will go down if there is no freedom of movement
4.18 One expert asked that although sectors such as agriculture have been considered, what about the care sector?
4.19 The previous expert responded with the following comments:
- from a previous project, just prior to 2004, some evidence suggested that the care sector in the UK was still “old fashioned”, and could input new technology, reducing the need for face-to-face contact and thus demand for workers
- evidence from other EU countries at last autumn’s OECD and SOPEMI conference suggests that migrants from EU8 and EU2 countries who might otherwise have come to the UK are going elsewhere, such as Germany and Austria
- it would be useful to monitor the statistics of the other EU countries to see what evidence there is of flow diversion
4.20 Another expert’s view is that the long term is much more important than the short term. The UK may initially implement restrictive visa policies after leaving the EU resulting in lower levels of migration in the short term. However, since the process of leaving will take at least two years, such policies could also increase migration as migrants seek to enter the UK before they are officially enforced. Additionally, it is impossible to know how long restrictive policies will be in place, and there could also be changes to migration streams once the UK leaves the EU. In the long term, policies will adapt in response to needs. Overall this expert felt there will be a decline in net migration in the long term but levels would remain at the hundreds of thousands.
4.21 Another view was that a reduction in emigration resulting from less EU migrants in the UK would also have an impact on net migration. Andrew noted that it is currently easy for British people to work in the EU. Places such as China have growing opportunities. When suggested that British people might emigrate to countries with stronger economies such as Australia, one expert noted that the end of the mining boom is already suppressing internal migration and in the next few years there is likely to be a decline in international immigration to Australia.
4.22 An expert commented on producing projections of economy then producing population projections around them.
4.23 The experts warned against producing a “knee-jerk” decline in projections stating that policy-makers would find a scenario based on a growing population and people continuing to migrate in the long term more useful. The projections should not attempt to pre-empt policy change. Instead, the assumptions of the projections should be communicated clearly.
4.24 In response to being asked their views on cross-border migration, one expert asked if any work has been done on producing internal migration rates in the sub-national population projections using the same basis as the NPPs using the Statistics Canada model. Andrew confirmed that the ONS is not currently undertaking such work.
4.25 One expert noted that the government has been keen to attract migrants of working age. With Brexit there might be incentives to increase cross-border migration. Another suggested a potential skills shortage in London might result in more movement across the UK.
4.26 Andrew asked for the experts’ views on the use of a simple 25-year average to set long-term assumptions, since such a period would include periods of historically high migration along with the comparatively lower levels of net migration seen over the 1990s. It also includes the period prior to EU accession and after the vote to leave the EU.
4.27 The experts agreed with the simplicity and transparency of the approach and an expert further commented that there was no point in using complex methods if they do not add anything.
4.28 When asked after how many years the long-term assumption should begin, there were no strong views. One expert noted that Brexit would suggest a longer rather than a shorter run in. Another noted that 10 years would reflect a full economic cycle.
4.29 There was a general consensus of massive uncertainty surrounding migration.
4.30 Andrew asked experts for their feedback on the expert questionnaire.
4.31 The experts seemed to appreciate being able to provide confidence intervals around their suggested assumptions. There were mixed views on whether the 67% and 95% confidence questions should be reduced to only one confidence level.
4.32 An expert stated that ONS should consider the onward use of NPPs in terms of sub-national population projections, a bottom-up approach to projections may be an alternative.
4.33 Paul stated the principal projections will be independent, but if stakeholders want a variant under certain assumptions, these could be produced.
4.34 An expert asked what will happen in regards to collaboration with Eurostat to which Paul answered ONS are not sure at this stage and it is dependent on negotiations.
5. AOB
5.1 In closing, Paul thanked all attendees and experts for their participation.
Nôl i'r tabl cynnwys9. Appendix B: Expert panel analysis
The national population projections (NPP) expert advisory panel of eight demographic experts met in April 2017. In an accompanying questionnaire, we asked for their opinions on the likely future levels and trends in fertility, mortality and migration. This section summarises the main findings.
Fertility
Short-term trends in UK fertility
In terms of likely trends in age-specific fertility rates (ASFRs) up to 2020, all experts thought the ASFRs would decrease for women under the age of 20 years. For women in their 20s one expert thought the ASFRs would remain stable, all other experts thought the ASFRs would decrease. For women aged 30 and over the majority of experts thought the ASFRs would increase.
We asked experts what they expected period total fertility rate (TFR) to show in the short term (up to 2020). Five thought the TFR would continue at the levels of 2015 (1.80), and the remaining three thought TFR would experience a small and continued decrease. The main reasons given were that economic uncertainty and changes to immigration policies associated with Brexit were likely to result in the postponement of births.
Quantitative estimates for 2020
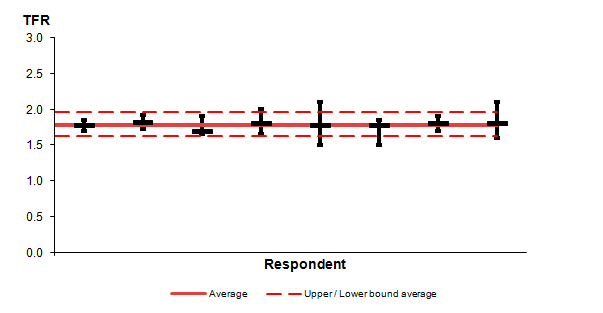
We asked the experts to quantify the most likely level of the TFR in 2020, together with values that would define a range with 67% and 95% likelihood. Figures 1.1 and 1.2 show the predictions for 2020. Estimated TFRs for 2020 ranged from 1.70 to 1.82; four were between 1.80 and 1.82. The mean was 1.78; this is lower than the 2014-based projection for 2020 of 1.84. On average, experts believed that there was a 67% chance of the TFR lying between 1.66 and 1.95 in 2020 and a 95% chance of it lying between 1.64 and 1.94 (these figures are based on the experts’ responses as written; we are aware the measures are inconsistent).
Figure 1.1: Respondents' estimates of the total fertility rate (TFR) in 2020 (and associated 67% confidence intervals), UK

Source: Office for National Statistics
Download this image Figure 1.1: Respondents' estimates of the total fertility rate (TFR) in 2020 (and associated 67% confidence intervals), UK
.png (4.8 kB) .xlsx (8.8 kB)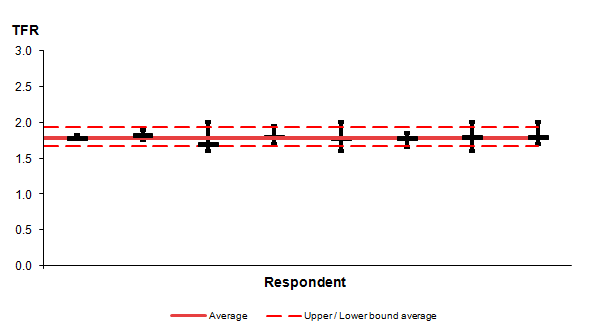
Figure 1.2: Respondents' estimates of the total fertility rate (TFR) in 2020 (and associated 95% confidence intervals), UK
Source: Office for National Statistics
Download this image Figure 1.2: Respondents' estimates of the total fertility rate (TFR) in 2020 (and associated 95% confidence intervals), UK
.png (4.9 kB) .xlsx (7.8 kB)
Long-term trends in UK fertility
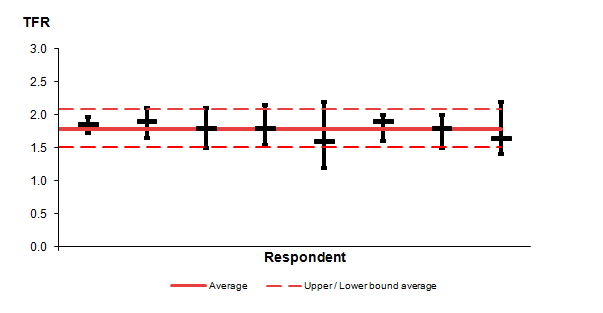
We asked the experts for their views on the most likely level of the total fertility rate (TFR) in 2040. The average TFR predicted for 2040 was 1.79; this is lower than the 2014-based projection of a TFR of 1.89 in 2040, which may support decreasing the long-term assumption. Six out of eight experts thought that the TFR would be between 1.80 and 1.90 in 2040, while two experts estimated lower TFRs of 1.60 and 1.65. On average, experts believed that there was a 67% chance of the TFR in 2040 lying between 1.60 and 1.98 and a 95% chance of it lying between 1.54 and 2.06.
Figure 1.3: Respondents' estimates of the total fertility rate (TFR) in 2040 (and associated 67% confidence intervals), UK

Source: Office for National Statistics
Download this image Figure 1.3: Respondents' estimates of the total fertility rate (TFR) in 2040 (and associated 67% confidence intervals), UK
.png (5.1 kB) .xlsx (7.9 kB)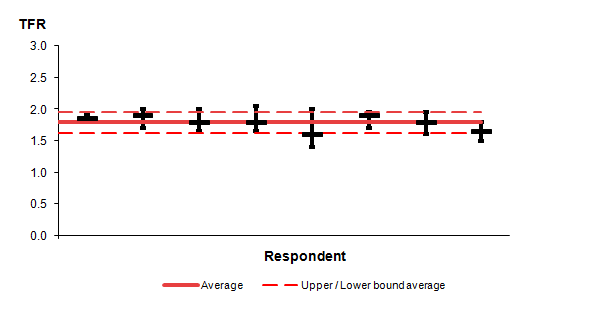
Figure 1.4: Respondents' estimates of the total fertility rate (TFR) in 2040 (and associated 95% confidence intervals), UK
Source: Office for National Statistics
Download this image Figure 1.4: Respondents' estimates of the total fertility rate (TFR) in 2040 (and associated 95% confidence intervals), UK
.png (5.6 kB) .xlsx (7.8 kB)
Underlying forces that may influence future fertility
We asked the panel to consider six forces with the potential to affect fertility levels in the long-term (to 2040) and assess the overall likely impact on future family size.
There was the highest level of agreement that “Changes in population composition and differential trends in population sub-groups, for example, the fertility of non-UK born groups”, would lead to a small upwards trend in fertility. Seven of eight panellists held this opinion, while one expert thought it would lead to a small downwards trend.
Most experts thought the “Trend in ideal family size and (the strength of) individual desires for children” would have little or no effect on fertility (five out of eight). Two thought it would have a small downwards effect, while one thought it would have a small upwards effect.
Half of the experts thought “Trends in patterns of education and work (including the proportion of time dedicated to the professional side of life)” would have a small downwards effect on fertility. Two thought it would have little or no effect, and two thought it would have a small upwards effect.
Half of the experts thought “Trends in income (including indirect income such as free childcare hours)” would have little or no effect on fertility. Three thought it would have a small downwards effect and one thought it would have a small upwards effect on fertility. One expert highlighted the research that shows the receipt of Child Tax Credit is positively associated with having a third child.
There was a mixed opinion on the effect of the “Changing nature and stability of partnerships, for example, the rise of cohabiting parents” on fertility. Three thought it would have little or no effect, another three thought it would lead to a small downwards effect and two thought it would lead to a small upwards effect.
The experts were split over the effect of “Changing biomedical conditions such as new or greater use of assisted reproductive technologies” on fertility. Half of the panellists thought it would have a small upwards effect, while the other half thought it would have little or no effect.
Additional forces some experts felt to be important in shaping future fertility were macroeconomic and political factors, shortages of affordable housing, the changing patterns in social interaction and the increased tendency to communicate remotely via social media.
Mortality
Short-term trends in UK mortality
We asked the experts for their views on expectations of life at birth in the UK, and on a series of factors that could influence mortality either positively or negatively.
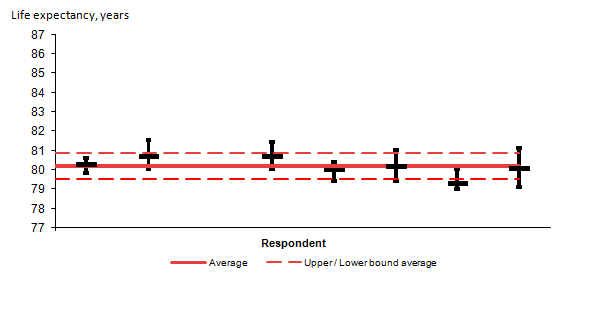
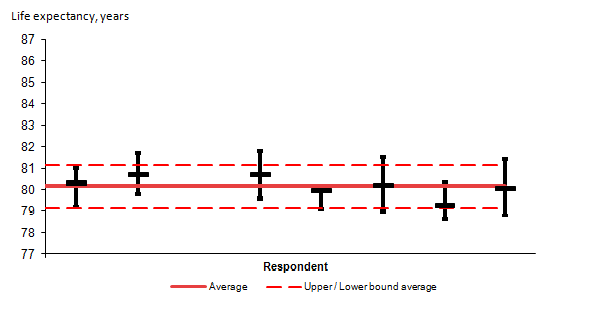
On average the experts estimated the male expectancy of life at birth would be 80.2 years in 2020 and for females it would be 83.8 years. These values are lower than the 2014-based projected values for 2020 of 80.8 years for males and 84.1 years for females. The average 67% confidence intervals were 79.5 to 80.9 years for males and 83.0 to 84.4 years for females; and average 95% confidence intervals were 79.2 to 81.1 years for males and 82.5 to 84.6 years for females. One expert did not respond to this question.
Figure 1.5: Respondents’ estimates of period life expectancy for males in 2020 (and associated 67% confidence intervals), UK
Source: Office for National Statistics
Download this image Figure 1.5: Respondents’ estimates of period life expectancy for males in 2020 (and associated 67% confidence intervals), UK
.png (5.5 kB) .xlsx (8.9 kB)
Figure 1.6: Respondents’ estimates of period life expectancy for males in 2020 (and associated 95% confidence intervals), UK
Source: Office for National Statistics
Download this image Figure 1.6: Respondents’ estimates of period life expectancy for males in 2020 (and associated 95% confidence intervals), UK
.png (6.1 kB) .xlsx (8.0 kB)
Figure 1.7: Respondents’ estimates of period life expectancy for females in 2020 (and associated 67% confidence intervals), UK
Source: Office for National Statistics
Download this image Figure 1.7: Respondents’ estimates of period life expectancy for females in 2020 (and associated 67% confidence intervals), UK
.png (5.6 kB) .xlsx (7.9 kB)
Figure 1.8: Respondents’ estimates of period life expectancy for females in 2020 (and associated 95% confidence intervals), UK

Source: Office for National Statistics
Download this image Figure 1.8: Respondents’ estimates of period life expectancy for females in 2020 (and associated 95% confidence intervals), UK
.png (5.9 kB) .xlsx (7.9 kB)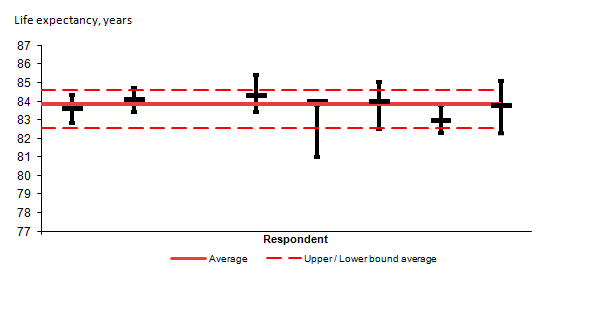
Long-term trends in UK mortality
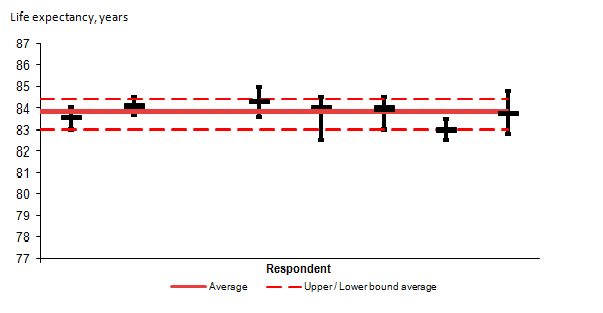
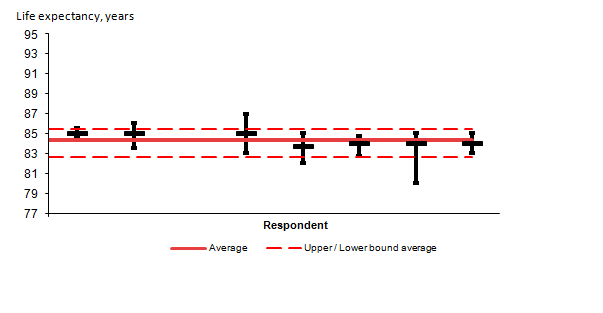
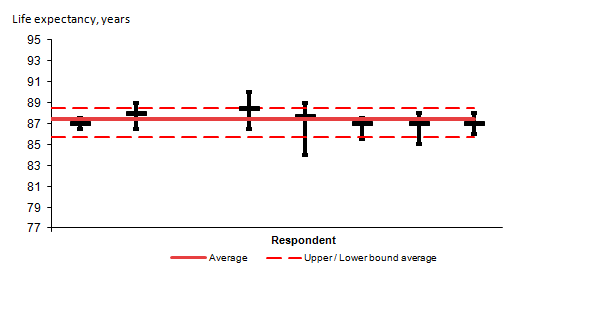
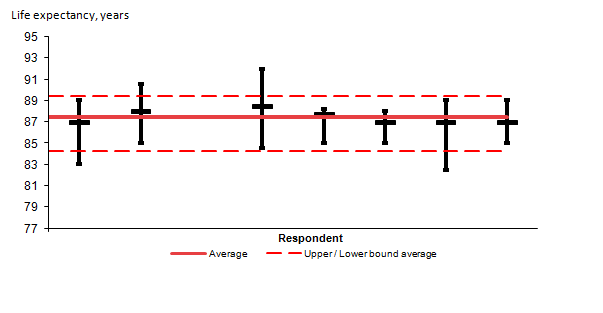
On average the experts estimated the male expectancy of life at birth would be 84.4 years in 2040 and for females it would be 87.5 years. These values are higher than the 2014-based projected values for 2040 of 84.2 years for males and 87.0 years for females. The average 67% confidence intervals were 82.7 to 85.5 years for males and 85.7 years to 88.4 years for females; and average 95% confidence intervals were 81.3 to 86.8 years for males and 84.3 to 89.4 years for females. One expert did not respond to this question.
Figure 1.9: Respondents’ estimates of period life expectancy for males in 2040 (and associated 67% confidence intervals), UK
Source: Office for National Statistics
Download this image Figure 1.9: Respondents’ estimates of period life expectancy for males in 2040 (and associated 67% confidence intervals), UK
.png (5.4 kB) .xlsx (7.9 kB)
Figure 1.10: Respondents’ estimates of period life expectancy for males in 2040 (and associated 95% confidence intervals), UK

Source: Office for National Statistics
Download this image Figure 1.10: Respondents’ estimates of period life expectancy for males in 2040 (and associated 95% confidence intervals), UK
.png (6.4 kB) .xlsx (7.9 kB)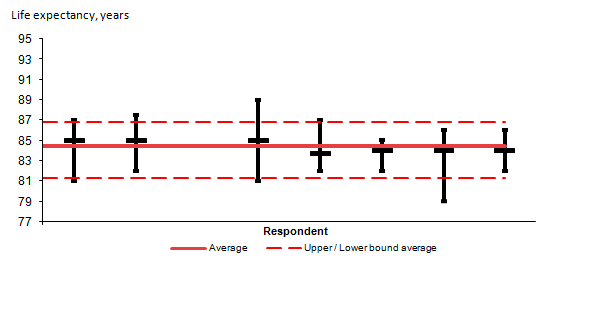
Figure 1.11: Respondents’ estimates of period life expectancy for females 2040 (and associated 67% confidential intervals), UK
Source: Office for National Statistics
Download this image Figure 1.11: Respondents’ estimates of period life expectancy for females 2040 (and associated 67% confidential intervals), UK
.png (5.5 kB) .xlsx (7.9 kB)
Figure 1.12: Respondents’ estimates of period life expectancy for females in 2040 (and associated 95% confidential intervals), UK
Source: Office for National Statistics
Download this image Figure 1.12: Respondents’ estimates of period life expectancy for females in 2040 (and associated 95% confidential intervals), UK
.png (6.4 kB) .xlsx (7.9 kB)
Forces likely to affect life expectancy
We asked the experts to assess the main forces that could affect the future path of life expectancy at birth (EOLB) over the next 25 years. The majority opinion was that changes in health-related behaviours and biomedical technology were most likely to result in improvements to EOLB.
Seven out of eight experts thought the resurgence of old diseases and/or new infectious diseases were most likely to result in a decrease to EOLB. Around half thought environmental change, disasters and war, changes in the population composition, and the effectiveness of the health care system would have a downwards effect on EOLB.
Additional factors the experts noted could be important drivers of life expectancy over the next 25 years are access to social care for the elderly and increasing antibiotic resistance.
Likely improvements to life expectancy
The majority opinion was that the annual rates of improvement assumed for the 25th year should be kept as 1.2% per year as in the 2014-based projections. Some experts felt this rate should be reduced to 1.0%; males (two out of eight) and females (three out of eight).
Five out of eight experts did not feel it was reasonable to assume the annual rates of improvement for the 25th year should be the same for all ages. The main reason expressed was that they believed that for the very old the rate should decrease with increasing age.
The majority thought the rates of mortality improvement for cohorts born between 1925 and 1938 should continue to be higher than the rates of mortality improvement for those born before 1925 or after 1938. Three experts thought the rates of mortality improvement would remain higher, one thought the rates would subsequently decrease in the short term, and two experts thought it would decrease over the medium term (5 to 25 years).
Obesity levels
The majority of experts thought obesity levels would remain broadly similar or increase over the next 25 years. One expert thought obesity levels would decrease.
The majority opinion was that these predicted changes in obesity levels would result in little change on life expectancy over the next 25 years. Two experts thought it would have a small downwards effect and one thought it would have a small upwards effect.
Long-term international migration
We asked the experts about their views on the levels of long-term international migration to and from the UK in 2020 and 2040 (five years and 25 years into the future from the 2015 estimates, which were the latest available at the time).
Only seven of the eight experts provided estimates of likely future levels of long-term international migration. In addition, one expert did not provide 67% confidence intervals around their estimated future levels of net migration but did provide 95% confidence levels.
Long-term international migration in 2020
The experts predicted that, on average, annual long-term immigration to the UK in 2020 would be 516,000, with an average 67% confidence interval of 400,000 to 589,000 and 95% confidence interval of 323,000 to 627,000.
The average annual long-term emigration from the UK in 2020 was predicted to be 313,000, with an average 67% confidence interval of 258,000 to 383,000 and 95% confidence interval of 226,000 to 410,000.
The average annual long-term net migration to the UK in 2020 was predicted to be +221,000, with an average 67% confidence interval of +170,000 to +289,000 and 95% confidence interval of +64,000 to 354,000.
The upper and lower band averages were influenced by two experts’ very wide confidence interval estimates.
Figure 1.13: Respondents' estimates of net migration in 2020 (and associated 67% confidence intervals), UK
Source: Office for National Statistics
Download this image Figure 1.13: Respondents' estimates of net migration in 2020 (and associated 67% confidence intervals), UK
.png (5.3 kB) .xlsx (8.9 kB)
Figure 1.14: Respondents' estimates of net migration in 2020 (and associated 95% confidence intervals), UK

Source: Office for National Statistics
Download this image Figure 1.14: Respondents' estimates of net migration in 2020 (and associated 95% confidence intervals), UK
.png (6.9 kB) .xlsx (8.0 kB)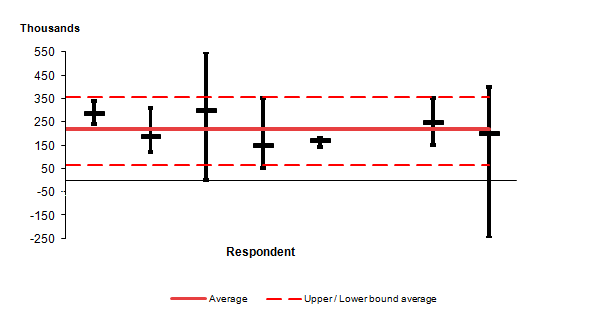
Long-term international migration in 2040
On average the experts estimated annual long-term immigration to the UK in 2040 would be 441,000, with an average 67% confidence interval of 318,000 to 556,000 and 95% confidence interval of 230,000 to 630,000.
For long-term emigration from the UK, on average the experts thought in 2040, 318,000 would leave the UK. The average 67% confidence intervals were 214,000 to 413,000 and 95% confidence intervals were 170,000 to 469,000.
The average annual long-term net migration to the UK in 2040 was predicted to be +144,000; with the average 67% confidence interval of +78,000 to +303,000 and 95% confidence interval of -61,000 to +374,000. This is considerably lower than the longer-term assumption for the 2014-based projection of +185,000 per year.
Figure 1.15: Respondents' estimates of net migration in 2040 (and associated 67% confidence intervals), UK
Source: Office for National Statistics
Download this image Figure 1.15: Respondents' estimates of net migration in 2040 (and associated 67% confidence intervals), UK
.png (5.2 kB) .xlsx (8.0 kB)
Figure 1.16: Respondents' estimates of net migration in 2040 (and associated 95% confidence intervals), UK

Source: Office for National Statistics
Download this image Figure 1.16: Respondents' estimates of net migration in 2040 (and associated 95% confidence intervals), UK
.png (6.6 kB) .xlsx (8.0 kB)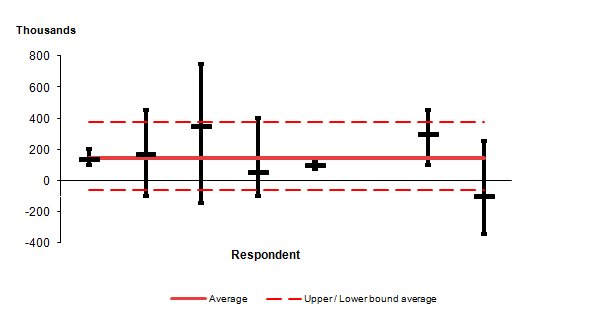
We invited the experts to consider four forces that could influence future international migration to the UK and assess the importance of these forces on UK net migration. These forces were:
- the economy
- political instability
- environmental change
- Brexit
Economy
The experts had mixed views on how the changing global economy would affect UK net migration in both the short and long term.
In the short term, three experts thought it would have a small upwards effect, three thought it would have little or no effect, and two thought it would have a small downwards effect.
In the long term, three thought it would have a small downwards effect, one a large downwards effect, three a small upwards effect, and one thought it would have little or no effect.
Some experts thought possible stagnation of the economy or economic uncertainty would be likely to act as a deterrent for UK immigration.
Global political instability
In the short term the majority of experts thought global political instability would have a small upwards effect on UK net migration (five out of eight). Three experts thought it would have little or no effect in the short term.
In the long term six out of eight experts thought political instability would have a small upwards effect on UK net migration. Two experts thought it would have little or no effect.
There was consensus from the experts that future political instability would be likely to result in an increase in refugees in both the short and long term; however, the UK’s willingness to accommodate them would largely be determined by government policy.
Environmental change
Half of the experts thought environmental change would cause little or no effect on the levels of UK net migration in the short term. The remainder thought it would have a small downwards effect (one out of eight) or an upwards effect (small: two or large: one) on UK net migration.
In the long term the majority thought environmental change would have a small upwards effect (five out of eight) and one expert thought it would have a large upwards effect on UK net migration.
Some of the experts suggested environmental change is likely to trigger environmental disasters in the long term, which is likely to increase flows in to the UK as a result of displacement. However, the actual immigration numbers would be contingent on governmental policy concerning the accommodation of refugees. Some experts also pointed out that climate change could also contribute to migration flows because of the growing aridity of regions at risk.
Brexit
In the short term five out of eight experts thought Brexit would result in a small downward effect on UK net migration while one expert thought there would be a large downwards effect. The remaining two experts answered with small upwards and little or no effect respectively.
Similarly, in the long term, five out of eight experts thought Brexit would have a small downward effect while two experts believed it would cause a large downwards effect to UK net migration. One expert thought Brexit would have little or no effect. There was consensus among the experts that both the short- and long-term trends would be strongly influenced by government policy concerning the terms of Brexit.
Cross-border migration
The main factors that the experts suggested were likely to impact on cross-border migration were possible Scottish independence and the future nature of the border between Northern Ireland and the Republic of Ireland (which may also impact onward movements to the rest of the UK).
Other factors that could affect international migration
Other factors the experts noted could affect international migration:
- greater immigration restrictions by the US could divert migration flows to other destinations such as the UK
- global education markets – growing numbers of educated young people in developing countries could lead to an increase in international migration to the UK for education
- government policies towards international students
- an ageing population is likely to contribute to a greater demand for immigrants
10. Appendix C: Changes to State Pension age
The following tables show how the legislated increases in State Pension age will be phased in. The published national projections output tables include the projected number and percentage of those of working age and pensionable age based on the phasing detailed in this section.
Table 1.3: Date State Pension age will be achieved for women born between 6 April 1950 and 5 December 1953, UK
| Date of birth | Date state pension age reached |
|---|---|
| 6 April 1950 to 5 May 1950 | 6 May 2010 |
| 6 May 1950 to 5 June 1950 | 6 July 2010 |
| 6 June 1950 to 5 July 1950 | 6 September 2010 |
| 6 July 1950 to 5 August 1950 | 6 November 2010 |
| 6 August 1950 to 5 September 1950 | 6 January 2011 |
| 6 September 1950 to 5 October 1950 | 6 March 2011 |
| 6 October 1950 to 5 November 1950 | 6 May 2011 |
| 6 November 1950 to 5 December 1950 | 6 July 2011 |
| 6 December 1950 to 5 January 1951 | 6 September 2011 |
| 6 January 1951 to 5 February 1951 | 6 November 2011 |
| 6 February 1951 to 5 March 1951 | 6 January 2012 |
| 6 March 1951 to 5 April 1951 | 6 March 2012 |
| 6 April 1951 to 5 May 1951 | 6 May 2012 |
| 6 May 1951 to 5 June 1951 | 6 July 2012 |
| 6 June 1951 to 5 July 1951 | 6 September 2012 |
| 6 July 1951 to 5 August 1951 | 6 November 2012 |
| 6 August 1951 to 5 September 1951 | 6 January 2013 |
| 6 September 1951 to 5 October 1951 | 6 March 2013 |
| 6 October 1951 to 5 November 1951 | 6 May 2013 |
| 6 November 1951 to 5 December 1951 | 6 July 2013 |
| 6 December 1951 to 5 January 1952 | 6 September 2013 |
| 6 January 1952 to 5 February 1952 | 6 November 2013 |
| 6 February 1952 to 5 March 1952 | 6 January 2014 |
| 6 March 1952 to 5 April 1952 | 6 March 2014 |
| 6 April 1952 to 5 May 1952 | 6 May 2014 |
| 6 May 1952 to 5 June 1952 | 6 July 2014 |
| 6 June 1952 to 5 July 1952 | 6 September 2014 |
| 6 July 1952 to 5 August 1952 | 6 November 2014 |
| 6 August 1952 to 5 September 1952 | 6 January 2015 |
| 6 September 1952 to 5 October 1952 | 6 March 2015 |
| 6 October 1952 to 5 November 1952 | 6 May 2015 |
| 6 November 1952 to 5 December 1952 | 6 July 2015 |
| 6 December 1952 to 5 January 1953 | 6 September 2015 |
| 6 January 1953 to 5 February 1953 | 6 November 2015 |
| 6 February 1953 to 5 March 1953 | 6 January 2016 |
| 6 March 1953 to 5 April 1953 | 6 March 2016 |
| 6 April 1953 to 5 May 1953 | 6 July 2016 |
| 6 May 1953 to 5 June 1953 | 6 November 2016 |
| 6 June 1953 to 5 July 1953 | 6 March 2017 |
| 6 July 1953 to 5 August 1953 | 6 July 2017 |
| 6 August 1953 to 5 September 1953 | 6 November 2017 |
| 6 September 1953 to 5 October 1953 | 6 March 2018 |
| 6 October 1953 to 5 November 1953 | 6 July 2018 |
| 6 November 1953 to 5 December 1953 | 6 November 2018 |
| Source: Department for Work and Pensions | |
Download this table Table 1.3: Date State Pension age will be achieved for women born between 6 April 1950 and 5 December 1953, UK
.xls (29.7 kB)Table 1.4: Date State Pension age will be achieved for men and women born between 6 December 1953 and 5 October 1954, UK
| Date of birth | Date state pension age reached | ||
|---|---|---|---|
| 6 December 1953 to 5 January 1954 | 6 March 2019 | ||
| 6 January 1954 to 5 February 1954 | 6 May 2019 | ||
| 6 February 1954 to 5 March 1954 | 6 July 2019 | ||
| 6 March 1954 to 5 April 1954 | 6 September 2019 | ||
| 6 April 1954 to 5 May 1954 | 6 November 2019 | ||
| 6 May 1954 to 5 June 1954 | 6 January 2020 | ||
| 6 June 1954 to 5 July 1954 | 6 March 2020 | ||
| 6 July 1954 to 5 August 1954 | 6 May 2020 | ||
| 6 August 1954 to 5 September 1954 | 6 July 2020 | ||
| 6 September 1954 to 5 October 1954 | 6 September 2020 | ||
| 6 October 1954 to 5 April 1960 | 66th birthday | ||
| Source: Department for Work and Pensions |
Download this table Table 1.4: Date State Pension age will be achieved for men and women born between 6 December 1953 and 5 October 1954, UK
.xls (27.1 kB)Table 1.5: Date State Pension age will be achieved for men and women born between 6 April 1960 and 5 March 1961, UK
| Date of birth | Date state pension age reached |
|---|---|
| 6 April 1960 to 5 May 1960 | 66 years and 1 month |
| 6 May 1960 to 5 June 1960 | 66 years and 2 months |
| 6 June 1960 to 5 July 1960 | 66 years and 3 months |
| 6 July 1960 to 5 August 1960 | 66 years and 4 months (1) |
| 6 August 1960 to 5 September 1960 | 66 years and 5 months |
| 6 September 1960 to 5 October 1960 | 66 years and 6 months |
| 6 October 1960 to 5 November 1960 | 66 years and 7 months |
| 6 November 1960 to 5 December 1960 | 66 years and 8 months |
| 6 December 1960 to 5 January 1961 | 66 years and 9 months (2) |
| 6 January 1961 to 5 February 1961 | 66 years and 10 months (3) |
| 6 February 1961 to 5 March 1961 | 66 years and 11 months |
| 6 March 1961 to 5 April 1977* | 67 |
| Notes: | |
| 1. A person born on 31st July 1960 is considered to reach the age of 66 years and 4 months on 30th November 2026. | |
| 2. A person born on 31st December 1960 is consider to reach the age of 66 years and 9 months on 30th September 2027. | |
| 3. A person born on 31st January 1961 is consider to reach the age of 66 years and 10 months on 30th November 2027. | |
| * For people born after 5 April 1969 but before 6 April 1977, under the Pensions Ac t 2007, State Pension age was already 67. | |
| Source: Department for Work and Pensions | |
Download this table Table 1.5: Date State Pension age will be achieved for men and women born between 6 April 1960 and 5 March 1961, UK
.xls (28.7 kB)Table 1.6: Date State Pension age will be achieved for men and women born between 6 April 1977 and 5 April 1978, UK
| Date of birth | Date state pension age reached |
|---|---|
| 6 April 1977 to 5 May 1977 | 6 May 2044 |
| 6 May 1977 to 5 June 1977 | 6 July 2044 |
| 6 June 1977 to 5 July 1977 | 6 September 2044 |
| 6 July 1977 to 5 August 1977 | 6 November 2044 |
| 6 August 1977 to 5 September 1977 | 6 January 2045 |
| 6 September 1977 to 5 October 1977 | 6 March 2045 |
| 6 October 1977 to 5 November 1977 | 6 May 2045 |
| 6 November 1977 to 5 December 1977 | 6 July 2045 |
| 6 December 1977 to 5 January 1978 | 6 September 2045 |
| 6 January 1978 to 5 February 1978 | 6 November 2045 |
| 6 February 1978 to 5 March 1978 | 6 January 2046 |
| 6 March 1978 to 5 April 1978 | 6 March 2046 |
| 6 April 1978 onwards | 68th birthday |
| Source: Department for Work and Pensions |
Download this table Table 1.6: Date State Pension age will be achieved for men and women born between 6 April 1977 and 5 April 1978, UK
.xls (27.1 kB)Sources: Pensions Act 1995 Chapter 26 Part II Section 126 and Schedule 4; Pensions Act 2007 Chapter 22 Part I Section 13 and Schedule 3; Pensions Act 2011 Part 1 Section 1 and Schedule 1; Pensions Act 2014 Part 3 Section 26 and Section 27.
Nôl i'r tabl cynnwys