Cynnwys
- Introduction
- Past trends in life expectancy
- Future prospects for life expectancy
- Methodology and derivation of UK base mortality rates
- Base year mortality rates for individual countries
- Trends in mortality by age
- Future improvements in age-specific mortality rates
- Effect of assumptions
- Expectation of life for cohorts
- Constituent countries of the UK
- Mortality differences between males and females
- The changing life table
- Further details
- Views on future levels of mortality improvements and expectations of life
- References
- Background notes
1. Introduction
Throughout the 20th century and into this century, the UK has experienced a continuation of the pattern of falling mortality rates that began in the 19th century. During this time there has been a change from a pattern of high infant and child mortality caused by the prevalence of acute and infectious diseases, to a new pattern in which adult mortality predominates and chronic and degenerative diseases are the most common causes of death.1 The pattern has been broadly similar in England, Scotland, Wales and Northern Ireland.2,3,4
The 2014-based principal projection assumes that mortality rates will continue to improve into the future to an annual target rate of improvement from 2039 of 1.2% for most ages. This target rate was based on the examination of past rates of improvement and expert advice. The average annual rate of improvement over the last hundred years was around 1.2% for both males and females.
This chapter summarises past trends in mortality and life expectancy and discusses the assumptions about future mortality made for the 2014-based population projections.
Nôl i'r tabl cynnwys2. Past trends in life expectancy
One measure of the mortality rates in a particular year is the period expectation of life at birth, which is the average number of years a new-born baby would live for, based on the mortality rates for the given year. Figure 4.1 shows that there was a relatively rapid increase in this measure throughout the first half of the 20th century and then a slower, steady year on year increase continuing into the 21st century.
Figure 4.1: Period expectation of life at birth according to mortality rates experienced in given years, UK1, 1912 to 2014
Source: Office for National Statistics
Notes:
- Figures for 1912 to 1950 relate to England and Wales and figures for 1951 to 2014 are for the UK
Download this chart Figure 4.1: Period expectation of life at birth according to mortality rates experienced in given years, UK^1^, 1912 to 2014
Image .csv .xlsMuch of the increase in the period expectation of life at birth in the first half of the 20th century can be attributed to the reduction of infant and child mortality to very low levels by about 1950. Infant and child mortality rates have now fallen to such low levels that further reductions can have little effect on the expectation of life at birth, which has thus come closer to being a measure of the normal life span. Since about 1940, the increasing control of infectious diseases, has considerably reduced the number of early adult deaths and there has recently been a reduction in the number of those dying early from circulatory diseases (Figure 4.2). 2,3,4 The greatest decline in mortality rates at advanced ages has occurred since the 1970s. However, in general, mortality rates at the oldest ages declined less over the 20th century in relative terms than those at younger ages.
Figure 4.2: Age-standardised mortality rates by major cause, England and Wales, 1911 to 2011
Source: Office for National Statistics
Notes:
- Mortality rates are not available for the UK before 1951; for long historic trends England and Wales data are used
Download this chart Figure 4.2: Age-standardised mortality rates by major cause, England and Wales, 1911 to 2011
Image .csv .xlsFigure 4.3 shows that period life expectancy at age 65 has also risen during the 20th century and continues to rise in the 21st century. For females, the annual increase was relatively constant over this period whereas for males, after an initial period of increasing longevity, period life expectancy at 65 remained almost constant between 1940 and 1970. Since 1970, there has been a rapid decline in mortality rates at advanced ages, particularly for males for whom mortality is currently improving more rapidly than female mortality. As a result, the age differential in period life expectancy at age 65 between males and females has reduced from around 4.0 years during the 1970s and early 1980s to 2.5 years in 2014. A partial explanation for this may be the different historical patterns in cigarette smoking between men and women, with a higher proportion of males smoking in the past than females and the peak consumption for males being earlier (1940 to 1960) than for females (around 1960).5,6 This might suggest that the rate of increase in female expectation of life at 65 will continue to be slower than for males over the next few years.
Figure 4.3: Period expectation of life at age 65 according to mortality rates experienced in given years, UK1, 1912 to 2014
Source: Office for National Statistics
Notes:
- Figures for 1921 to 1950 relate to England and Wales and figures for 1951 to 2014 are for the UK
Download this chart Figure 4.3: Period expectation of life at age 65 according to mortality rates experienced in given years, UK^1^, 1912 to 2014
Image .csv .xlsA number of publications provide reviews of long-term mortality trends in the UK.1,2,3,4,7,8,9
Nôl i'r tabl cynnwys3. Future prospects for life expectancy
Since the 1980s, the period expectation of life at birth in the UK for females has increased by about 1.9 years per decade, while male life expectancy has increased by around 2.6 years per decade. The period expectation of life at birth in the UK in 2014 was about 83.0 years for females and 79.3 years for males. However, there are diverse opinions amongst demographers as to the level of longevity that might reasonably be expected in the future.9,10,11,12
Internationally, there are examples of countries with higher period expectations of life at birth. For example in Japan, the period expectation of life at birth in 2014 was about 86.8 years for females and 80.5 years for males.13 Other countries in Europe, such as Italy, Norway, Sweden and Switzerland also currently have higher period expectations of life at birth than the UK for both males and females.14
There is also the possibility of lower incidences of cancer, heart disease and strokes through changes in lifestyle and, through medical advances, greater control of these when they do occur. In particular, mortality rates for heart disease and strokes have fallen quite rapidly and steadily over the 1990s for males and females aged 40 to 64 and to a lesser extent for older men and women.15 Since 2000, the falls in mortality rates from these causes have continued at around the same pace for the 40 to 64 age-group and have accelerated for older men and women (aged 65 and over). Mortality rates from circulatory diseases had fallen to similar levels as the all cancers mortality rate by 2008. In the future changes in mortality rates from causes other than circulatory diseases will have an increasingly greater effect on the rates of future mortality improvements.
On the other hand, some demographers believe that, despite the possibility of advances in medical practices and of encouraging healthy lifestyles, a law of diminishing returns will apply to mortality rate reductions at advanced ages, partly because no more than a minority of the population will adopt truly healthy lifestyles. It is also possible that new diseases, or the re-emergence of existing diseases such as tuberculosis, may serve to temper future improvements in mortality.
Nôl i'r tabl cynnwys4. Methodology and derivation of UK base mortality rates
When formulating the mortality assumptions for population projections the focus is on mortality rates and annual percentage change in the mortality rates by age and year rather than life expectancy. The annual percentage changes are also referred to as rates of improvement in mortality (or mortality improvements) because at most ages in most years mortality rates have improved. In this chapter, the assumptions for the projections are given in the form of central mortality rates (mx). The difference between these and the probabilities of dying (qx) used to carry out the actual projections is described in Chapter 1. The latter figures can be accessed via the 2014-based national population projections open datasets.
Age-specific mortality rates were calculated for each year using deaths data and mid-year population estimates for 1961 to 2013 (deaths data for 2014 did not become available until after the mortality assumptions for these projections were finalised). Population estimates by age for those aged 90 and over from 1979 onwards (and retrospective estimates for earlier years, back to when these persons were aged 80) were calculated using the Kannisto-Thatcher survivor ratio method which is a modified form of the method of extinct generations.16 The retrospective estimates to age 80 have been found to give more reliable results than using the official population estimates made at the time.
A p-spline model was then applied to the resulting crude mortality rates to produce a fitted, smoothed surface of mortality rates to the historical data for each sex.17 A review of the methodology to be used for projecting mortality is currently being undertaken and the initial results were incorporated into the current methodology. As a result, a modification to the smoothing method used has been made to account for possible presence of overdispersion in the data. Mortality data often present overdispersion (or heterogeneity) that is, the presence of greater variability in a data set than would be expected based on a given statistical model.
Comparisons of the annual percentage change in the smoothed mortality rates using different ranges of calendar years and ages found that improvements calculated for the final and penultimate years of the data range tend to be altered more than those in the preceding years when an extra year’s data are added; those calculated for earlier years are usually not altered to a significant degree. The tests also suggested that using data for ages 0 to 100 for males and 0 to 105 for females produced reasonable results.
As a result of these analyses, smoothed mortality rates were calculated using data for years 1961 to 2013 and age ranges 0 to100 for males and 0 to 105 for females. Percentage changes in mortality were then calculated by age for the year 2011 using the smoothed mortality rates for 2010 and 2011. These rates of percentage change for 2011 were then projected forward to 2014 by assuming that the same rates of change applied in 2012, 2013 and 2014. This projection was carried out by year of age (period) for those born in 1960 and later and by year of birth (cohort) for those born before 1960. Improvement rates (percentage change) in 2014 for ages where this methodology did not give an assumed rate were obtained by interpolation between the nearest ages where there were assumed rates.
Assumed age-specific base mortality rates for 2014 were obtained by applying the resulting assumed rates of improvement for 2012, 2013 and 2014 successively to the smoothed age-specific mortality rates produced for 2011.
The rates of improvement derived for 2014 are then projected into the future, and are assumed to converge to the target rates of improvement by age and sex in 2039. The resulting projected rates of improvement are then applied successively to the assumed rates of mortality by age and sex for the base year 2014 to provide projected age- and sex-specific mortality rates in each future year of the projection period. Further adjustments are made to ensure that the projected curves of mortality rates appear reasonable and that male mortality rates do not generally fall below those for females for the same age and year.
Nôl i'r tabl cynnwys5. Base year mortality rates for individual countries
Mortality rates for the base year 2014 were initially calculated for the UK, as described above. Mortality rates for 2014 for the 4 individual countries of the UK were then obtained by adjusting the UK mortality rates at each age in proportion to the particular country’s mortality experience relative to the UK mortality experience at that age for the 3 years 2011 to 2013. The resulting base year mortality rates for individual countries are shown for selected ages in Table 4.1. The country-specific mortality improvement rates described later in this chapter were then applied to the projected base mortality rates for 2014 for each country to obtain the projected mortality rates for future years.
Table 4.1: Assumed base year mortality rates (mx) per 100,000 population, by selected ages, UK, 2014
| Males | Females | ||||||||
| Age | England | Wales | Scotland | Northern Ireland | England | Wales | Scotland | Northern Ireland | |
| 0 | 440 | 410 | 397 | 436 | 353 | 345 | 334 | 352 | |
| 2 | 17 | 16 | 16 | 17 | 16 | 15 | 15 | 14 | |
| 12 | 9 | 10 | 10 | 15 | 8 | 9 | 8 | 5 | |
| 22 | 51 | 64 | 77 | 87 | 22 | 26 | 28 | 27 | |
| 32 | 77 | 109 | 152 | 111 | 41 | 61 | 59 | 41 | |
| 42 | 166 | 222 | 251 | 189 | 99 | 113 | 134 | 112 | |
| 52 | 355 | 389 | 459 | 400 | 241 | 276 | 320 | 276 | |
| 62 | 891 | 953 | 1,119 | 971 | 589 | 648 | 736 | 624 | |
| 72 | 2,303 | 2,518 | 2,928 | 2,518 | 1,512 | 1,664 | 1,989 | 1,617 | |
| 82 | 6,900 | 7,391 | 7,977 | 7,391 | 5,027 | 5,355 | 6,044 | 5,487 | |
| 92 | 21,774 | 22,910 | 22,910 | 22,664 | 17,862 | 18,453 | 19,445 | 19,047 | |
| 102 | 55,646 | 55,646 | 55,646 | 55,646 | 46,108 | 46,336 | 48,640 | 47,483 | |
| Source: Office for National Statistics | |||||||||
Download this table Table 4.1: Assumed base year mortality rates (m~x~) per 100,000 population, by selected ages, UK, 2014
.xls (28.2 kB)6. Trends in mortality by age
The smoothed mortality rates for the UK fluctuate between increases and reductions at older ages for men up to the mid-1970s, as well as temporary increases for middle-aged men in the 1960s and amongst young men in the 1960s and the early 1970s. Mortality rates for men aged 21 to 40 generally rose during the mid-1980s to the mid-1990s. These increases were partly attributable to deaths caused by HIV infection and AIDS.18 Suicide rates and alcohol-related mortality also increased for men at young ages until the late 1990s.19 Since the late 1990s, mortality rates for men in this age-group have generally been declining. Apart from increasing mortality rates for women aged between 45 and 60 during the 1960s and early 1970s, mortality rates are generally falling for women of all ages. Mortality rates for women aged 15 to 30 generally showed little improvement, or even worsened, during the 1990s but since then this trend has reversed.
It was assumed that the trends apparent during the period 1961 to 2013 (mostly of improvement in mortality) would initially continue at similar rates, with improvements for 2013 to 2014 being those derived as described earlier.
Comparisons of the rates of improvement experienced in each individual country with those experienced in the UK as a whole suggested that the assumed initial rates of improvement by age and sex for the UK could be adopted for each individual country, except for Scotland. Mortality for Scottish males and females at some ages has been improving more slowly or worsening at a faster rate than elsewhere in the UK in recent years. As a result, different initial rates of mortality improvement were assumed for Scottish males and females at several ages. Lower rates of improvement have been assumed for Scottish males in their 20s, 30s, 40s and mid-60s to early 90s, with higher rates assumed for those aged 48 to 67. For Scottish females, lower rates have been assumed for those aged 25 to 50 and 67 to 89, with higher rates assumed for those aged 56 to 65, than for the rest of the UK. The improvement rates for the other countries were then adjusted so that the weighted country-specific improvements by age were the same as those initially derived for the UK as a whole. The resulting assumed smoothed changes in mortality rates between 2013 and 2014 for each country are shown in Figure 4.4.
Figure 4.4: Assumed smoothed percentage changes in mortality rates between 2013 and 2014 by age, Scotland compared with combined figures for England, Wales, and Northern Ireland
Source: Office for National Statistics, NRS, NISRA
Download this chart Figure 4.4: Assumed smoothed percentage changes in mortality rates between 2013 and 2014 by age, Scotland compared with combined figures for England, Wales, and Northern Ireland
Image .csv .xlsThe peak levels of improvement in mortality rates (of around 4% a year) for both males and females noted in previous projections for the cohorts born around 1931 (aged around 83 in 2014) have continued, although the peak is now for a slightly younger cohort. It is not understood precisely why the members of the generation born around the early 1930s have been enjoying higher rates of mortality improvement throughout their adult life than preceding generations, or why the rate of improvement slowed down for following generations. It may, however, be relevant that this generation was the first to benefit from a combination of better childhood health, the conquest of infectious diseases affecting young and middle-aged adults and, in later middle-age, improvements in the treatment of circulatory diseases. Additionally, the men, in particular, stopped smoking cigarettes sooner than those in preceding generations.
Nôl i'r tabl cynnwys7. Future improvements in age-specific mortality rates
Consideration was then given to how the trends might change in the future. The methodology used for mortality projections in the UK assumes “target” rates of mortality improvement for a specific future year 25 years ahead of the base year for the projections.
Over the 40-year period 1971 to 2011, the average annualised rate of improvement in aggregate standardised mortality rates in England and Wales has been around 1.9% for males and 1.5% for females. (These rates of improvement are derived from aggregate mortality rates for ages 0 to 99 calculated using the 2011 population estimates for the UK as the standard population.) The rate of improvement over the latter half of this period was higher for both males and females than over the first half, and particularly so for males. This appears to be partly due to differential trends in smoking behaviour between males and females. Relatively higher numbers of men have now given up smoking and mortality rates for males at older ages have shown large rates of improvement in recent years.5,6
The average annual rate of improvement over the last hundred years was around 1.2% for both males and females although the improvement rates vary by age. There is ongoing debate as to whether the impact of future technical, medical and environmental changes will have a greater or lesser effect on improvements in mortality in the future than they had over the 20th century. Taking these various factors into consideration together with the views of the expert panel, the rate of improvement for 2039 (the 25th year of the 2014-based projections) has been assumed to be 1.2% for most ages (that is, equivalent to the average annual rate of improvement over the period 1913 to 2013).
However, those born after 1924 and before 1939 have exhibited greater rates of improvement over the last 25 years than those born on either side.20 This is evident in the heat maps (Figures 4.5a and 4.5b) where the highest improvements are shown by the areas denoted by 2.5% and 3% per year improvement (shaded orange and red in Figures 4.5a and 4.5b). There is currently no evidence that these differentials are declining. As a result, it is now assumed that these cohorts will continue to experience higher rates of improvement with the assumed rate of improvement in 2039 rising from 1.2% a year for those born before 1924 to a peak of 2.5% a year for those born in 1931 and 1932 and then declining back to 1.2% a year for those born in 1939 and later.
However, there is little evidence of past mortality improvements at the very oldest ages in the UK. As a result, and in order to avoid implausible numbers surviving to extreme ages, the notional assumed rates of improvement in the 25th year of the projections are assumed to reduce to 1.0% for those born in 1922 and to reduce further from 1.0% for those born in 1911 to 0.1% for those born in 1902 and earlier. These are the same assumptions for the rates of future mortality improvement, by year of birth, in the target year as those assumed for the 2012-based projections (where the target year was 2037).
Figure 4.5a: Historic and projected percentage change in smoothed mortality rates, males, UK, 1962 to 2039

Source: Office for National Statistics
Download this image Figure 4.5a: Historic and projected percentage change in smoothed mortality rates, males, UK, 1962 to 2039
.png (125.4 kB)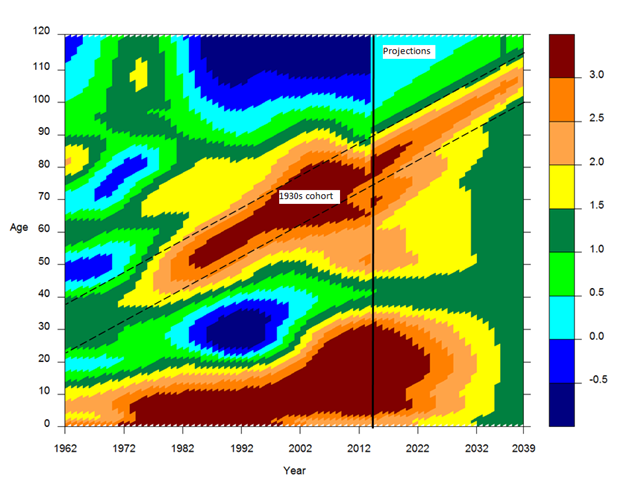
Figure 4.5b: Historic and projected percentage change in smoothed mortality rates, females, UK, 1962 to 2039

Source: Office for National Statistics
Download this image Figure 4.5b: Historic and projected percentage change in smoothed mortality rates, females, UK, 1962 to 2039
.png (113.3 kB)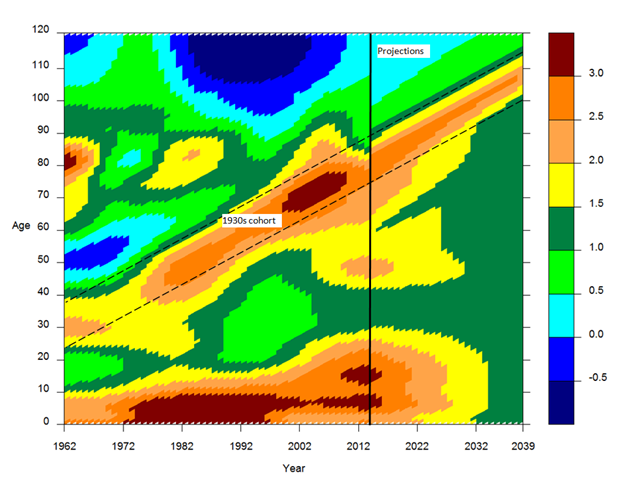
Table 4.2 shows the reductions in mortality rates assumed for selected years in the future and the total reduction over the next 25 years from 2014 to 2039 for each country of the UK. Current rates of mortality improvement by age are assumed to converge to the target rates of 1.2% to 2.5% in 2039 more rapidly for males than females. For ages where the improvement rate in 2014 is higher than the target rate, the cumulative reduction in mortality rates throughout the 25 year projection period is lower than would be given if a linear interpolation was assumed, that is the speed of convergence to the target rates is faster. Where the improvement rate is lower in 2014 than the target rate the cumulative reduction is higher, that is the speed of convergence is slower.
There is also some evidence of cohort effects for those born after 1939. Therefore, in these projections, convergence to the assumed rate of improvement in 2039 has been done by cohort for those born before 1960 (shown with † symbol in Table 4.2). For those born in 1960 and later (that is, projections with no † symbol in Table 4.2), for whom there is little evidence of generational effects, the changes in the rates of improvement to the target rate are projected by calendar year. Of course, at young ages mortality rates are already at low levels and the precise assumptions made for future mortality have a relatively minor impact on the projections.
The rates of improvement after 2039 are assumed to remain constant (by cohort or by age, as described above) at the rate assumed in 2039 for each year thereafter. So, for those born during the period 1925 to 1938, who are assumed to have higher rates of improvement than 1.2% in 2039, it is assumed that they will continue to experience these higher rates of improvement after 2039 for the remaining years of their lives.
Table 4.2: Assumed percentage change in UK mortality rates, mx, between consecutive calendar years in the projection period and the total reduction over 25 years, 2014 to 2039
| percentages | |||||||||||
| 2014 to 2015 | 2018 to 2019 | 2028 to 2029 | 2038 to 2039 | Reduction over 25 years | |||||||
| Age | Males | Females | Males | Females | Males | Females | Males | Females | Males | Females | |
| England, Wales and Northern Ireland | |||||||||||
| 0 | 2.38 | 2.42 | 2.15 | 2.18 | 1.61 | 1.63 | 1.20 | 1.20 | 35.54 | 35.81 | |
| 2 | 2.52 | 2.39 | 2.26 | 2.16 | 1.66 | 1.62 | 1.20 | 1.20 | 36.52 | 35.61 | |
| 12 | 3.68 | 2.91 | 3.19 | 2.58 | 2.07 | 1.80 | 1.20 | 1.20 | 44.59 | 39.39 | |
| 22 | 4.10 | 2.40 | 3.53 | 2.17 | 2.22 | 1.62 | 1.20 | 1.20 | 47.29 | 35.69 | |
| 32 | 2.67 | 1.39 | 2.38 | 1.35 | 1.71 | 1.27 | 1.20 | 1.20 | 37.66 | 27.66 | |
| 42 | 1.06 | 1.59 | 1.09 | 1.51 | 1.15 | 1.34 | 1.20 | 1.20 | 24.85 | 29.29 | |
| 52 | 2.33 | 1.90 | 2.11 | 1.77 | 1.60 | 1.45 | 1.20 | 1.20 | 35.15 | 31.85 | |
| 62 | 2.02† | 1.57† | 1.96† | 1.52† | 1.56 | 1.40 | 1.20 | 1.20 | 33.74 | 30.06 | |
| 72 | 2.85† | 2.30† | 2.57† | 1.98† | 1.53† | 1.34† | 1.20 | 1.20 | 36.63 | 32.25 | |
| 82 | 3.21† | 2.79† | 2.77† | 2.54† | 1.80† | 1.54† | 1.20† | 1.20† | 39.73 | 36.58 | |
| 92 | 1.30† | 1.05† | 2.10† | 1.73† | 2.11† | 2.01† | 1.20† | 1.20† | 38.79 | 35.80 | |
| Scotland | |||||||||||
| 0 | 2.38 | 2.42 | 2.15 | 2.18 | 1.61 | 1.63 | 1.20 | 1.20 | 35.54 | 35.81 | |
| 2 | 2.52 | 2.39 | 2.26 | 2.16 | 1.66 | 1.62 | 1.20 | 1.20 | 36.52 | 35.61 | |
| 12 | 3.68 | 2.91 | 3.19 | 2.58 | 2.07 | 1.80 | 1.20 | 1.20 | 44.59 | 39.39 | |
| 22 | 4.10 | 2.40 | 3.53 | 2.17 | 2.22 | 1.62 | 1.20 | 1.20 | 47.29 | 35.69 | |
| 32 | 0.62 | -0.42 | 0.73 | -0.10 | 1.00 | 0.63 | 1.20 | 1.20 | 20.91 | 10.94 | |
| 42 | 0.63 | 1.02 | 0.74 | 1.05 | 1.00 | 1.14 | 1.20 | 1.20 | 21.02 | 24.48 | |
| 52 | 2.77 | 1.90 | 2.46 | 1.77 | 1.75 | 1.45 | 1.20 | 1.20 | 38.38 | 31.85 | |
| 62 | 3.17† | 2.14† | 2.64† | 1.87† | 1.79 | 1.40 | 1.20 | 1.20 | 39.83 | 31.95 | |
| 72 | 2.63† | 1.75† | 2.62† | 1.91† | 1.83† | 1.49† | 1.20 | 1.20 | 39.75 | 32.36 | |
| 82 | 2.69† | 2.02† | 2.39† | 1.93† | 1.82† | 1.51† | 1.20† | 1.20† | 38.25 | 32.56 | |
| 92 | 1.30† | 1.05† | 1.88† | 1.19† | 1.94† | 1.74† | 1.20† | 1.20† | 36.64 | 32.02 | |
| Source: Office for National Statistics | |||||||||||
| Notes: | |||||||||||
| 1. Projections made by cohort marked with† symbol (see text for further details), otherwise projections are made by calendar year | |||||||||||
| 2. The first column shows the reductions not from the actual death rates from 2014, but the base death rates for 2014, projected from trends in preceding years | |||||||||||
Download this table Table 4.2: Assumed percentage change in UK mortality rates, m~x~, between consecutive calendar years in the projection period and the total reduction over 25 years, 2014 to 2039
.xls (31.2 kB)The same future improvements are assumed for all countries of the UK except for some differences (generally, slightly smaller improvements) in the period to 2039 at some ages for males and for females in Scotland, as discussed earlier. Similar adjustments were made in recent past projections.
This produces an average annualised rate of mortality improvement of around 1.4% for males and 1.3% for females over the next 80 years for England and Wales and Scotland (Table 4.3). The new projections generally assume for males in England and Wales lower annualised rates of improvement in the future than corresponding periods 30 and 50 years in the past. In Scotland rates of improvement in the future are lower than the corresponding period 30 years in the past but higher than rates observed in the last 50 and 80 years. For females there are higher annualised rates of improvement over future periods than experienced over corresponding periods in the past in England and Wales and Scotland.
Table 4.3: Past and assumed overall average annual rates of mortality improvement, England and Wales and Scotland
| percentages | ||||
| Males | Females | |||
| Past (actual) | Future (assumed) | Past (actual) | Future (assumed) | |
| England & Wales | ||||
| Last/next 30 years | 2.19 | 1.75 | 1.57 | 1.59 |
| Last/next 50 years | 1.64 | 1.53 | 1.40 | 1.44 |
| Last/next 80 years | 1.30 | 1.40 | 1.31 | 1.35 |
| Scotland | ||||
| Last/next 30 years | 1.98 | 1.76 | 1.35 | 1.47 |
| Last/next 50 years | 1.46 | 1.54 | 1.31 | 1.36 |
| Last/next 80 years | 1.15 | 1.41 | 1.21 | 1.30 |
| Source: Office for National Statistics | ||||
| Notes: | ||||
| 1. Past estimates are based on comparison of the 2010 to 2012 national life tables with English and Scottish Life Tables for 1930 to 1932, 1960 to 1962 and 1980 to 1982, hence using the periods 30, 50 and 80 years. In all cases the rates of improvement shown are derived from aggregate mortality rates for ages 0 to 99 calculated using the 2011 population estimates for the UK as the standard population. Decennial tables are not available for the historical periods shown in the table for the UK or Northern Ireland | ||||
| 2. Making projections of mortality rates is speculative and users must bear in mind that the range of possibilities is wide. Variant projections using alternative assumptions for the future improvement in mortality are considered in Chapter 6 | ||||
Download this table Table 4.3: Past and assumed overall average annual rates of mortality improvement, England and Wales and Scotland
.xls (27.1 kB)8. Effect of assumptions
The implications of these assumptions in terms of the period expectation of life at birth and at age 65 are shown in Figure 4.6 and Figure 4.7 respectively.
Figure 4.6: Actual and projected period expectation of life at birth according to mortality rates for given year, UK, 1981 to 2089
Source: Office for National Statistics
Download this chart Figure 4.6: Actual and projected period expectation of life at birth according to mortality rates for given year, UK, 1981 to 2089
Image .csv .xls
Figure 4.7: Actual and projected period expectation of life at age 65 according to mortality rates for given year, UK, 1981 to 2089
Source: Office for National Statistics
Download this chart Figure 4.7: Actual and projected period expectation of life at age 65 according to mortality rates for given year, UK, 1981 to 2089
Image .csv .xlsIn 2039, period expectation of life at birth for the UK is around 0.2 years lower for males and 0.7 years lower for females compared with the previous projections. These differences are mainly due to the fact that we have assumed higher mortality rates at nearly all ages and lower rates of mortality improvement at most ages over 65 in 2014 compared with those projected for 2014 in the 2012-based projections.
Nôl i'r tabl cynnwys9. Expectation of life for cohorts
So far in this report, expectations of life have mainly been calculated on the basis of the mortality rates for a particular calendar year (period life expectancies). In many contexts it is more meaningful to calculate the average life expectancy which allow for future known or assumed changes in mortality rates (referred to as cohort life expectancy). Further information on the difference between period and cohort life expectancies is available on our website.21 Table 4.4 shows projected period and cohort expectations of life at selected ages for 4 different years.
Table 4.4 shows that the projected period expectation of life at birth for a male in the UK was 79.3 years on the basis of the mortality rates for 2014. However, taking into account assumed mortality improvements in later years, that is, cohort life expectancy, a male born in that year would be expected to live for 90.4 years. Similarly, the average man aged 65 in 2014 would live for a further 18.6 years based on the mortality rates for 2014 (period). However, taking account of the assumed further mortality improvement after 2014 (cohort), he would actually be expected to live for a further 21.2 years.
Table 4.4: Period and cohort expectation of life by selected ages, UK, for the years 2014, 2015, 2025, 2035 and 2039
| years | ||||||||||
| Males | Females | |||||||||
| Age | 2014 | 2015 | 2025 | 2035 | 2039 | 2014 | 2015 | 2025 | 2035 | 2039 |
| Period expectation of life | ||||||||||
| 0 | 79.3 | 79.3 | 81.9 | 83.6 | 84.1 | 83.0 | 82.9 | 85.1 | 86.5 | 86.9 |
| 15 | 64.7 | 64.8 | 67.3 | 68.9 | 69.4 | 68.4 | 68.3 | 70.4 | 71.8 | 72.2 |
| 60 | 22.6 | 22.7 | 24.8 | 26.2 | 26.6 | 25.4 | 25.3 | 27.1 | 28.3 | 28.7 |
| 65 | 18.6 | 18.7 | 20.7 | 21.9 | 22.3 | 21.1 | 21 | 22.7 | 23.9 | 24.2 |
| 75 | 11.4 | 11.4 | 13.1 | 14.2 | 14.5 | 13.2 | 13.1 | 14.6 | 15.6 | 15.9 |
| 85 | 6.0 | 5.9 | 7.0 | 7.9 | 8.1 | 7.0 | 6.8 | 7.9 | 8.7 | 8.9 |
| Cohort expectation of life | ||||||||||
| 0 | 90.4 | 90.5 | 91.9 | 93.4 | 93.9 | 93.2 | 93.3 | 94.7 | 96 | 96.5 |
| 15 | 73.7 | 73.9 | 75.3 | 76.7 | 77.2 | 76.7 | 76.8 | 78.1 | 79.4 | 79.9 |
| 60 | 25.8 | 25.9 | 27.2 | 28.3 | 28.8 | 28.2 | 28.3 | 29.5 | 30.6 | 31 |
| 65 | 21.2 | 21.3 | 22.5 | 23.6 | 24.0 | 23.5 | 23.6 | 24.6 | 25.7 | 26.1 |
| 75 | 12.8 | 12.9 | 14.2 | 15.1 | 15.4 | 14.5 | 14.7 | 15.7 | 16.6 | 16.9 |
| 85 | 6.2 | 6.4 | 7.5 | 8.2 | 8.5 | 7.2 | 7.3 | 8.4 | 9.1 | 9.4 |
| Source: Office for National Statistics | ||||||||||
Download this table Table 4.4: Period and cohort expectation of life by selected ages, UK, for the years 2014, 2015, 2025, 2035 and 2039
.xls (27.6 kB)Figure 4.8 shows the cohort expectation of life at birth for England and Wales for generations born from 1850 to 2050 and Figure 4.9 shows the cohort expectation of life at age 65 for those reaching age 65 in 1850 to 2050 based on the actual mortality rates experienced in the past or assumed for the future.
About half of the increase in cohort life expectancies at birth between generations born in 1850 and 1945 was due to the reduction in infant and child mortality to very low levels. Subsequent generations have benefited particularly from the almost complete elimination of deaths from acute and infectious diseases. Figure 4.8 illustrates the point that, while current reductions in mortality rates at the older ages will continue to extend the average lifetime, once this reaches around 78 years for males and 83 years for females (that is, for men and women born in 1950), further progress is likely to be much slower. The great majority of deaths will then be attributable to chronic and degenerative diseases.
Figure 4.8: Cohort expectation of life at birth according to historic and projected mortality rates, for persons born from 1850 to 2050, England and Wales
Source: Office for National Statistics
Notes:
- Life expectancy figures are not available for the UK before 1951; for long historic trends England and Wales data are used
Download this chart Figure 4.8: Cohort expectation of life at birth according to historic and projected mortality rates, for persons born from 1850 to 2050, England and Wales
Image .csv .xls
Figure 4.9: Cohort expectation of life at age 65 according to historic and projected mortality rates, for persons who reach age 65 in the years 1850 to 2050, England and Wales
Source: Office for National Statistics
Notes:
- Life expectancy figures are not available for the UK before 1951; for long historic trends England and Wales data are used
- The ‘blip’ in the trend line in 1984 relates to the birth cohorts of 1918 to 1920, where the births were not evenly distributed throughout the year
Download this chart Figure 4.9: Cohort expectation of life at age 65 according to historic and projected mortality rates, for persons who reach age 65 in the years 1850 to 2050, England and Wales
Image .csv .xlsWhile the cohort expectation of life at age 65 for females has been increasing at a fairly steady rate since the 1930s, the cohort expectation of life at age 65 for males showed relatively little increase between 1930 and 1970 after which it began to increase more rapidly than for females. As discussed earlier, a partial explanation for this may be the different historical patterns in cigarette smoking between men and women. This is likely to have delayed mortality rates for older males falling to the levels they would have reached had they followed the improvements in female mortality rates experienced during the 1950s and 1960s.
Nôl i'r tabl cynnwys10. Constituent countries of the UK
The projected mortality rates and expectations of life vary between countries because of the differing starting mortality rates and, for Scotland, the different rates of mortality improvement at some ages, as discussed earlier. The resulting life expectancies are shown in Table 4.5; of the 4 countries, England shows the highest life expectancy and Scotland the lowest.
Table 4.5 also shows the comparable life expectancies from the 2012-based projections. The 2014-based period expectations of life at birth are lower for both males and females compared with the 2012-based projections over the period 2014 to 2039 for all the constituent countries. The only exception being males in Scotland where period expectation of life at birth is broadly consistent. In 2039, period expectations of life at birth for males are projected to be between 0.4 years lower (Wales) and 0 (Scotland) than the 2012-based projections. The differences in 2039 are larger for females with period life expectancies at birth between 0.5 years lower (Northern Ireland) and 0.8 years lower (Scotland). This results in 2014-based projected life expectancies at birth in 2039 in the UK being 0.2 years lower for males and 0.7 years lower for females than the 2012-based projections.
Cohort life expectancies at birth for both males and females are also projected to be lower than in the previous projections for each country of the UK for all years. The only exception being males in Wales where cohort expectation of life at birth is slightly higher in 2039 than the 2012-based projections.
Table 4.5: Period and cohort expectation of life at birth for the years 2014, 2015, 2025, 2035 and 2039, UK
| years | ||||||||||
| 2014 | 2015 | 2025 | 2035 | 2039 | ||||||
| Period expectation of life at birth | ||||||||||
| Males | ||||||||||
| England | 79.5 | 79.9 † | 79.7 | 80.2 † | 82.2 | 82.5 † | 83.9 | 84.1 † | 84.4 | 84.6 † |
| Wales | 78.8 | 79.1 † | 78.6 | 79.4 † | 81.3 | 81.8 † | 83.0 | 83.4 † | 83.5 | 83.9 † |
| Scotland | 77.3 | 77.3 † | 77.2 | 77.6 † | 80.0 | 80.0 † | 81.8 | 81.7 † | 82.3 | 82.3 † |
| Northern Ireland | 78.6 | 78.7 † | 78.5 | 79.0 † | 81.2 | 81.4 † | 82.9 | 83.1 † | 83.4 | 83.6 † |
| UK | 79.3 | 79.6 † | 79.3 | 79.8 † | 81.9 | 82.2 † | 83.6 | 83.8 † | 84.1 | 84.3 † |
| Females | ||||||||||
| England | 83.2 | 83.6 † | 83.2 | 83.8 † | 85.3 | 85.9 † | 86.8 | 87.3 † | 87.2 | 87.8 † |
| Wales | 82.6 | 82.9 † | 82.3 | 83.2 † | 84.6 | 85.2 † | 86.0 | 86.7 † | 86.5 | 87.2 † |
| Scotland | 81.3 | 81.5 † | 81.1 | 81.7 † | 83.1 | 83.7 † | 84.5 | 85.3 † | 85.0 | 85.8 † |
| Northern Ireland | 82.4 | 82.8 † | 82.5 | 83.1 † | 84.7 | 85.1 † | 86.1 | 86.6 † | 86.6 | 87.1 † |
| UK | 83.0 | 83.3 † | 82.9 | 83.6 † | 85.1 | 85.6 † | 86.5 | 87.1 † | 86.9 | 87.6 † |
| Cohort expectation of life at birth | ||||||||||
| Males | ||||||||||
| England | 90.6 | 91.1 † | 90.7 | 91.3 † | 92.2 | 92.8 † | 93.6 | 94.2 † | 94.1 | 94.8 † |
| Wales | 89.7 | 90.4 † | 89.9 | 90.5 † | 91.4 | 91.8 † | 92.8 | 92.9 † | 93.4 | 93.2 † |
| Scotland | 88.6 | 88.9 † | 88.8 | 89.1 † | 90.3 | 90.7 † | 91.8 | 92.3 † | 92.4 | 92.9 † |
| Northern Ireland | 89.5 | 90.1 † | 89.8 | 90.3 † | 91.3 | 91.9 † | 92.7 | 93.4 † | 93.3 | 94.0 † |
| UK | 90.4 | 90.9 † | 90.5 | 91.0 † | 91.9 | 92.5 † | 93.4 | 94.0 † | 93.9 | 94.6 † |
| Females | ||||||||||
| England | 93.4 | 94.4 † | 93.5 | 94.5 † | 94.9 | 95.9 † | 96.2 | 97.3 † | 96.7 | 97.8 † |
| Wales | 92.9 | 93.8 † | 92.9 | 94.0 † | 94.3 | 95.4 † | 95.6 | 96.8 † | 96.2 | 97.3 † |
| Scotland | 91.3 | 92.5 † | 91.4 | 92.6 † | 92.9 | 94.1 † | 94.3 | 95.5 † | 94.8 | 96.1 † |
| Northern Ireland | 92.8 | 93.6 † | 92.9 | 93.8 † | 94.3 | 95.2 † | 95.6 | 96.6 † | 96.1 | 97.1 † |
| UK | 93.2 | 94.2 † | 93.3 | 94.3 † | 94.7 | 95.7 † | 96.0 | 97.1 † | 96.5 | 97.6 † |
| Source: Office for National Statistics | ||||||||||
| Notes: | ||||||||||
| 1. Corresponding results from the 2012-based projections are marked with a † symbol | ||||||||||
Download this table Table 4.5: Period and cohort expectation of life at birth for the years 2014, 2015, 2025, 2035 and 2039, UK
.xls (31.7 kB)11. Mortality differences between males and females
In common with other northern European countries, the difference in period life expectancy at birth for females over males rose in the UK during the period 1900 to 1970, before declining in more recent years.1 In the UK, the differential has fallen from 6.0 years in 1980 to 3.7 years in 2014; it is projected to fall to about 2.8 years by 2039. The difference in period life expectancy at age 65 for females over males fell from 3.9 years in the late 1980s to 2.5 years in 2014 and is projected to continue to decline to 1.9 by 2039.
Nôl i'r tabl cynnwys12. The changing life table
Figures 4.10 and 4.11 illustrate how the survival curve, which shows the proportion of those born in a given year who survive to each age, is getting progressively more rectangular in shape as more deaths occur at advanced ages. The charts are based on the average of male and female mortality in England and Wales.
In Figure 4.10, the survival curves are calculated on a period basis and show the percentages who would survive to successive ages if they experienced the mortality rates of the year shown with no allowance for known or projected changes in mortality rates for the years thereafter. The first, least rectangular, curve represents the life table according to the mortality rates of the year 1851 and successive curves are given at 20 year intervals, with the uppermost being the projected life table for the year 2031. From this chart it can be seen that the median age at death, that is, the age to which half of those born survive, was about 46 on the basis of the mortality rates of 1851; this is projected to increase to about age 88 by the year 2031.
It is clear from Figure 4.10 that recent improvements in period expectation of life at birth have been due primarily to increases in survival to older ages. However, the increase in the maximum age to which people can survive has been comparatively small. There is limited scope for further reduction in mortality rates in young and middle age. Any continuation of recent increases in expectation of life will only be achieved through major falls in mortality at older ages.
Figure 4.11 shows the survival curves calculated on a cohort basis, that is, allowing for known and projected future changes in mortality after the cohort’s year of birth. Since mortality rates have, in general, been improving over past years and are projected to continue to improve, the survival curve for a given year in Figure 4.11 lies further to the right than that for the corresponding year in Figure 4.10. From this chart it can be seen that, on a cohort basis, the median age at death for those born in 1851 was actually about 48, this is projected to increase to about age 98 for those born in 2031.
Figure 4.10: Proportion of persons surviving (on a period basis) to successive ages, according to mortality rates experienced or projected, persons born 1851 to 2031, England and Wales
Source: Office for National Statistics
Notes:
- Life expectancy figures are not available for the UK before 1951; for long historic trends England and Wales data are used
Download this chart Figure 4.10: Proportion of persons surviving (on a period basis) to successive ages, according to mortality rates experienced or projected, persons born 1851 to 2031, England and Wales
Image .csv .xls
Figure 4.11: Proportion of persons surviving (on a cohort basis) to successive ages, according to mortality rates experienced or projected, persons born 1851 to 2031, England and Wales
Source: Office for National Statistics
Notes:
- Life expectancy figures are not available for the UK before 1951; for long historic trends England and Wales data are used
Download this chart Figure 4.11: Proportion of persons surviving (on a cohort basis) to successive ages, according to mortality rates experienced or projected, persons born 1851 to 2031, England and Wales
Image .csv .xls13. Further details
Projected numbers of deaths and comparisons with the previous (2012-based) projections are discussed in Chapter 2 while Chapter 6 presents the results of variant projections based on alternative assumptions about future mortality. The detailed age specific rates assumed in the principal and variant projections for each country are available on our website.
Nôl i'r tabl cynnwys14. Views on future levels of mortality improvements and expectations of life
Mortality projections prepared in other countries and by other agencies tend to be based largely on extrapolation of past trends either in mortality rates, rates of mortality improvement or in expectations of life. Expert opinion is often used to inform the assumptions made. It is therefore perhaps helpful to summarise some of the current arguments put forward by experts regarding future levels of mortality improvements and life expectancy, for the UK and for other developed countries.
For the UK, several factors have been identified amongst the likely causes of future mortality change including the “cohort effect”, the “ageing of mortality improvement” (where the ages at which the highest rates of improvement have occurred have been increasing over time), increased uncertainty at younger ages, changes in prevalence of cigarette smoking, the effects of other lifestyle changes, medical advances, possible increased resistance to antibiotics and the potential re-emergence of old diseases and climate change.
Appendix A in background and methodology for the 2014-based national population projections reports a meeting of the National Population Projections Expert Advisory Group at which members were asked their views on the validity of a large range of arguments which might be thought likely to influence future mortality trends.
The majority of the expert panel was optimistic about future mortality improvements. However, they had differing views about period expectation of life at birth continuing to rise at the same rate as that seen over the last decade or so. The general opinion was that the target rate of improvement should vary by age and be the same for males and females. Most were of the opinion that the rate of improvement for males and females should be set at 1.2% or higher.
The main forces thought most likely to affect future mortality levels were changes in bio-medical technology, effectiveness of health care and behavioural changes related to health. The majority opinion of the expert panel was that these 3 forces should have a small upward influence on life expectancy, with 3 experts reporting a large upward influence for bio-medical technology.
The experts generally felt that possible new infectious diseases and the resurgence of old diseases would have little or no influence on life expectancy although comment was made surrounding anti-biotic resistant bacteria. They were also of the opinion that changes in population composition and differential trends in population sub-groups would have little impact. The majority of the panel thought that the level of obesity in the UK would increase over the next 25 years, but that this would have relatively little effect on future life expectancy.
Oeppen and Vaupel12 have noted that record life expectancy (the highest life expectancy observed in any country of the world at any particular time) has increased at a steady pace over the last 160 years or so and suggest that this is likely to continue into the future. However, Olshansky11 and others have argued that there will be countervailing trends to the high rates of mortality improvements seen in recent years, driven by increasing levels of obesity, sedentary behaviours and other adverse lifestyle factors.
Given this disparity of views as to the likely future course of longevity, users of the projections can gain some insight into the sensitivity of their results to the various views on future mortality by considering the high and low life expectancy variants (see Chapter 6). However, these are intended to represent plausible alternative assumptions and are far from reflecting the extremes of thinking on future mortality.
Nôl i'r tabl cynnwys