Cynnwys
- Introduction
- Main points
- How many people, born in the UK, are now living in Ireland?
- Where are people, born in the UK, living in Ireland?
- What are people who were born in the UK and are living in Ireland doing?
- 1 to 12 month Short-Term International Migration to Ireland, from England and Wales, year ending June 2015
- UK residents travelling to Ireland for less than 28 days
- How many people, who were born in Ireland, are living in the UK?
- What are people who were born in Ireland and living in the UK doing?
- 1 to 12 month Short-Term International Migration from Ireland to England and Wales, year ending June 2015
- Residents of Ireland travelling to the UK for less than 28 days
- Migration and regular movement across the land border between Ireland and Northern Ireland
- Next steps
- Appendix 1: More information on how the data were compiled
1. Introduction
This is the fourth report in a series being published in response to an increased user need for data about the people who may be most likely to be affected by the UK’s decision to leave the EU. Previous reports consider migration between the UK and Spain, the UK and the EU8 countries and the UK and France.
The connection between the UK and Ireland 1 is unique in this series, as it goes beyond both countries being members of the European Union. The UK and Ireland have benefitted from a Common Travel Area since 1922 and those born in Northern Ireland have rights to take up both Irish and British citizenship. Ireland is also unique amongst EU countries in that it shares a land border with the UK. These and other reasons make the future relationship between Northern Ireland, Ireland, Great Britain and the European Union one of the top priorities for Brexit negotiations. A recent government position paper outlines in detail the unique circumstances of the UK and Ireland.
Figure 1: Common Travel Area groupings used in the Living Abroad Series, British Isles, 2017

Download this image Figure 1: Common Travel Area groupings used in the Living Abroad Series, British Isles, 2017
.PNG (125.3 kB)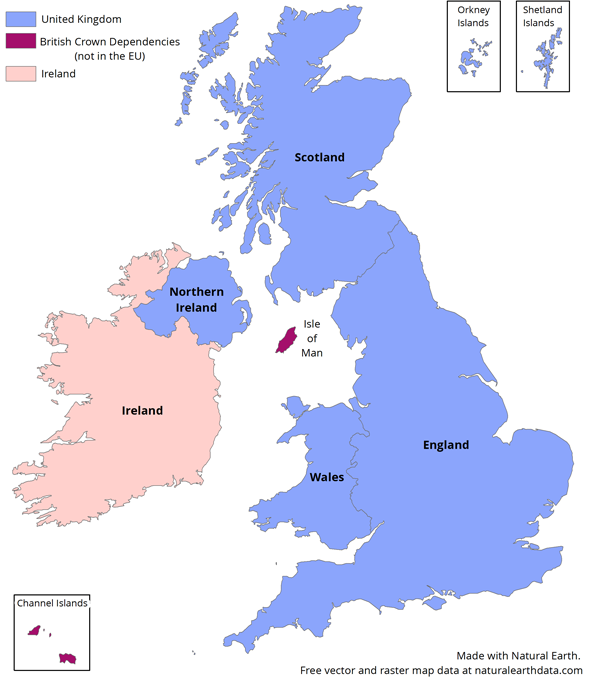
This report also looks in more detail at migration and regular movement across the land border between Ireland and Northern Ireland.
In previous reports the citizenship definition of migrants has been used as the best way to identify those who may be affected by the UK’s decision to leave the EU. Irish and British citizenships are complex. There are many dual nationals and there are further, unknown, numbers of those who have rights to citizenship in both countries but have not yet exercised one of them2 . There have also been increases in applications for Irish citizenship of which it is not yet possible to take account in the available data. For these reasons, this report presents the available statistics on a country of birth basis, estimating the numbers of those born in the UK and living in Ireland and those born in Ireland and living in the UK. Figures for those born in Ireland exclude those born in Northern Ireland (who are in figures for those who are UK-born).
This report has been produced in collaboration with the Northern Ireland Statistics and Research Agency (NISRA) and the Central Statistics Office, Ireland (CSO).
For more information on how the data is compiled, please see Appendix 1.
There are three “types” of migrant discussed in this report.
Long-term resident
Those people who have lived in the UK or Ireland for one year or longer, or intend to live there for one year or longer. However, because this doesn’t include those spending part of the year in either country, two further “types” are considered.
Short-term migrant
Those spending 1 to 12 months living in the UK or Ireland. This can be for any reason and would include those who spend part of the year living in either country.
Visitor
Those spending up to 28 days in the UK or Ireland. This group is largely holidaymakers or those visiting friends or family and will include those who repeatedly spend time in either country.
Notes for: Introduction
Ireland in this report refers to the country of Ireland, see figure 1, as distinct from the island of Ireland.
Differences in the use of citizenship and country of birth definitions for other EU countries are fully explained in the January 2017 report, ‘What information is there on British migrants living in Europe?’
2. Main points
There were an estimated 277,200 people born in the UK and resident in Ireland in 2016; of which 54% were aged 45 years and over.
UK State Pensions received by people living in Ireland (134,840) account for 28% of pensions received in the EU from the UK (excluding UK resident recipients), in February 2017.
An estimated 22,000 visits between 1 to 12 months were made to Ireland from England and Wales in the year ending June 2015.
In terms of visitors (that is, those spending up to 28 days) there were some 3.7 million visits from the UK to Ireland in 2016.
- The most common reason to visit was visiting friends or relatives (40%), followed by for a holiday (36%).
There were an estimated 375,900 people who were born in Ireland and resident in the UK between 2013 to 2015.
- 79% of the people born in the UK and living in Ireland were estimated to be 15 to 64 years old compared with 55% of those who were born in Ireland and resident in the UK.
According to the 2011 Northern Ireland Census, there were 38,000 residents of Northern Ireland who were born in Ireland; these residencies were concentrated around the Northern Ireland-Ireland land border.
According to the 2016 Irish Census, there were 57,000 residents of Ireland who were born in Northern Ireland (1% of the total population); 27,000 (47%) lived in counties that shared a border with Northern Ireland.
There were an estimated 110 million border crossings annually between Ireland and Northern Ireland for all reasons including work, business, trade, education, health and family reasons.
3. How many people, born in the UK, are now living in Ireland?
According to the 2016 Irish Census, the number of people born in the UK and living in Ireland was 277,200. This accounts for 6% of the population resident in Ireland (4,689,900).
This is a decrease of 4% from the estimate of 288,600 in the 2011 Irish Census.
Figure 2 shows that the age distribution of people born in the UK and living in Ireland has changed from predominately younger ages to predominately older ages; a larger proportion of UK-born people living in Ireland were aged 45 years and over in the 2016 Irish Census (54%) compared with the 2011 Irish Census (42%).
Figure 2: Age distribution of UK born individuals living in Ireland 2011 and 2016
Source: Central Statistics Office, Irish Census 2011 and 2016
Download this chart Figure 2: Age distribution of UK born individuals living in Ireland 2011 and 2016
Image .csv .xlsThe latest available detailed breakdown by age and sex available is for 2011.
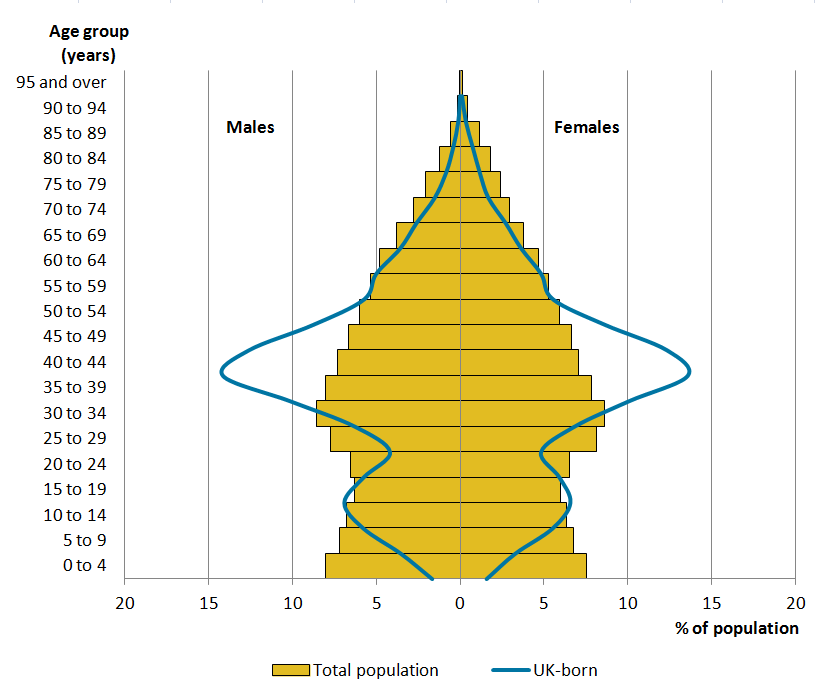
Figure 3 displays the proportional distribution, by age category and sex, of those born in the UK and living in Ireland, compared with all persons living in Ireland.
The two age profiles slightly differ; there was a smaller proportion of the UK-born population who were children (17%), aged 0 to 19, compared with the overall population (27%). Additionally, the 2011 Irish Census estimates that there were a greater proportion of UK-born 35 to 64 year olds compared with the overall population; 66% compared with 38%.
Figure 3: Population pyramid comparing the population of people born in the UK and living in Ireland with the overall population in Ireland, by age and sex, 2011
Source: Central Statistics Office, Irish Census 2011 and 2016
Download this image Figure 3: Population pyramid comparing the population of people born in the UK and living in Ireland with the overall population in Ireland, by age and sex, 2011
.PNG (41.7 kB) .xlsx (13.2 kB)
UK State Pensions
A Department for Work and Pensions (DWP) report (from administrative data1) showed that 134,840 recipients of the UK State Pension were resident in Ireland in February 2017, up from 92,465 in May 2002; a 46% increase.
By February 2017, of all UK State Pensions received by residents living in the European Union (excluding the UK), 28% were received by those living in Ireland (Figure 4).
Anybody with qualifying National Insurance contributions or credits can receive the UK State Pension, so recipients are not necessarily British citizens. Registering an Irish address is not confirmation that the recipient is a long-term resident of Ireland.
Figure 4: Recipients of the UK State Pension living in the European Union, 2002 to 2017
Source: Department for Work and Pensions, UK State Pension Administrative data
Download this chart Figure 4: Recipients of the UK State Pension living in the European Union, 2002 to 2017
Image .csv .xlsNotes for: How many people, born in the UK, are now living in Ireland?
Note that CSO (Ireland) uses 15 to 24 as a standard age break, whilst ONS (UK) uses 16 to 24 years.
DWP administrative data on State Pension recipients is available online.
UK State Pension: These data on UK State Pension recipients include both British citizens and non-British citizens who qualify for a UK State Pension. The data are for people who have notified DWP that they are resident overseas. People are required to inform DWP about any change in their circumstances, including change of address. DWP have data matching arrangements with Ireland, which allows information to be shared about UK State Pension recipients resident in Ireland , including notifications of death. Those living between Ireland and the UK might register to live in Ireland and thus be counted in the Irish population estimates, but register their pension to a home they maintain in the UK.
4. Where are people, born in the UK, living in Ireland?
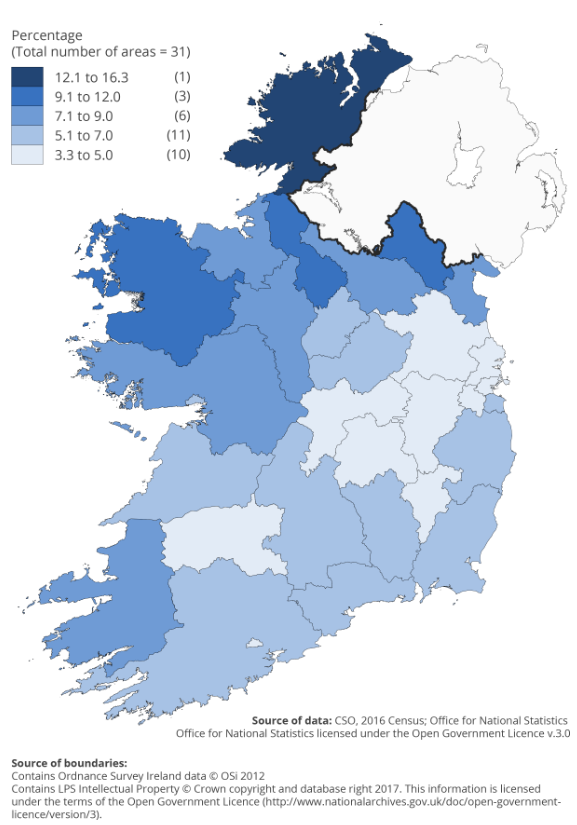
The Central Statistics Office’s (CSO’s) 2016 Census estimates that there were 277,200 people who were born in the UK and live in Ireland. The geographic distribution of these UK-born people follows a similar distribution to the overall population. The most popular areas for people born in the UK, living in Ireland, include: Donegal (9%), Dublin City (8%) and County Cork (8%).
Donegal is the county with the highest proportion of UK-born people, relative to the overall population. An estimated 1 out of every 6 people in Donegal were born in the UK. In part this may be due to the use of maternity services in Northern Ireland by Donegal-resident mothers. Monaghan (1 out of every 9 people), Leitrim (1 out of every 10) and Mayo (1 out of every 10) also have high proportions of UK-born population (Figure 5).
Although Dublin City is a popular place to live for those born in the UK, they are a relatively small proportion of the overall population accounting for 1 out of every 23 people.
Figure 5: UK-born usual residents by county or city as a proportion of all usual residents by county or city, 2016
Source: Central Statistics Office, 2016 Irish Census
Download this image Figure 5: UK-born usual residents by county or city as a proportion of all usual residents by county or city, 2016
.PNG (156.6 kB)
5. What are people who were born in the UK and are living in Ireland doing?
The Central Statistics Office’s (CSO’s) 2011 Census provides us with the most recent data available to give a picture of the jobs that people, who are born in the UK and living in Ireland, are doing. Data from the 2016 Irish Census regarding industry and occupation statistics by birthplace will be available in December 2017.
An estimated 257,500 people, born in the UK, were living in Ireland and were aged 15 years and over in 2011; of which the employment rate was 50%. This is in line with the overall population employment rate of 50% and slightly lower than for those born in the EU27 countries (excluding Ireland) employment rate of 58% (CSO, Census 2011).
UK-born people were estimated to account for 8% of all people who were in employment in Ireland.
The unemployment rate for UK-born people living in Ireland in 2011 was 13%; slightly greater than the overall population (12%) yet lower compared with people born in the remaining EU27 countries (15%)1 .
The remaining population not in the labour force includes 28,400 who were students (10%), 31,100 who were retired (11%) and 39,600 who were not in the labour force for other reasons (for example, looking after family or home or unable to work due to permanent sickness or disability) (15%) (note: totals may not sum due to rounding).
Figure 6 shows that the most common industry for both the overall population and people born in the UK to be employed in was “Wholesale and retail trade; repair of motor vehicles and motorcycles”, employing 11% of UK-born workers in Ireland and 12% of the total employed population. The next most common industry was the “Human health and social work activities” sector employing 10% of UK-born workers compared with 9% of the overall employed population.
UK-born people account for 1 in every 14 people working in “Wholesale and retail trade; repair of motor vehicles and motorcycles” and 1 in every 12 persons working in “Human health and social work activities” in Ireland. Compared with the overall population, more people who were born in the UK are concentrated in the “Arts, entertainment and recreation” and “Information and communication” industries, accounting for 1 in every 10 workers and 1 in 11 workers, respectively.
Note that the industry sector does not necessarily reflect job content – for example, people working in the manufacturing industry can occupy a variety of jobs, such as managerial, operative and cleaning.
Figure 6: Industry of people, born in the UK and living in Ireland, aged 15 years and over and in employment, 2011
Source: Central Statistics Office, Irish Census 2011
Download this chart Figure 6: Industry of people, born in the UK and living in Ireland, aged 15 years and over and in employment, 2011
Image .csv .xlsOut of the 162,300 people born in the UK, aged 15 and over and in the Irish labour force (and not necessarily currently in employment), in 2011, the largest occupation group was “Administrative occupations” (8%). This is followed by “Corporate managers and directors” (7%) (Table 1).
The occupation with the highest proportion of UK-born people out of the total population was “Culture, media and sports occupations”, 1 in every 8 people in this occupation were estimated to be born in the UK.
Table 1: Top 10 occupations for proportion of UK-born individuals out of all persons in each profession, 2011
| UK-born1 (%) | All persons2 (%) | UK born/All persons3 (%) | |||
|---|---|---|---|---|---|
| Culture, media and sports occupations | 2.2 | 1.3 | 12.3 | ||
| Health and social care associate professionals | 1.4 | 1 | 10.7 | ||
| Science, research, engineering and technology professionals | 4.6 | 3.5 | 9.9 | ||
| Corporate managers and directors | 6.7 | 5.4 | 9.4 | ||
| Business, media and public service professionals | 4.8 | 3.9 | 9.2 | ||
| Health professionals | 4.8 | 4 | 9 | ||
| Business and public service associate professionals | 6 | 5.1 | 8.8 | ||
| Skilled construction and building trades | 5.5 | 4.7 | 8.8 | ||
| Other managers and proprietors | 2.7 | 2.3 | 8.7 | ||
| Administrative occupations | 8 | 8.3 | 7.2 | ||
| Source: Central Statistics Office | |||||
| Notes for table 1: | |||||
| 1. UK-born (%): This displays the percentage working in this profession out of all working UK-born individuals (how common the industry is for UK-born individuals) | |||||
| 2. All persons (%): this displays the percentage working in this profession out of all working individuals in Ireland (how common the industry is for all residents of Ireland) | |||||
| 3. This displays the proportion of UK-born individuals working in this profession out of the total population in this profession (the proportion of the industry that is made up of UK-born individuals) | |||||
Download this table Table 1: Top 10 occupations for proportion of UK-born individuals out of all persons in each profession, 2011
.xls (28.7 kB)Notes for: What are people who were born in the UK and are living in Ireland doing?
- Note that unemployment in Ireland was at a high point in 2011, in August 2017 (latest available data) it was 6.3%.
6. 1 to 12 month Short-Term International Migration to Ireland, from England and Wales, year ending June 2015
Short-term migration to Ireland from England and Wales1 in the year to June 2015 was 22,000. The most frequent reason given for short-term migration to Ireland was “Other” reasons.
“Other” reasons include holidays and travelling; visiting or accompanying family and friends; working holidays; medical treatment; and religious pilgrimage.
It should be noted that the International Passenger Survey (IPS) does not sample passengers who cross the land border between the UK (Northern Ireland) and Ireland2.
Notes for: 1 to 12 month Short-Term International Migration to Ireland, from England and Wales, year ending June 2015
These data only include those travelling to and from England and Wales. Short-Term International Migration (STIM) estimates were developed as part of the Improving Migration and Population Statistics programme. This programme was set up to improve our understanding of population and migration and in particular the local authority population estimates for England and Wales. For further information, please refer to section 3.2 in our Short-Term International Migration Estimates: Frequently Asked Questions.
Short-Term International Migration estimates are derived from the International Passenger Survey (IPS). The IPS does not sample passengers who cross the land border between the UK (Northern Ireland) and the Ireland. In addition, until 2009 no ports in Northern Ireland were surveyed in the IPS. Belfast International Airport has been included in the sample since 2009, which will identify any short-term migrants arriving or departing from there on international flights. No adjustments are made to England and Wales STIM estimates to allow for this and therefore any short-term migrants from outside the UK including Ireland who arrive in Northern Ireland via the land border and move to England or Wales during their stay are not included in the estimates. However, this number is thought to be relatively low. Family doctor registration data are the most complete source that can be used to estimate international immigration to Northern Ireland. This source is used to estimate LTIM but there is currently no way to count short-term migrants who go on to enter England or Wales using this source.
The IPS is a sample survey and therefore subject to some uncertainty. When data are disaggregated to a country level confidence intervals will be larger, but the data are useful as a broad indication of trends.
This data source estimates the number of journeys, rather than the number of people visiting.
There is evidence to suggest that due to the sampling design and coverage of the International Passenger Survey (IPS) between 2004 and 2008, coverage of some routes may have caused some short-term migrants to be missed. For more information, please refer to our Quality of Long-Term International Migration estimates from 2001 to 2011 full report.
7. UK residents travelling to Ireland for less than 28 days
The International Passenger Survey (IPS) estimates that there were 3.7 million visits of less than 28 days from UK residents to Ireland in 2016.
The most common reason for a visit to Ireland was by those visiting friends or relatives (40%) followed by those visiting for holiday (36%) (Figure 7) (note totals may not sum due to rounding).
Figure 7: Reason for visit by UK residents to Ireland for less than 28 days with at least one overnight stay in Ireland, 2016
Source: Office for National Statistics, International Passenger Survey
Download this chart Figure 7: Reason for visit by UK residents to Ireland for less than 28 days with at least one overnight stay in Ireland, 2016
Image .csv .xlsNotes for: UK residents travelling to Ireland for less than 28 days
The IPS does not sample passengers who cross the land border between the UK (Northern Ireland) and Ireland. NISRA and CSO provide household survey based estimates of the number of Northern Ireland and Ireland residents who make overnight visits to the other jurisdiction. Estimates of the total number of land border crossings have also been calculated using transport models commissioned by Northern Ireland’s Department for Infrastructure (DfI).
Until 2009 no ports in Northern Ireland were surveyed in the IPS. Belfast International Airport has been included in the sample since 2009. No adjustments are made to England and Wales Short-Term International Migration STIM estimates to allow for this and therefore any short-term migrants who move from Northern Ireland to England or Wales during their stay are not included in the estimates. However, this number is thought to be relatively low. Family doctor registration data are the most complete source that can be used to estimate international immigration to Northern Ireland. This source is used to estimate Long-Term International Migration LTIM but there is currently no way to count short-term migrants who go on to enter England or Wales using this source.
International Passenger Survey data counts only the number of visits made – there may be multiple trips by one person. These data includes British citizens who are resident in the UK, but doesn’t include British citizens resident in other countries. These data might also include (but not identify) those who travel to and from Ireland regularly. For the purposes of this report, data are provided for only those visits of 28 days or less (this may include day trips), so that there is no overlap with short-term migration estimates. Regular Overseas Travel and Tourism reports do not make this distinction.
Further information on the quality of the Annual Population Survey is available.
8. How many people, who were born in Ireland, are living in the UK?
According to the Population by country of birth and nationality estimates, 2016, there were an estimated 389,000 people who were born in Ireland and resident in the UK, based on one year of data from the Annual Population Survey (APS).
For more detailed analysis the three-year pooled APS dataset, which provides a larger sample than annual data, is used. It is an average for the years January 2013 to December 2015 and estimates 375,900 people, born in Ireland, were living in the UK.
Figure 8 compares the size of the population of UK-born people living in Ireland with the population of Irish-born people within the UK.
Of the Irish-born population living in the UK, 42% were aged 65 years and over, compared with 10% of the UK-born population living in Ireland.
Of the people born in the UK and living in Ireland, 79% were aged 15 to 64–years old, compared with 55% of those who were born in Ireland and resident in the UK (in 2011).
Figure 8: Population pyramid comparing the number of people born in Ireland resident in the UK compared with people born in the UK and resident in Ireland, by age and sex

Source: Office For National Statistics, Annual Population Survey three year pooled dataset (annual average 2013 to 2015) and Central Statistics Office, 2011 Irish Census
Download this image Figure 8: Population pyramid comparing the number of people born in Ireland resident in the UK compared with people born in the UK and resident in Ireland, by age and sex
.PNG (34.3 kB)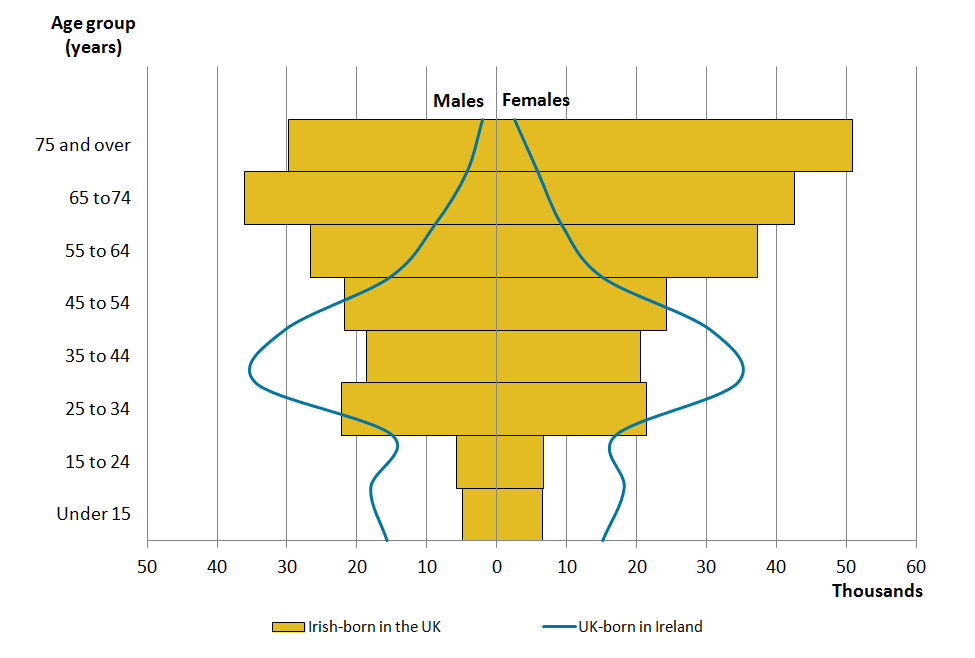
Like many immigrants in the UK, Irish-born people are concentrated in London. It is estimated that one out of every three people born in Ireland and living in the UK live in London (98,100 people).
Notes for: How many people, who were born in Ireland, are living in the UK?
Data are collected from individuals in households, but do not include most communal establishments (managed accommodation such as halls of residence, hostels and care homes); this means that students living in communal establishments will only be included in APS estimates if their parents (resident in a household) are sampled and include the absent student.
Students living in non-communal establishments will be captured in APS sampling.
The APS will include long-term migrants and some short-term migrants although it is unlikely to include short-term migrants living in the UK for very short periods of time.
The APS three-year pooled dataset Jan 2013 to Dec 2015 is less sensitive to more volatile trends than one-year datasets as this dataset encompasses three years.
9. What are people who were born in Ireland and living in the UK doing?
The three-year Annual Population Survey (APS) dataset estimates that there were 149,000 people who were born in Ireland and living in the UK who were aged 16 to 64 and employed between 2013 and 2015.
The employment rate for people born in Ireland and living in the UK was 73%, similar to the estimated employment rate for the whole of the UK population, 72%.
An estimated 3% of the population who were born in Ireland and living in the UK, for 2013 to 2015, were unemployed, compared with the overall population, 5%.
Of people who were born in Ireland and living in the UK, 3% were estimated to be students (overall population, 6%).
There is a slightly higher proportion of people who were born in Ireland who were estimated as “inactive other” (those who are retired, those who are looking after family or home, or unable to work due to permanent sickness or disability), 21% in comparison with the overall population, 17%.
The most common industry sector for people born in Ireland, as it is for the overall population, is the “Public administration, education and health” sector, where one in every three Irish-born people work in this sector (50,900) (Figure 9).
Of the 50,900 Irish-born people, working in the “Public administration, education and health” sector, just over one-third worked in “Human health activities” (17,400). There were 3,400 Irish-born people who worked in “Residential care activities” accounting for less than 1% of the total workforce in this industry. An estimated one in every five resident people, born in Ireland, worked in the “Banking and finance” sector (30,000).
Note that the industry sector does not necessarily reflect job content – for example, people working in the manufacturing industry occupy a variety of jobs, such as managerial, operative and cleaning.
Figure 9: Proportion of those born in Ireland and aged 16 to 64, in employment, in the UK, compared with the overall population aged 16 to 64 in the UK, by industry of employment, 2013 to 2015
Source: Office for National Statistics
Download this chart Figure 9: Proportion of those born in Ireland and aged 16 to 64, in employment, in the UK, compared with the overall population aged 16 to 64 in the UK, by industry of employment, 2013 to 2015
Image .csv .xlsAn estimated 34% of all UK residents, who were born in Ireland and in employment, worked in “Professional occupations” compared with 20% of the overall labour market (Figure 10). “Professional occupations” are those that require a degree or equivalent qualification, post-graduate qualifications and/or a formal period of experience-related training.
Of these “Professional occupations “, the most common are “Teaching and educational professions” (10,000), “Nursing and midwifery professions” (8,000), followed by “IT and telecommunication professions” (7,100).
Figure 10: Occupational classification for both those born in Ireland and the overall population aged 16 to 64, in employment in the UK, 2013 to 2015
Source: Office for National Statistics, Annual Population Survey three year pooled dataset (annual average 2013 to 2015)
Download this chart Figure 10: Occupational classification for both those born in Ireland and the overall population aged 16 to 64, in employment in the UK, 2013 to 2015
Image .csv .xlsNotes for: What are people who were born in Ireland and living in the UK doing?
Analysis only accounts for main jobs. This will not include the industries in their second job.
In the APS three-year pooled dataset (2013 to 2015), halls of residence are not sampled so students may be underrepresented. It is also possible for a working student to be counted as “working”, rather than a student, in this data.
10. 1 to 12 month Short-Term International Migration from Ireland to England and Wales, year ending June 2015
There were 29,000 visits of 1 to 12 months to England and Wales from Ireland for the year ending June 2015. The most common reason for visits was “Other” with 18,000 visits. The remaining 12,000 short-term visits are accounted for by those visiting for “Work” (note, totals may not sum due to rounding).
In these data, “Employment” (migration to work, paid in the new country in which the migrant works) and “Work (other)” (self-employment and visiting on business for their existing employer) are combined as “Work”. “Other” reasons include holidays and travelling; visiting or accompanying family and friends; working holidays; medical treatment and religious pilgrimage.
These estimates have been derived from the International Passenger Survey (IPS). It is important to note that this is a partial picture as the IPS does not sample passengers who cross the land border between the UK (Northern Ireland) and Ireland3.
Notes for: 1 to 12 month Short-Term International Migration from Ireland to England and Wales1, year ending June 20152
These data only include those travelling to and from England and Wales. Short-term international migration estimates were developed as part of the Improving Migration and Population Statistics programme. This programme was set up to improve our understanding of population and migration and in particular the Local Authority Population Estimates for England and Wales. For further information, please refer to section 3.2 in our Short-Term International Migration Estimates: Frequently Asked Questions.
2015 are provisional data.
Short-term international migration estimates are derived from the International Passenger Survey (IPS). The IPS does not sample passengers who cross the land border between the UK (Northern Ireland) and the Ireland. In addition, until 2009 no ports in Northern Ireland were surveyed in the IPS. Belfast International Airport has been included in the sample since 2009, which will identify any short-term migrants arriving or departing from there on international flights. No adjustments are made to England and Wales Short-Term International Migration STIM estimates to allow for this and therefore any short-term migrants from outside the UK including Ireland who arrive in Northern Ireland via the land border and move to England or Wales during their stay are not included in the estimates. However, this number is thought to be relatively low. Family doctor registration data are the most complete source that can be used to estimate international immigration to Northern Ireland. This source is used to estimate Long-Term International Migration LTIM but there is currently no way to count short-term migrants who go on to enter England or Wales using this source.
The IPS is a sample survey and therefore subject to some uncertainty. When data are disaggregated to a country level confidence intervals will be larger, but the data are useful as a broad indication of trends.
This data source estimates the number of journeys, rather than the number of people visiting.
There is evidence to suggest that due to the sampling design and coverage of the International Passenger Survey (IPS) between 2004 and 2008, coverage of some routes may have caused some short-term migrants to be missed. For more information, please refer to our Quality of Long-Term International Migration estimates from 2001 to 2011 full report.
11. Residents of Ireland travelling to the UK for less than 28 days
The International Passenger Survey (IPS) provides information on the number of international visits to and from the UK.
There were an estimated 2.9 million visits by residents of Ireland in 2016. The most common reason for visiting the UK from Ireland was to visit friends or relatives, followed by visiting for holiday (Figure 11) .
Figure 11: Visits to the UK from Irish residents, for less than 28 days, by reason for visit, 2016
Source: Office for National Statistics, International Passenger Survey
Download this chart Figure 11: Visits to the UK from Irish residents, for less than 28 days, by reason for visit, 2016
Image .csv .xlsNISRA’s 2016 Tourism Statistics Bulletin reported that residents of Ireland made 456,000 overnight visits to Northern Ireland in 2016.
Notes for: Residents of Ireland travelling to the UK for less than 28 days
The IPS does not sample passengers who cross the land border between the UK (Northern Ireland) and Ireland. NISRA and CSO provide household survey based estimates of the number of Northern Ireland and Ireland residents who make overnight visits to the other jurisdiction. Estimates of the total number of land border crossings have also been calculated using transport models commissioned by Northern Ireland’s Department for Infrastructure (DfI).
Until 2009 no ports in Northern Ireland were surveyed in the IPS. Belfast International Airport has been included in the sample since 2009. No adjustments are made to England and Wales Short-Term International Migration STIM estimates to allow for this and therefore any short-term migrants who move from Northern Ireland to England or Wales during their stay are not included in the estimates. However, this number is thought to be relatively low. Family doctor registration data are the most complete source that can be used to estimate international immigration to Northern Ireland. This source is used to estimate Long-Term International Migration LTIM but there is currently no way to count short-term migrants who go on to enter England or Wales using this source.
International Passenger Survey data counts only the number of visits made – there may be multiple trips by one person. These data includes British citizens who are resident in the UK, but doesn’t include British citizens resident in other countries. These data might also include (but not identify) those who travel to and from Ireland regularly. For the purposes of this report, data are provided for only those visits of 28 days or less, so that there is no overlap with short-term migration estimates. Regular Overseas Travel and Tourism reports do not make this distinction.
Further information on the quality of the Annual Population Survey is available.
12. Migration and regular movement across the land border between Ireland and Northern Ireland
Residents of Northern Ireland born in Ireland
The Northern Ireland Census 2011 (Northern Ireland Statistics and Research Agency (NISRA)) captured information of those who were resident in Northern Ireland at that point in time.
In 2011, there were 38,000 residents in Northern Ireland who were born in Ireland (2% of the total Northern Ireland population of 1.8 million). Of the 38,000 residents the largest numbers lived in Derry City and Strabane District Council (18%); Belfast District Council (16%); Newry, Mourne and Down; and Fermanagh and Omagh District Councils (both 14%).
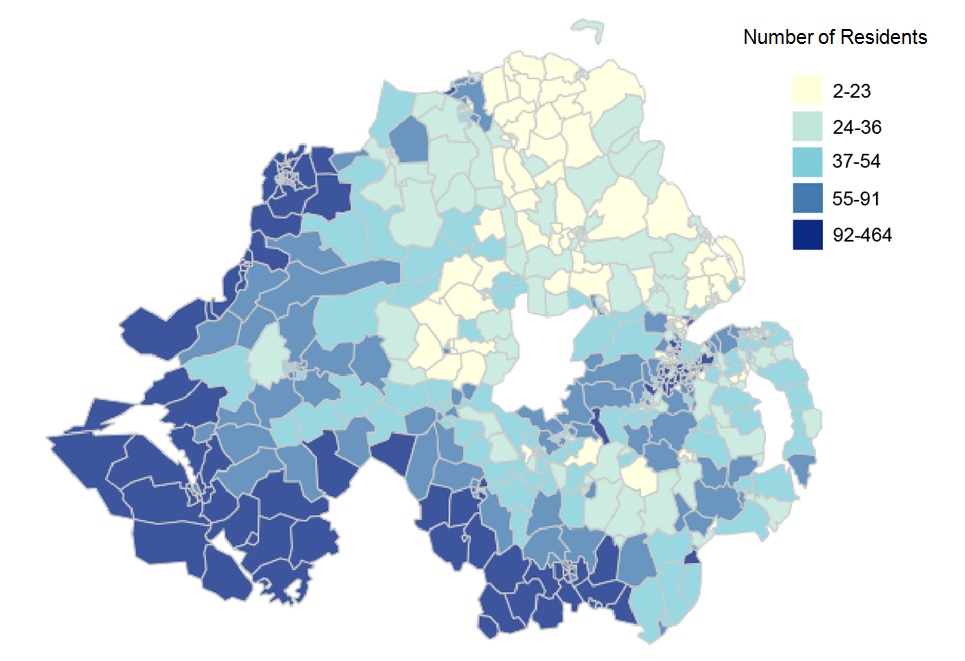
Figure 12 shows that the closer the proximity to the Northern Ireland-Ireland border the higher the concentration of Ireland-born residents in Northern Ireland. The five district councils that fall along the border have 61% (23,000) of residents born in Ireland.
Figure 12: Number of residents living in Northern Ireland who were born in Ireland by ward, 2011
Source: Source: Northern Ireland Census, 2011, NISRA
Download this image Figure 12: Number of residents living in Northern Ireland who were born in Ireland by ward, 2011
.PNG (342.1 kB) .xlsx (23.5 kB)
Residents of Ireland born in Northern Ireland
Similarly, Central Statistics Office’s Census 2016 captured information of those people resident in Ireland who were born in Northern Ireland.
In 2016, there were 57,000 residents in the Ireland who were born in Northern Ireland (1% of the total population). Of the 57,000 residents, 27,000 (47%) lived in counties that shared a border with Northern Ireland.
Of this 27,000 residents, the largest numbers lived in County Donegal (47% or 13,000 residents) and County Louth (26% or 7,000) (Table 2).
Regular movement across the border
There are an estimated 110 million Northern Ireland-Ireland border crossings annually1.
The majority of these crossings are by private vehicle. In May 2017, there were on average an estimated 118,000 vehicle crossings on a daily basis, accounting for 43 million crossings annually2. In 2016 to 2017 it was estimated that there were approximately 900,000 cross-border coach passenger journeys and 868,500 cross-border rail passenger journeys3.
These cross-border movements are made for a variety of reasons including for work, business, trade, education, health, family or other reasons.
Northern Ireland’s Tourism Statistics Bulletin 2016 shows 456,000 residents of Ireland made an overnight trip to Northern Ireland in 2016.
Similarly, NISRA estimated that residents of Northern Ireland made 1.36 million overnight trips to Ireland in 2016 staying 2.5 days on average5.
For further information on the available data and statistics relating to the movement within the Common Travel Area (CTA) between the UK and Ireland please see the Additional Data paper: Common Travel Area Data and Statistics.
Commuters
The 2011 Censuses for Northern Ireland (NISRA) and Ireland (Central Statistics Office (CSO)) estimate that 14,800 people regularly commute across the border from their place of residence to their place of work or study4.
Resident in Ireland and place of work or study is in Northern Ireland
Ireland’s CSO Census 2016 Profile 6 – Commuting in Ireland provides us with a recent picture of those who commute across the border to their place of work. CSO recorded 9,336 people who cross the border to their place of work or study (Table 2).
Workers accounted for 75% of these commuters and students accounted for the remainder.
Donegal accounted for the largest number of cross-border commuters, with 5,600 commuters, 76% of whom travelled to County Derry/Londonderry.
Table 2: Origin and destination of "cross border" workers and students, 2016
| (Destination) | ||||||||
| County | Armagh | Antrim | Down | Derry/Londonderry | Fermanagh | Tyrone | Total | |
|---|---|---|---|---|---|---|---|---|
| Donegal | 21 | 252 | 33 | 4,256 | 131 | 915 | 5,608 | |
| Monaghan | 533 | 97 | 89 | 21 | 154 | 218 | 1,112 | |
| Louth | 410 | 128 | 350 | 15 | 2 | 21 | 926 | |
| Cavan | 33 | 19 | 12 | 9 | 396 | 24 | 493 | |
| Dublin City | 23 | 81 | 37 | 15 | 2 | 19 | 177 | |
| Leitrim | 3 | 10 | 1 | 4 | 113 | 17 | 148 | |
| All other counties | 123 | 345 | 153 | 87 | 79 | 85 | 872 | |
| Total | 1,146 | 932 | 675 | 4,407 | 877 | 1,299 | 9,336 | |
| Source: CSO, 2016 Irish Census | ||||||||
Download this table Table 2: Origin and destination of "cross border" workers and students, 2016
.xls (28.2 kB)CSO, 2016 Irish Census
Resident in Northern Ireland and place of work is in Ireland
Data from NISRA, based on the 2011 Census, estimated that 6,100 commuters who were resident in Northern Ireland commuted to their place of work in Ireland (Table 3).
Newry, Mourne, and Down Local Government District accounted for the largest number of cross-border commuter from Northern Ireland, with 1,700, of whom 43% travelled to County Louth.
Table 3: Origin and destination of "cross border" workers, 2011
| (Destination) | ||||||||||||||||
|---|---|---|---|---|---|---|---|---|---|---|---|---|---|---|---|---|
| Dublin City | South Dublin | Fingal | Dun Laoghaire- Rathdown | Kildare County | Louth County | Meath County | Leitrim County | Sligo County | Cavan County | Donegal County | Monaghan County | Ireland - Other | Total | |||
| Newry, Mourne and Down | 218 | 38 | 82 | 32 | 17 | 747 | 53 | 2 | 0 | 7 | 8 | 107 | 438 | 1,749 | ||
| Fermanagh and Omagh | 48 | 7 | 18 | 10 | 6 | 13 | 4 | 59 | 65 | 345 | 199 | 243 | 277 | 1,294 | ||
| Derry City and Strabane | 21 | 7 | 5 | 4 | 8 | 6 | 1 | 0 | 2 | 3 | 855 | 6 | 310 | 1,228 | ||
| Armagh City, Banbridge and Craigavon | 75 | 13 | 39 | 17 | 3 | 124 | 16 | 0 | 1 | 22 | 7 | 233 | 162 | 712 | ||
| Mid Ulster | 37 | 5 | 9 | 11 | 8 | 18 | 8 | 2 | 2 | 12 | 11 | 119 | 114 | 356 | ||
| Belfast | 66 | 12 | 15 | 21 | 4 | 23 | 6 | 0 | 1 | 1 | 6 | 2 | 81 | 238 | ||
| Lisburn and Castlereagh | 41 | 5 | 13 | 8 | 4 | 13 | 0 | 0 | 0 | 1 | 4 | 5 | 46 | 140 | ||
| Causeway Coast and Glens | 20 | 1 | 5 | 3 | 2 | 3 | 1 | 0 | 0 | 1 | 36 | 0 | 61 | 133 | ||
| Ards and North Down | 20 | 3 | 11 | 6 | 2 | 3 | 3 | 0 | 0 | 0 | 0 | 0 | 28 | 76 | ||
| Antrim and Newtownabbey | 20 | 5 | 3 | 1 | 2 | 7 | 2 | 0 | 1 | 2 | 2 | 1 | 28 | 74 | ||
| Mid and East Antrim | 17 | 3 | 10 | 4 | 0 | 2 | 2 | 0 | 0 | 0 | 5 | 1 | 26 | 70 | ||
| Total | 583 | 99 | 210 | 117 | 56 | 959 | 96 | 63 | 72 | 394 | 1,133 | 717 | 1,571 | 6,070 | ||
| Source: NISRA, Census 2011 | ||||||||||||||||
| Table CT0354NI: LOCATION OF USUAL RESIDENCE AND PLACE OF WORK IN IRELAND | ||||||||||||||||
| Notes: | ||||||||||||||||
| 1. The category "Ireland - Other" includes Ireland - part not specified | ||||||||||||||||
Download this table Table 3: Origin and destination of "cross border" workers, 2011
.xls (31.2 kB)EU migrants living in Northern Ireland
In October to December 2016, it is estimated that there were 117,000 persons6 resident in Northern Ireland with an EU (27) country of birth, that is, excluding those born in the UK and including those born in Ireland. This represented 6.3% of the Northern Ireland population (Table 4) and was the second highest population rate among the UK countries and regions, after London (11.0%) (Table 5).
Among the 117,000 EU (27)-born population in Northern Ireland, about 38,0007 (33%) were born in Ireland (2.1% of the Northern Ireland population). Excluding this group, Northern Ireland had the fourth highest rate of those born in the EU (26) of the UK countries and regions.
The next most frequent countries of birth for EU migrants were Poland (25,000) and Lithuania (25,000). It is not possible to reliably estimate the individual EU countries of birth for the remaining 28,000 EU migrants from the Labour Force Survey.
Northern Ireland had the second lowest proportion of its population who were born outside the EU (2.5%) compared with other parts of the UK. Wales has the lowest at 2.4%.
Table 4: Total Northern Ireland population by country of birth (October to December 2016)
| Country of birth | Numbers in population | % of total NI population |
|---|---|---|
| Ireland | 38,000 | 2.1 |
| Poland | 25,000 | 1.4 |
| Lithuania | 25,000 | 1.4 |
| Other EU(261) | 28,000 | 1.5 |
| Subtotal of EU (261) Countries of birth | 79,000 | 4.3 |
| Subtotal of EU (272) Countries of birth | 117,000 | 6.3 |
| Non-EU | 45,000 | 2.5 |
| Northern Ireland/ Great Britain | 1,678,000 | 91.2 |
| Total NI population | 1,840,000 | 100 |
| Source: Labour Force Survey, October-December 2016 | ||
| Notes: | ||
| 1. EU 26 refers to countries of the EU excluding the UK and Ireland | ||
| 2. EU 27 refers to countries of the EU excluding the UK | ||
Download this table Table 4: Total Northern Ireland population by country of birth (October to December 2016)
.xls (27.6 kB)Table 5: Total population by country of birth by UK regions
| United Kingdom | EU(27) | EU (26) | Ireland | Non-EU | Non-UK Ireland | Total | |||||||
|---|---|---|---|---|---|---|---|---|---|---|---|---|---|
| Total (000's) | Rate (%) | Total (000's) | Rate (%) | Total (000's) | Rate (%) | Total (000's) | Rate (%) | Total (000's) | Rate (%) | (Rate, %) | |||
| North East | 2464 | 94.2 | 49 | 1.9 | 46 | 1.8 | 3 | 0.1 | 102 | 3.9 | 5.7 | 2615 | |
| North West | 5180 | 90.1 | 213 | 3.7 | 183 | 3.2 | 30 | 0.5 | 355 | 6.2 | 9.4 | 5748 | |
| Merseyside | 1289 | 92.9 | 34 | 2.5 | 23 | 1.7 | 11 | 0.8 | 65 | 4.7 | 6.3 | 1388 | |
| Yorkshire & Humberside | 4846 | 90.3 | 208 | 3.9 | 186 | 3.5 | 22 | 0.4 | 312 | 5.8 | 9.3 | 5366 | |
| East Midlands | 4099 | 87.9 | 262 | 5.6 | 230 | 4.9 | 32 | 0.7 | 303 | 6.5 | 11.4 | 4663 | |
| West Midlands | 5010 | 87.3 | 262 | 4.6 | 226 | 3.9 | 36 | 0.6 | 469 | 8.2 | 12.1 | 5741 | |
| Eastern | 5281 | 86.9 | 364 | 6 | 323 | 5.3 | 41 | 0.7 | 434 | 7.1 | 12.5 | 6079 | |
| London | 5379 | 61.7 | 956 | 11 | 872 | 10 | 84 | 1 | 2385 | 27.4 | 37.4 | 8721 | |
| South East | 7737 | 86.8 | 493 | 5.5 | 445 | 5 | 48 | 0.5 | 680 | 7.6 | 12.6 | 8910 | |
| South West | 4908 | 90.2 | 251 | 4.6 | 226 | 4.2 | 25 | 0.5 | 281 | 5.2 | 9.3 | 5440 | |
| Wales | 2918 | 94.8 | 87 | 2.8 | 71 | 2.3 | 16 | 0.5 | 74 | 2.4 | 4.7 | 3079 | |
| Scotland | 4837 | 91.3 | 218 | 4.1 | 192 | 3.6 | 26 | 0.5 | 244 | 4.6 | 8.2 | 5299 | |
| Northern Ireland | 1678 | 91.2 | 117 | 6.3 | 78 | 4.3 | 38 | 2.1 | 45 | 2.5 | 6.7 | 1840 | |
| Total | 55627 | 85.7 | 3513 | 5.4 | 3101 | 4.8 | 412 | 0.6 | 5748 | 8.9 | 13.6 | 64889 | |
| Source: Labour Force Survey, October - December 2016 | |||||||||||||
| Notes: | |||||||||||||
| 1. Figures may not sum due to rounding | |||||||||||||
| 2. Estimates are subject to sampling error | |||||||||||||
| 3. 'All EU' includes Ireland | |||||||||||||
Download this table Table 5: Total population by country of birth by UK regions
.xls (31.2 kB)Northern Ireland has a relatively lower percentage (4.3%) of persons born in EU (26) countries than in Ireland (6.3%) (Table 6). It has also about half the rate of non-EU-born residents (2.5%) compared with Ireland (5.1%).
Table 6: Total Ireland population by country of birth (2016 Census )
| Country of birth | Numbers in population | % of total Ireland population |
|---|---|---|
| Great Britain | 219,800 | 4.7 |
| Poland | 115,200 | 2.5 |
| Northern Ireland | 57,400 | 1.2 |
| Lithuania | 33,300 | 0.7 |
| Other EU(261) | 145,300 | 3.1 |
| Subtotal of EU (261) Countries of birth | 293,800 | 6.3 |
| Subtotal of EU (272) Countries of birth | 571,000 | 12.2 |
| Non-EU | 239,400 | 5.1 |
| United Kingdom | 277,200 | 5.9 |
| Total Ireland population | 4,689,900 | 100 |
| Source: CSO, Irish Census 2016 | ||
| Notes: | ||
| 1. EU 26 refers to countries of the EU excluding the UK and Ireland | ||
| 2. EU countries of the EU excluding Ireland | ||
Download this table Table 6: Total Ireland population by country of birth (2016 Census )
.xls (28.2 kB)Notes for: Migration and regular movement across the land border between Ireland and Northern Ireland
The Labour Force Survey (LFS) is a sample survey and the statistical margin of error for this figure is plus or minus 14,000 (0.6 percentage points). The true number of EU migrants resident in Northern Ireland therefore lies in the range 103,000 to 131,000. See Table 5 in the Annex.
The statistical margin of error is plus or minus 8,000 (0.4%). The true figure therefore lies in the range 30,000 to 47,000.
Person border crossings estimates, Department for Infrastructure (Northern Ireland), June 2017.
Department for Infrastructure (Northern Ireland) Traffic Counter Information (2017), Unpublished. It is important to note that there are many crossing points not covered by this counter data and many of these crossings will also have more than one occupant.
Translink, Unpublished. Note the cross-border coach passenger journeys statistic includes journeys from a number of different operators.
Census 2011, Ireland and Northern Ireland, CSO and NISRA, June 2014. Note these commuter figures will exclude self-employed people.
13. Next steps
Office for National Statistics (ONS) is in the process of Improving the evidence on migrants in the UK, aiming to make better use of data sources and offer more detail on migrants living in the UK. Improvements to international data sources on migration could add to the body of evidence on British citizens living in the EU, which will continue to be monitored by ONS. In addition, it is possible that potential future access to data sources, such as the Department of Health European Health Insurance Card (EHIC), may contain useful detailed information.
Nôl i'r tabl cynnwys14. Appendix 1: More information on how the data were compiled
This report uses a variety of additional data sources to provide more up-to-date data on the resident populations and the number of short-term migration events and visits by British citizens to the EU (and by EU citizens to the UK).
Table 7: Comparison of definitions between data sources used in this report
| Type of migrant | Source | Country of birth | Migrant definition | |||||
|---|---|---|---|---|---|---|---|---|
| Long-term residents | British born in Ireland | Census 2011 and Census 2016 Central Statistics Office (CSO) | Yes, estimates are by country of birth. This is derived from question 6 of the CSO Censuses. | Those who have lived in another country for 12 months or more. | ||||
| UK state pensions claimed abroad, DWP | Does not provide estimates by country of birth | No definition is applied, although it is assumed that those claiming pension in another country will be a long-term resident | ||||||
| Irish born in UK | 3 year pooled Annual Population Survey (2013 to 2015), Office for National Statistics (ONS) | Yes, estimates are by country of birth. | The APS will include long-term migrants and some short-term migrants although it is unlikely to include short-term migrants living in the UK for very short periods of time | |||||
| Short-term migrants | British residents in EU8 countries EU8 residents in UK | Short-term international migration estimates, ONS | Estimates are by residence. There is no country of birth question for short-term migrants. | Those that migrate between 1 to 12 months for all reasons | ||||
| Visitors | British residents in Ireland Irish-born in the UK | Visitor estimates, ONS | Estimates are by residence. There is no country of birth question for visitors. | Visits abroad. For the purposes of this report, data is provided for only those visits of 28 days or less, so that there is no overlap with short-term migration estimates. | ||||
| Source: Office for National Statistics | ||||||||