1. Abstract
In order to properly understand changes in households' economic well-being, it is important to have measures which reflect the experience of the typical household and can also provide a description of the distribution. However, the complexities of producing such measures means they are typically only available with a significant time lag. This article therefore presents a methodology for producing early/provisional estimates of median equivalised disposable income and other measures, which has been used in the accompanying statistical bulletin Nowcasting household income in the UK: Financial year ending 2016. This methodology builds upon the initial approach set out in a July 2015 paper Nowcasting household income in the UK: initial methodology, taking account of the helpful feedback received from experts and potential users of these estimates.
Nôl i'r tabl cynnwys2. Background
In measuring how living standards have changed over time, median household disposable income is widely regarded as one of the most important indicators (see for example OECD, 2013; ONS, 2014 Stiglitz et al., 2009). Disposable income is the amount of money that households have available for spending and saving after direct taxes (such as Income Tax, National Insurance contributions and Council Tax) have been accounted for. It includes earnings from employment, private pensions and investments as well as cash benefits provided by the state. The median household income is the income of what would be the middle household, if all households in the UK were sorted in a list from poorest to richest. As it represents the middle of the income distribution, the median household income provides a good indication of the standard of living of the “typical” household in terms of income.
However, most of the time we also want to have information on the whole distribution of household income and analyse not only a typical household but also those towards the top and bottom of the income distribution. The importance of looking at the distribution of income when assessing economic well-being has been emphasised by the Organisation for Economic Co-operation and Development (OECD) (2013), Stiglitz et al. (2009) and many others.
A variety of inequality measures are calculated based on disposable income, including the most commonly used, the Gini coefficient. Together, these measures provide evidence of how incomes are shared across households and how this is changing over time. However, one important limitation in using such measures as proxies for changes in material living standards is their lack of timeliness. Unlike macro-economic indicators such as GDP per head or real household disposable income (RHDI), which are typically available within a few months, statistics on the distribution of income in the UK and other countries are typically produced to a much longer timetable, reflecting the complexity involved in collecting, processing and analysing household financial survey data. For example, our Effects of taxes and benefits on household income (ETB) publication has historically been released in June, approximately 15 months after the end of the income reference period.
Up-to-date measures of household incomes provide a valuable tool for evaluating the impact of tax and benefit policies, and for informing wider public debate on living standards. In order to address the considerable demand for more timely data it is necessary to consider the use of alternative methods for arriving at early distributional estimates, such as nowcasting. Nowcasting is an increasingly popular approach for providing initial estimates of such indicators. Unlike forecasting, which relies heavily on projections and assumptions about the future economic situation, nowcasting uses data on the income distribution for previous years, information on current tax and benefit policies, and key macro-economic variables to estimate current indicators. This paper presents the methodology used for nowcasting some of the main indicators from our Effects of taxes and benefits series in order to provide users with an early insight into the latest trends.
A number of organisations, including the Institute for Fiscal Studies (IFS), Resolution Foundation and New Policy Institute (NPI) have already carried out extensive work on nowcasting various income and poverty indicators for the UK. At an international level, Holly Sutherland and colleagues at the Institute of Social and Economic Research (ISER) have produced estimates of current income, risk-of-poverty and inequality for a number of other EU countries.
In order to estimate current median income and other distributional measures, it is important to capture how changes in macro-economic conditions affect households at different points of the income distribution. Microsimulation models are appropriate tools for taking into account the complex interactions between policy and changing household circumstances (Immervoll et al., 2006). In the context of nowcasting, what these models do is replicate the structure of the tax and benefit system currently in place and simulate how any changes to the system affect the distribution of disposable income.
Beyond reflecting changes in policies and the levels of income from sources such as earnings, there are other aspects that need to be considered when producing nowcast estimates of income. One of the main challenges in nowcasting is to adequately incorporate any changes in the labour market, such as increase in part-time employment, and any shifts in the demographic structure. In the analysis below, we have tried to address both of these issues.
It is important to mention that these are experimental statistics and, as such, should be treated with caution. As with any other nowcast, the accuracy of the indicators will inevitably depend on many factors. Throughout the work feeding into this bulletin, we have tested a variety of approaches in order to develop a robust methodology and, in the process, have sought to learn from other experts in the field. It is, of course, unrealistic to expect nowcast estimates to perfectly reflect changes in the distribution of income, particularly when examining smaller subgroups of the population.
However, while nowcasting may be subject to some limitations, it has the benefit of producing timely estimates of household income and, therefore, the potential to aid the design of effective tax and benefit policies and to facilitate monitoring of the impact of recent changes in other economic policies.
Nôl i'r tabl cynnwys3. Methodology
In the work reported in this paper, historical income data were used to nowcast the 2014/15 and 2015/16 distribution of disposable income. The growth rate between the 2 nowcasts was then applied to published 2014/15 estimates from the latest Effects of taxes and benefits on household income (ETB) release, published 24 May 2016.
In order to capture how changes in macro-economic conditions affect households at different points of the income distribution, existing microsimulation tools used by the UK government were combined with additional adjustments needed to reflect changes in the labour market and other population characteristics over time. The nowcasting methodology used can be summarised in the following steps:
uprating income microdata to account for changes in financial variables such as growth in average wages
implementing changes to cash benefits and direct taxes resulting from changes to rates, thresholds etc.
implementing changes to cash benefits and direct taxes resulting from more structural policy reforms
adjusting for changes to labour market participation and the demographic structure of the population through calibration weighting
Data sources
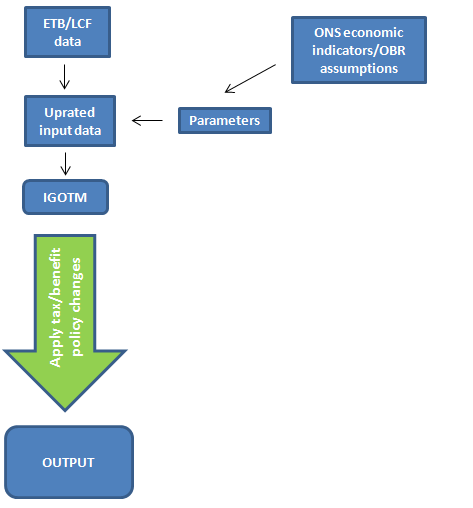
The nowcast data is built upon the Intra-Governmental Tax and Benefit Model (IGOTM). This is a microsimulation model of the UK tax and benefits system which allows for explicitly simulating the entire income distribution and for estimating the impact of tax and benefit changes that directly affect household incomes. IGOTM is maintained by HM Treasury, using our data. It applies the rules of the current system to a large sample of household data to calculate net incomes after taxes and benefits.
The input data for IGOTM comes from the Living Costs and Food Survey (LCF) and The effects of taxes and benefits on household income (ETB), which provide information on income, expenditure and important family characteristics. In order to improve precision of the estimates, the input dataset for IGOTM combines 3 years’ worth of data (2011/12, 2012/13 and 2013/14).
Detailed methodology
Uprating financial variables
The first step of the nowcasting process is to uprate the base dataset that feeds into IGOTM to values for the year for which nowcast estimates are being produced. Different income sources are uprated by different factors, using published series produced by ourselves and others for periods where actual data are available. The Office for Budget Responsibility (OBR) average earnings and inflation forecasts are used in IGOTM for later periods.
Earnings data are uprated forward to reflect the financial year being modelled, using historical Annual Survey of Hours and Earnings (ASHE) data on earnings growth at different points across the distribution as well as the latest average earnings estimates from National Accounts.
Other financial variables are uprated in the following way1:
income from self-employment, incomes from odd jobs and private sector rents are uprated in line with average earnings
incomes from private pensions and annuities are uprated in line with growth in pension income at the individual level from ETB for those years where data are available
incomes from other miscellaneous sources are uprated in line with the Retail Price Index (RPI)
incomes from the main government benefits are uprated in line with the Consumer Price Index (CPI), or other values as appropriate
Implementing policy changes
Once the relevant parameters are uprated and the new input dataset is created, it is run through IGOTM where a new costing is produced. For each individual case, the rules of the current tax and benefit system for the year being nowcast for are applied. The model then calculates how much individual direct and indirect taxes are due and what level of benefits and tax credits would be received in that year. These rules are applied at either the individual, family (benefit unit) or household level as appropriate. Some of the main tax and benefit changes occurring during 2015/16 included:
Child tax and working tax credits
The basic element of Working Tax Credit (WTC) rose by £20 (around 1%) to £1,960 a year. The family element of Child Tax Credit (CTC) was frozen at £545 a year, while the child element rose by £30 (around 1%) to £2,780.
Benefit uprating
Benefits for working age people, including Universal Credit, Jobseeker’s Allowance and Income Support were increased by 1% in April 2015. Benefits received by disabled people and pensioners (including Personal Independence Payment, Attendance Allowance and Incapacity Benefit) were increased by 1.2%. The State Pension was also increased by 2.5% due to the “triple lock” which guarantees to increase the basic State Pension by the higher of CPI inflation, average earnings or a minimum of 2.5% every year.
Personal independence payment
The roll-out of Personal Independence Payment (PIP) continued and the final phase rollout was brought forward from October to July 2015. PIP is replacing Disability Living Allowance (DLA) for adults aged under 65 in England, Wales & Scotland. PIP is made up of 2 components and is paid at a standard and enhanced rate which both increased by 1.2% in 2015/16. Eligibility for PIP is assessed using different criteria than for DLA. The assessment for PIP includes a review of an individual’s ability to participate fully in society rather than being based on the severity of impairment. All new claimants were assessed for PIP from June 2013.
Child benefit
The rate for a first child rose by £0.20 (around 1%) to £20.70, while the rate for second & subsequent children rose by £0.15 (around 1%) to £13.70 per week. Guardian’s Allowance increased by £0.20 per week to £16.75.
Income tax
For the first time since the decision to phase out age-related personal allowances, those born between 6 April 1938 and 5 April 1948 received the same tax-free personal allowance as those born after 5 April 1948, increasing to £10,600 for both groups. There was no change to the personal allowance for those born before 6 April 1938, which stayed at £10,660. There was a reduction in the higher rate band for income tax from £31,866 to £31,786. Combined with the personal allowance, this meant that people paid the higher rate of 40% on any taxable income above £42,385, up from £41,865 in 2014/15.
Council tax
The average band D dwelling Council Tax set by local authorities in England for 2015/16 was £1,484, an increase of £16 or 1.1% on 2014/15. Council Tax levels were frozen in all local authorities in Scotland. However, in Wales, the average band D Council Tax increased by 4.1% compared with 2014/15.
The model assumes incomplete take-up of benefits and tax credits.
Figure 1 provides a summary of the IGOTM process.
Figure 1: Intra-Governmental Tax and Benefit Model (IGOTM) process
Download this image Figure 1: Intra-Governmental Tax and Benefit Model (IGOTM) process
.png (11.2 kB)
Although very similar, the income measures produced through IGOTM are not conceptually identical to those used by ONS for its ETB publication. Therefore, where appropriate and possible, further adjustments are made to align the definition of income measures in IGOTM with those from ETB. (For example, including the value of employer benefits in-kind such as company cars).
Accounting for labour market and demographic changes
As a static micro-simulation model, IGOTM does not take account of any possible behavioural responses to policy changes or make adjustments for demographic changes. It assumes, for example, that the supply of labour is unchanged in response to changes in benefit entitlement. We have chosen to re-calibrate the original ETB weights to account for shifts in labour market participation and demographic characteristics of the UK population between the period when the LCF data were collected and the period for which nowcasts are being produced.
For the main ETB dataset and publication, each household in the microdata is initially given a design weight to account for the probability of selection in the sample. These weights are then adjusted to reduce bias from non-response and the sample distribution is calibrated to match the population distribution in terms of region, age group and sex. The method also involves treatment of income outliers.
In order to ensure consistency between the nowcasts and the actual data, it is desirable for the non-response adjusted design weights to be calibrated using new population totals matching those used for the original weights. Hence, the re-calibrated weights are calculated using the same calibration variables as the original ETB weights, along with an additional calibration constraint – economic status.
This allows the incorporation of labour market changes in the analysis. Income outliers are then treated in the same way as for ETB. Under the version of the nowcasting methodology presented in this paper, individuals were grouped into 12 categories according to their economic status. More details are available in the Technical Annex of this publication.
Population totals for this additional calibration constraint are based on estimates coming directly from the Annual Population Survey (APS), as opposed to the regional, age group and sex population controls, projections for which are taken from the most recent census and updated annually by birth and death counts, as well as by immigration estimates coming from the International Passenger Survey (IPS). As the economic status estimates and employment and unemployment rates are drawn from a sample survey (albeit one with a very large sample) the level of precision will be lower. Nevertheless, including this additional calibration constraint is important as changes in levels and patterns of labour market participation are likely to be a key driver in changes to household incomes.
The full list of population totals used for calibration is presented in the Technical Annex. In conjunction with the uprating and simulation of policy changes, this process enables us to create a “synthetic” population for the relevant year.
Arriving at nowcast estimates for 2015/16
To arrive at nowcast estimates of the indicators of interest, the relevant nowcasts for 2014/15 and 2015/16 are produced separately. The growth rate between the 2 nowcasts is then applied to published 2014/15 estimates from the latest ETB release. The advantage of focusing on the size and direction of change rather than the level of the indicators has to do with the uncertainty around the nowcast estimates. Nowcasts of direction and scale of change are likely to be more reliable than point estimates for a given year (Goedeme, 2010). Confidence intervals for the point estimates for 2014/15 and 2015/16 have been produced and are included in the accompanying statistical bulletin and have been used in informing the statistical commentary. Our methodology for assessing the uncertainty associated with these estimates is still under development, and it is hoped that in future iterations, it will be possible to produce confidence intervals associated with the level of change between the 2 estimates.
More generally, these new statistics are experimental and we will continue to assess quality against other data sources. It is likely that the methodology will continue to be revised and enhanced over time and if any substantive changes are made, revised versions of this paper will be produced.
Comparability between nowcast estimates
Even though every effort is made to ensure consistency and comparability between each 2 consecutive nowcast estimates, this is not always possible due to constant methodological improvement. HM Treasury conducts an ongoing programme of developing IGOTM, which results in frequent changes in methodology. In 2015/16, the method used to calculate housing benefit was significantly improved and as a result the 2015/16 figure for housing benefit is not directly comparable to the previous year’s figure.
In addition, there was a large increase in income from dividends between 2014/15 and 2015/16. This may be related to changes to the taxation of dividend income, the timing of which individuals have more control over. In 2013/14, the dividend tax rate was lowered to 45%, which may have prompted individuals with high incomes to transfer dividend income into 2013/14. A subsequent increase to all rates of dividend tax in 2016/17 may have prompted the transfer of dividend income to earlier in 2016 to avoid higher tax rates.
The effect of changing levels of dividend income, combined with the difference in housing benefit from last year, may have caused the difference in gross income between 2014/15 and 2015/16 to be artificially inflated. However, since the absolute values of both housing benefits and income from dividends are relatively small, it is not anticipated to have a large impact on gross income overall.
Notes for Methodology
- For a full table with uprating factors see Technical Annex.
4. Technical Annex
Variable uprating
Most of the variables are updated before the Intra-Governmental Tax and Benefit Model (IGOTM) is run, with the exception of household consumption and expenditure on fuel and power, which are uprated in IGOTM itself. The variables to be uprated are grouped into 12 categories, resulting in 12 different sets of uprating variables. These are shown in Table 1 below.
Table 1: Uprating sources
| Variable uprated | Series used |
| Income from employment, self-employment, odd jobs | Average earnings1 |
| Income from annuities, private pensions and other income sources | RPI |
| Income from banks and building society interest | RDEP2 |
| Income from dividends | NDIVHH3 |
| Private sector rent and rental income | Average Earnings |
| Income from main government benefits | CPI |
| Income from other government benefits (including JSA) | CPI |
| Statutory sick pay | Statutory Sick Pay rates |
| Mortgage interest | LHP; RMORT; number outstanding mortgages; interest payment per mortgage per year4 |
| Registered social landlords | RPI |
| Local authority rents (before rebates) | RPI |
| Water Rates | Average water bill5 |
| Source: Office for National Statistics | |
| Notes: | |
| 1. Average earnings = Source: Office for National Statistics. Wages and salaries (Office for National Statistics UK Economic Accounts, Office for National Statistics identifier: DTWM-ROYK) divided by employees (Office for National Statistics Labour Market Statistics, Office for National Statistics identifier: MGRZ-MGRQ) | |
| 2. Deposit rates ("RDEP") = Source: Bank of England. Weighted average rates for sight deposits (Bankstats code: CFMHSCV) and time deposits (Bankstats code: CFMHSCW). | |
| 3. Dividend receipts of households ("NDIVHH") = Source: Office for National Statistics, UK Economic Accounts Office for National Statistics identifier: NRKU | |
| 4. Mortgage debt ("LHP" )= Source: Office for National Statistics. Secured debt on dwellings (Office for National Statistics UK Economic Accounts, Office for National Statistics identifier: NNRP); Mortgage rates ("RMORT") - Average interest rate on mortgages (Source: Bank of England; Bankstats code: CFMHSDE) | |
| 5. Average water bills are projected forward using price limits set by OfWat | |
Download this table Table 1: Uprating sources
.xls (28.2 kB)Re-weighting
As a standard procedure across the majority of our surveys, the LCF is calibrated to known population totals for region and age/sex groups. These population totals come directly from projections taken from the most recent census, which are constantly updated with information derived from birth and death counts, migration rates and immigration counts.
The LCF data is weighted at household level, where the design weights represent the inverse probability of selection of a household. The weights are then adjusted to reduce bias from non-response, using scaling factors developed from information taken from the Census Non-Response Link Study (CNRLS). These design weights are then fed into the Generalized Estimation System (GES), which adjusts the weights of each household, using information on the region of the household and the age and sex of household members (the latter often gathered by proxy). This calibration process uses known information to improve representativeness of the estimates across these groups. Re-calibration of the existing weights involves using updated control totals and an additional constraint – economic status.
The new weights are calibrated to the population totals of the following Sex/Age groups:
Male/ female 0 to 15
Male 16 to 19
Male 20 to 24
Male 25 to 29
Male 30 to 44
Male 45 to 54
Male 55 to 64
Male 65 to 74
Male over 75
Female 16 to 19
Female 20 to 24
Female 25 to 29
Female 30 to 59
Female 60 to 69
Female 70 to 79
Female over 80
The following 12 regions:
North East
North West
Merseyside
Yorkshire & Humberside
East Midlands
West Midlands
Eastern London
South East
South West
Wales
Scotland
Northern Ireland
And the following employment groups:
Self-employed with children
Self employed without children
Full-time employed with children
Full-time employed without children
Part-time employed with children
Part-time employed without children
Unemployed and work-related government training programmes with children
Unemployed and work-related government training programmes without children
Retired or unoccupied and of the minimum National Insurance (NI) Pension age and retired or unoccupied and below the minimum NI Pension age with children
Retired or unoccupied and of the minimum NI Pension age and retired or unoccupied and below the minimum NI Pension age without children
Women between 60 and 64 in employment
Under 16