1. Main points
The provisional estimate of median household disposable income for financial year ending (FYE) 2017 is £27,200, an increase of 1.8% compared with FYE 2016 (£26,700) after accounting for inflation and household composition; this is 5.7% (£1,500) higher than its pre-economic downturn value of £25,700 in FYE 2008.
Median income for retired households continued to increase following the economic downturn and provisional estimates for FYE 2017 suggest it is now £22,400, which is 14.9% higher in real terms than in FYE 2008 (£19,500).
By contrast, the provisional FYE 2017 results indicate that the value of median income for non-retired households is £29,300, which is similar to levels seen in FYE 2008 (£29,200).
Early estimates of income inequality in FYE 2017 are broadly unchanged from those for the previous financial year.
2. Things you need to know about this release
To properly understand changes in households' material living conditions, it is important to have measures that reflect the experience of the typical household, such as median household disposable income, as well as other indicators that can also provide a description of the income distribution.
However, the complexities involved in collecting, processing and analysing household financial survey data mean such indicators are typically only available with a significant time lag. To meet the considerable user demand for more timely data on household incomes, we have developed this set of Experimental Statistics, produced using so-called “nowcasting” techniques.
Nowcasting is an increasingly popular approach for providing initial estimates of household income indicators. Unlike forecasting, which relies heavily on projections and assumptions about the future economic situation, nowcasting makes use of data that are already available for the period of study.
Although, at the time of producing these statistics, detailed survey data on household incomes are not yet available for financial year ending (FYE) 2017, a lot is known about various individual components of household income, as well as other factors that affect them. This information includes data on earnings, employment and inflation, as well as details of how changes to the tax and benefits system affect different types of households and individuals. This information is used to adjust income survey data for recent years to reflect the current period. This technique allows the publication of estimates for measures such as median disposable income far earlier than was previously possible.
Nowcast estimates will not perfectly reflect changes in the distribution of income, particularly when examining smaller sub-groups of the population, so the estimates should be treated as providing an early indication of what the full survey-based data may show when they are available in 2018.
The methodology used in this bulletin has undergone significant testing and benefited from having a range of external experts to ensure it is as robust as possible. As Experimental Statistics, the content of this bulletin and the methodology behind it will continue to be evaluated to ensure that user needs are met.
All measures of household income for the UK given in this article are calculated without taking into account housing costs. The measures have been deflated to FYE 2017 prices using the Consumer Prices Index including owner occupiers’ housing costs (CPIH), excluding Council Tax, to give a better comparison of households’ standards of living. These deflated measures are referred to as “real” in this publication. This contrasts with “nominal” measures, which have not been deflated.
The nowcasting household income publication requires a deflator that dates back to 1977. The CPIH, excluding Council Tax, is currently available from January 2005. The Consumer Prices Index (CPI) dates back to 1996, but a modelled historical series is available dating back to 1950. For this analysis, the owner occupiers’ housing costs (OOH) component was estimated using the actual rental series available from the Retail Prices Index (RPI). The OOH component was factored into the CPI (and modelled CPI prior to 1996) using the average OOH weight. Prior to 2005 this series is experimental.
Disposable income is the amount of money that households have available for spending and saving after direct taxes (such as Income Tax and Council Tax) have been accounted for. It includes earnings from employment, private pensions and investments, as well as cash benefits provided by the state.
The median household income is the income of what would be the middle household, if all households in the UK were sorted in a list from poorest to richest. As it represents the middle of the income distribution, the median household income provides a good indication of the standard of living of the “typical” household in terms of income.
A retired person is defined as anyone who describes themselves (in the Living Costs and Food Survey) as “retired” or anyone over minimum State Pension age describing themselves as “unoccupied” or “sick or injured but not intending to seek work”. A retired household is defined as one where the combined income of retired members amounts to at least half the total gross income of the household.
Nôl i'r tabl cynnwys3. Trends in household incomes
This section presents the provisional, “nowcast” estimates for financial year ending (FYE) 20171 in the context of longer-term trends in household income. Based on these provisional estimates, the median household disposable income was £27,200 in FYE 2017, which was 1.8% higher than the figure recorded in FYE 2016 (£26,700). After taking account of inflation2 and changes in household composition over time, this figure is £1,500 (5.7%) higher than its pre-economic downturn level of £25,700 in FYE 2008.
Median household income declined after the start of the economic downturn and by FYE 2013, median income was 4.5% (£1,200) lower in real terms than in FYE 2010. However, since FYE 2013 there has been a real terms increase, with the provisional FYE 2017 figure indicating it is now around 11% higher than in FYE 2013 (Figure 1).
Figure 1: Index of mean and median equivalised household disposable income
UK, 1977 to financial year ending 2017
Source: Office for National Statistics
Notes:
Indices are calculated relative to 1977 values
1994/95 represents the financial year ending 1995 (April 1994 to March 1995), and similarly through to 2016/17, which represents the financial year ending 2017 (April 2016 to March 2017).
Income figures have been deflated to 2016/17 prices using our Consumer Prices Index, which includes owner occupiers’ housing costs (CPIH).
Income is equivalised using the modified-OECD scale.
Results for 2016/17 are provisional.
Download this chart Figure 1: Index of mean and median equivalised household disposable income
Image .csv .xlsThere has been a broadly similar pattern of growth in mean household income, with a provisional estimate for FYE 2017 of £32,200, which is 1.2% higher than in FYE 2016 (£31,900) and up from £30,200 in FYE 2013. An important factor contributing to the growth in average disposable incomes has been rising income from employment. Average earnings grew in real terms in FYE 2017, which, combined with the continued growth in employment rates, meant that this effect was felt strongly in household incomes.
Taking a longer-term perspective, median disposable income is estimated to be over twice (2.2 times) as high in FYE 2017 than in 1977, growing from £12,500 in 1977 at an average rate of 2.0% per year. Over the same period, mean household income is estimated to have increased at a faster rate than the median measure, growing at an average annual rate of 2.2% from £14,100 to £32,200. The faster growth of the mean measure is primarily due to incomes of high-income households growing at a faster rate than for households in the middle and lower parts of the income distribution between 1977 and 1990.
Figure 2 shows the growth of median household incomes for all households as well as retired and non-retired households. For both retired and non-retired households, the provisional estimates for FYE 2017 show that the value of median disposable income has increased since its recent low in FYE 2013, after taking account of inflation and changes in household composition over time.
The pattern of change since the start of the economic downturn has been very different for retired and non-retired households. While incomes of non-retired households remained higher than those of retired households in FYE 2017, the growth paths between retired and non-retired household income has continued to differ since FYE 2008.
Between FYE 2008 and FYE 2013, the income of non-retired households decreased (£29,200 to £27,000) while retired household income increased (£19,500 to £20,300). In addition, since FYE 2013 the value of the median for retired households has grown at a faster average annual rate (1.6%) than for non-retired households (1.2%).
Figure 2: Index of median equivalised household disposable income by household type
UK, 1977 to financial year ending 2017
Source: Office for National Statistics
Notes:
Indices are calculated relative to 1977 values.
1994/95 represents the financial year ending 1995 (April 1994 to March 1995), and similarly through to 2016/17, which represents the financial year ending 2017 (April 2016 to March 2017).
Income figures have been deflated to 2016/17 prices using our Consumer Prices Index which includes owner occupiers’ housing costs (CPIH).
Income is equivalised using the modified-OECD scale.
Results for 2016/17 are provisional.
Download this chart Figure 2: Index of median equivalised household disposable income by household type
Image .csv .xlsSimilar patterns for retired and non-retired households are also observed in the value of mean disposable income. Since FYE 2013, the value of the mean disposable income has grown at a faster average annual rate for retired households (2.2%) than for non-retired households (1.0%).
A number of factors have driven the consistent growth in the incomes of retired households since FYE 2008. One factor is a rise in the number of households reporting receipts from private pensions or annuities; and another is an increase in average income from the State Pension, due in part to the effect of the “triple lock”.
The fall in average disposable income for non-retired households after the economic downturn reflected a fall in income from employment (including self-employment). Similarly, it is earnings growth at the household level, in part due to rising employment levels, which has been the main driver of the most recent increases in average income for non-retired households.
Notes for: Trends in household incomes
Income figures have been deflated to financial year ending 2017 prices using our Consumer Prices Index including owner occupiers’ housing costs (CPIH).
A mechanism currently used by the government, the “triple lock” guarantees to increase the basic State Pension by the higher of inflation (as measured by the Consumer Prices Index), average earnings or a minimum of 2.5% every year.
4. Trends in income inequality
There are a number of different ways in which inequality of household income can be presented and summarised. Amongst them, the Gini coefficient is perhaps the most commonly used internationally. It ranges between 0 and 100, where 0 indicates that income is shared equally among all households and 100 indicates that one household has all the income. Therefore, the lower the value of the Gini coefficient, the more equally household income is distributed.
Looking at the results for all households (Figure 3), the 1980s were characterised by a large increase in inequality of disposable income, particularly during the second half of that decade. Following that rise, inequality of disposable income reduced slowly from 1990 until the mid-1990s, although it did not reverse the rise seen in the previous decade. In the late 1990s, income inequality rose slightly before falling once again in the early 2000s.
Figure 3: Gini coefficients of household equivalised disposable income by household type
UK, 1977 to financial year ending 2017
Source: Office for National Statistics
Notes:
On this figure 1994/95 represents the financial year ending 1995 (April 1994 to March 1995), and similarly through to 2016/17, which represents the financial year ending 2017 (April 2016 to March 2017).
Results for 2016/17 are provisional.
Download this chart Figure 3: Gini coefficients of household equivalised disposable income by household type
Image .csv .xlsIn recent years, there has been relatively little change in levels of income inequality. The provisional estimate for the Gini coefficient for all households disposable income in financial year ending (FYE) 2017 was 31.5%, broadly unchanged from FYE 2016 (31.6%). The longer-term trend for all and non-retired households has been a very gradual decline in inequality on this measure since FYE 2007.
Inequality of disposable income for retired households followed a similar trend until FYE 2010, but has diverged in recent years. The Gini coefficient for retired households increased significantly during the 1980s and peaked at 30.3% in 1991, and the broad trend had been downwards until FYE 2010. Since FYE 2010, inequality within retired households has been increasing, though changes remain small relative to increases seen throughout the 1980s.
The characteristics of the Gini coefficient make it particularly useful for making comparisons over time, between countries and before and after taxes and benefits. However, no indicator is completely without limitations and one drawback of the Gini is that, as a single summary indicator, it cannot distinguish between differently shaped income distributions. For that reason, it is useful to look at this index alongside other measures of inequality.
One such measure is the S80 and S20 ratio, which is the ratio of the total income received by the 20% of households with the highest income to that received by the 20% of households with the lowest income. Another related measure is the P90 and P10 ratio. This is the ratio of the income of the household at the bottom of the top decile to that of the household at the top of the bottom decile.
A recently developed inequality measure, the Palma ratio, takes the ratio of the income share of the richest 10% of households to that of the poorest 40% of households. The idea behind using the Palma ratio is that the middle 50% of households are likely to have a relatively stable share of income over time, and so isolating them should not lead to a substantial loss of information (Cobham and Sumner, 2013).
Together, these measures provide further evidence of how incomes are shared across households and how this is changing over time.
Figure 4: Index of Gini coefficient, S80-S20 ratio, P90-P10 ratio and Palma ratio for equivalised disposable income, all households
UK, 1977 to financial year ending 2017
Source: Office for National Statistics
Notes:
Indices are calculated relative to 1977 values.
1994/95 represents the financial year ending 1995, and similarly through to 2016/17, which represents the financial year ending 2017.
2016/17 results are provisional.
Download this chart Figure 4: Index of Gini coefficient, S80-S20 ratio, P90-P10 ratio and Palma ratio for equivalised disposable income, all households
Image .csv .xlsFigure 4 shows the pattern of change in each of these measures since 1977 for all households, using provisional figures based on nowcast estimates for FYE 2017. It shows that income inequality trends in the UK have been very similar on all four measures.
Some year-on-year movements may reflect survey volatility; however, inequality of disposable income increased in the late 1980s and, to a lesser extent, during the late 1990s, during periods of faster growth in income from employment, and fell in the early 1990s, during a period of slower growth in employment income.
Since the turn of the millennium, changes in income inequality have been relatively small compared with previous decades. In the early 2000s, income inequality fell. This was in part due to faster growth in income from earnings and self-employment income at the bottom end of the income distribution.
Policy changes, such as increases in the National Minimum Wage, increases in Tax Credit payments, and the increase in National Insurance contributions in FYE 2004 are also likely to have had an effect.
The most recent peak in income inequality was in FYE 2007 or FYE 2008 depending on the measure used. Since then, the broad trend has been one of gradual decline in levels of inequality on each of the measures.
Nôl i'r tabl cynnwys5. Economic context
In the financial year ending (FYE) 2017, real output in the UK economy increased 2.0% on the preceding 12 months, continuing a period of growth following the FYE 2009 economic downturn and at a faster pace than the FYE 2016 (1.6%). By the end of the period, the UK had recorded 17 quarters of consecutive economic growth. While aggregate real gross domestic product (GDP) surpassed its pre-downturn peak in Quarter 3 (July to Sept) 2013, GDP per head took until Quarter 3 (July to Sept) 2015 to overtake its pre-downturn peak.
The labour market continued to perform strongly in the FYE 2017. In the 3 months to March 2017, the headline employment rate was 74.8%, the highest quarterly figure since comparable records began in 1971. Over the same period, the unemployment rate was 4.6%, down from 5.1% for a year earlier and the lowest since 1975.
Other headline indicators in our May 2017 labour market release suggest the labour market has been performing strongly in recent months, which typically correlates with increasing nominal earnings growth. However, after increasing growth from mid-2016 to reach a recent peak of 2.7% in the 3 months to November 2016, nominal regular pay growth eased and stood at 1.8% in the 3 months to March 2017 (Figure 5).
Figure 5: Contributions to the growth of real regular pay: Consumer Prices Index including owner occupiers' housing costs (CPIH) inflation and the growth of average regular weekly earnings
UK, January 2008 to March 2017
Source: Office for National Statistics
Notes:
- The data for regular pay presents the 3 months on 3 months a year ago growth rate for the month at the end of the period (the final data are for January to March 2017).
Download this chart Figure 5: Contributions to the growth of real regular pay: Consumer Prices Index including owner occupiers' housing costs (CPIH) inflation and the growth of average regular weekly earnings
Image .csv .xlsThe rate of price inflation in the economy is also an important component that determines households’ real income growth. There was persistent low inflation in the FYE 2016, partly driven by a fall in oil prices. This low inflation combined with nominal pay increases has meant that real wages grew in the FYE 2016 as they did towards the end of the second half of the previous financial year, following several years of falling real wages after the economic downturn.
However, Figure 5 shows that in the FYE 2017, increases in inflation coupled with slower growth in nominal wages since the 3 months to November 2016 have seen real earnings growth turn negative in the 3 months to March 2017 (negative 0.4%). The last time real wage growth was negative was in the 3 months to September 2014 (negative 0.3%).
Figure 6: Measures of economic well-being: GDP per head and net national disposable Income per head, chained volume measure
UK, Quarter 1 (Jan to Mar) 2008 to Quarter 1 2017
Source: Office for National Statistics
Notes:
- Q1 refers to Quarter 1 (Jan to Mar) Q2 refers to Quarter 2 (Apr to June) Q3 refers to Quarter 3 (July to Sept) Q4 refers to Quarter 4 (Oct to Dec)
Download this chart Figure 6: Measures of economic well-being: GDP per head and net national disposable Income per head, chained volume measure
Image .csv .xlsFigure 6 presents two alternative measures of economic well-being – GDP per head and net national disposable income (NNDI) per head. NNDI per head makes two adjustments to GDP per head: it subtracts the consumption of capital – the wear and tear resulting from assets being used in production – from GDP, capturing the net value of production; and it includes a measure of net international investment income. While the two measures grew at broadly the same rate through much of 2014, their growth rates diverged in FYE 2016.
Between Quarter 1 (Jan to Mar) 2016 and Quarter 1 2017, growth in NNDI per head (4.3%) outpaced GDP per head (1.3%), which reflects differences in some of the more detailed developments in the UK economy. In particular, the improvement in NNDI per head over recent quarters is mainly driven by an increase in the income to UK residents from investments abroad. This means that the growth in income available to residents to spend or save is greater once cross-border flows are taken into account.
More detailed analysis on the contributions to growth in NNDI and the relationship with the balance of primary incomes was presented in Economic well-being: Quarter 4, Oct to Dec 2016.
Overall, these two measures compare relatively well with the strong growth observed in median household disposable income since FYE 2014, based on the effects of taxes and benefits on household income (ETB) and nowcast estimates. More recently, growth in median household income more closely resembles GDP per head growth rather than NNDI per head growth. This possibly reflects that the increases in income available to residents from investments abroad have not impacted greatly upon the household sector.
Nôl i'r tabl cynnwys6. Policy context: Changes to taxes and benefits in financial year ending 2017
This section summarises some of the main tax and benefit changes occurring during financial year ending (FYE) 2017, but is not intended to represent an exhaustive list.
Benefit freeze
Certain working-age benefits will be frozen at FYE 2016 cash values from FYE 2017 to FYE 2020. Benefits excluded from the freeze are: Disability Living Allowance; Personal Independence Payment; Employment and Support Allowance Support Group component; Carer benefits; Pension benefits; Maternity Allowance; Statutory Sick Pay; Statutory Maternity Pay; Statutory Paternity Pay; Statutory Shared Parental Pay; and Statutory Adoption Pay.
Benefit cap
A benefit cap in place in England, Scotland and Wales restricts the amount of certain benefits that a working-age household can receive. Any household receiving more than the cap has their Housing Benefit reduced to bring them back within the limit. This benefit cap was introduced in Northern Ireland from 31 May 2016 with “Welfare Supplementary Payments” paid to any households with children in who have their Housing Benefit reduced due to the cap.
From 7 November 2016, the benefit cap was reduced from £26,000 to £23,000 for households living in London and to £20,000 for those outside London.
Those in receipt of Guardian's Allowance, Carer's Allowance and the carer's element of Universal Credit are exempt from the benefit cap.
Housing Benefit
From May 2016 in England, Scotland and Wales, the family premium included in Housing Benefit (£17.45 per month) was removed for families making a new claim for Housing Benefit. The allowed period for Housing Benefit backdating also decreased from 6 months to 4 weeks. This was applied in Northern Ireland from 5 September 2016.
Universal Credit
During FYE 2017 the roll-out of Universal Credit continued.
In FYE 2016, the childcare costs element of Universal Credit paid 70% of registered childcare costs up to a monthly limit of £532.29 a month for one child or £912.50 for two or more children. From 11 April 2016, this increased to 85% of childcare costs up to a monthly limit of £646.35 for one child or £1,108.04 for two or more children.
From April 2016, Universal Credit work allowances reduced to £4,764 for those without housing costs, £2,304 for those with housing costs, and the allowance was removed altogether for non-disabled claimants without children.
From November 2016, Universal Credit is a qualifying benefit for the Healthy Start Food Vouchers scheme.
Tax Credits
From April 2016, the Tax Credit income rise disregard, which is the limit household income can increase in a tax year before it impacts the calculation of entitlement for that year, decreased from £5,000 to £2,500. The rate at which Tax Credit awards are reduced (known as the taper rate) increased from 41% to 48%.
Income Tax
In April 2016, the tax-free personal allowance, which is the amount you can earn before paying any Income Tax, increased from £10,600 to £11,000. The higher rate (40%) tax threshold increased from £42,385 to £43,000. The age-related personal allowance came to an end in FYE 2017.
Income Tax: abolition of the £8,500 threshold for benefits in kind
From April 2016, the £8,500 threshold that determines whether employees pay Income Tax on all of their benefits in kind (for example, Company Car) and expenses is abolished. Employers will have additional National Insurance contributions to pay on the benefits in kind and certain expenses provided to employees earning at a rate of less than £8,500 a year. There are exemptions for carers and ministers of religion.
Marriage Allowance
From April 2016, the Marriage Allowance increased from £1,060 to £1,100. This allowance enables those that are married or in a civil partnership to transfer a portion of their tax-free personal allowance to their partner, but only if both partners don’t pay more than the basic rate of Income Tax.
Personal savings allowance
From 6 April 2016, basic rate taxpayers can earn up to £1,000 in savings income tax-free. Higher rate taxpayers will be able to earn up to £500.
National Insurance
From 6 April 2016, individuals are no longer able to contract out of the additional State Pension (also known as second State Pension or SERPs). This allowed those paying into a pension scheme to pay a reduced rate of National Insurance (NI). Employees who previously qualified for a reduced rate would have seen an increase in their NI.
State Pension
The basic State Pension increased in line with the “triple guarantee” (or “triple lock”) that was introduced in FYE 2013. This ensures that it increases by the highest of the increase in earnings, price inflation (as measured by the Consumer Prices Index) or 2.5%. In FYE 2017, the annual earnings increase (2.9%) was the highest of these three benchmarks.
From April 2016, the basic State Pension increased by 2.9% from £115.95 to £119.30 per week.
The new single-tier State Pension launched on 6 April 2016 for people who reach pension age on or after 1 April 2016, to replace the basic State Pension and second State Pension. This consolidated the basic State Pension and additional State Pension into one single amount, paying up to £155.65 per week. The value paid for individuals may be less depending on recipients’ National Insurance contributions.
Industrial death benefit
In FYE 2017, Widow’s Pension higher rate increased from £115.95 per week to £119.30 and the lower rate increased from £34.79 per week to £35.79 per week.
Widower’s pension increased from £115.95 to £119.30 a week.
National Minimum Wage and National Living Wage
In April 2016 a new National Living Wage of £7.20 per hour was introduced for employees aged 25 and over. Workers under the age of 25 years continue to get the National Minimum Wage, which increased from October 2016.
Council Tax
The average Band D Council Tax set by local authorities in England for FYE 2017 is £1,530, which is an increase of £46 or 3.1% on the FYE 2016 figure of £1,484.
Average Band D Council Tax for Wales for FYE 2017 is £1,374, which is an increase of £41 or 3.7% on FYE 2016.
For FYE 2017, the regional rate in Northern Ireland increased by 1.7% on its FYE 2016 value.
Nôl i'r tabl cynnwys8. Quality and methodology
The input data for this analysis come from the Living Costs and Food Survey (LCF) and the effects of taxes and benefits on household income (ETB) dataset, which is derived from the LCF. Together, these provide information on income, expenditure and important family characteristics.
These data are first adjusted to reflect how changes in the macro-economic conditions have affected households at different points of the income distribution. The next step of the analysis involves applying the rules of the current tax and benefit system to the household level data to calculate disposable incomes for those households. Finally, adjustments are made to take into account changes in labour market participation and the socio-demographic characteristics of the population.
For this statistical bulletin, historical income data were used to estimate household income data for the financial year ending (FYE) 2016 and FYE 2017. The growth rate between the two nowcasts for measures such as equivalised disposable income was then applied to the published FYE 2016 estimates from the latest ETB release, published 25 April 2017. A more detailed description of the methodology is provided in the accompanying article, Nowcasting household income in the UK: Methodology, 2016.
The historical data in this article are based on the ETB series, produced by Office for National Statistics, which itself is derived from the LCF. This series has been chosen for this article due to its long time series and its use as the primary input for the Intra-Governmental Tax and Benefit Model (IGOTM) used for producing the FYE 2017 nowcast estimates.
Also, it allows the possibility of extending the work on nowcasting to indirect taxes and benefits in kind provided by the state. The period covered begins in 1977 because this is the year from which consistent data from the ETB series are available.
How do these estimates fit in with other official statistics on household incomes?
These experimental nowcast estimates have been developed to serve as early or provisional estimates of figures that are currently published in the effects of taxes and benefits on household income (ETB). When the survey-based ETB figures for FYE 2017 income are available in 2018 they will supersede these nowcast estimates. We will also use these survey-based figures to evaluate the accuracy of these nowcasts.
The figures published in this bulletin use exactly the same definition of disposable income used in the ETB, which in turn is consistent with the concepts set out in the second edition of the United Nations Economic Commission for Europe Canberra Handbook (UNECE, 2011); this sets out the main international standards in this area. Additionally, these estimates and ETB use the same primary data source, the Living Costs and Food Survey (LCF).
The Department for Work and Pensions (DWP) also publishes analysis each year, particularly focusing on the lower part of the household income distribution, in their publication Households below average income (HBAI). Due to HBAI being based on a larger survey, along with some methodological and conceptual differences, HBAI and ETB estimates for these figures can differ slightly from each other. Although historical trends are broadly similar across the two sources, these nowcasts use the ETB methodology and data source so may not reflect future changes in HBAI.
What are Experimental Statistics?
The UK Statistics Authority Code of Practice for Official Statistics defines Experimental Statistics as “new official statistics undergoing evaluation, which are published in order to involve users and stakeholders in their development and as a means to build in quality at an early stage.” The data contained within this release have undergone the same high levels of quality assurance as other official statistics. However, as Experimental Statistics, the methodology used to create them remains under development and may be revised following further evaluation. It is therefore recommended that this is taken into account when using the findings.
As with any other nowcast, the accuracy of these indicators will inevitably depend on many factors. Throughout the development work feeding into this bulletin, a variety of approaches have been tested to develop a robust methodology, and the experience of external experts has been used to make use of international best practice. Despite this, it is unrealistic to expect nowcast estimates to perfectly reflect changes in the distribution of income, particularly when examining smaller sub-groups of the population. This means that the final survey data may show different patterns of change for some groups. This is taken into account in the level of detail presented in this bulletin.
In line with the UK Statistics Authority’s statement on Assessment and Designation of Experimental Statistics, we will be carefully evaluating these new estimates against the Code of Practice for Official Statistics. This will include assessments of both the quality of the estimates themselves and the extent to which they meet user needs.
Accuracy and reliability of nowcast estimates
The nowcast estimates are subject to the same degree and types of statistical error as any other analysis based on survey data. In particular, as the LCF data are a sample survey, the estimates are subject to sampling error. Surveys gather information from a sample rather than from the whole population. The sample is designed carefully to allow for this, and to be as accurate as possible given practical limitations such as time and cost constraints, but results from sample surveys are always estimates, not precise figures. This means that they are subject to a margin of error, which can have an effect on how changes in the numbers should be interpreted, especially in the short-term. In practice, this means that small, short-term movements should be treated as indicative and considered alongside medium and long-term patterns in the series.
As well as sampling error, all statistics, including these nowcast estimates, are also subject to non-sampling error. Non-sampling error includes all sources of data error that are not a result of the way the sample is selected. There are a wide number of different types of potential non-sampling error, including coverage error, non-response and measurement error. It is not possible to provide a measure of non-sampling error.
Using micro-simulation and nowcasting techniques to estimate distribution of income provides an additional source of non-sampling error in the estimates due to, for instance, approximations in the simulation of tax benefit rules, adjustments for non-take up, uprating of financial parameters and socio-demographic characteristics to the simulation year or ignoring behavioural responses (see, for example, Sutherland et al., 2014). On the other hand, simulation can arguably improve the accuracy of results relative to survey-based estimates through simulating the exact rules of the tax and benefit system.
A 95% confidence interval is a range within which the true population would fall for 95% of the times the sample survey was repeated. It is a standard way of expressing the statistical uncertainty of a survey-based estimate. Estimates of the confidence intervals are provided in Table 6 from the reference table download.
The majority of figures in this release are based on equivalised disposable income. Equivalisation is the process of accounting for the fact that households with many members are likely to need a higher income to achieve the same standard of living as households with fewer members. Equivalisation takes into account the number of people living in the household and their ages, acknowledging that whilst a household with two people in it will need more money to sustain the same living standards as one with a single person, the two-person household is unlikely to need double the income. This analysis uses the modified-OECD equivalisation scale.
Equivalisation of disposable income

Source: Office for National Statistics
Download this image Equivalisation of disposable income
.png (45.6 kB)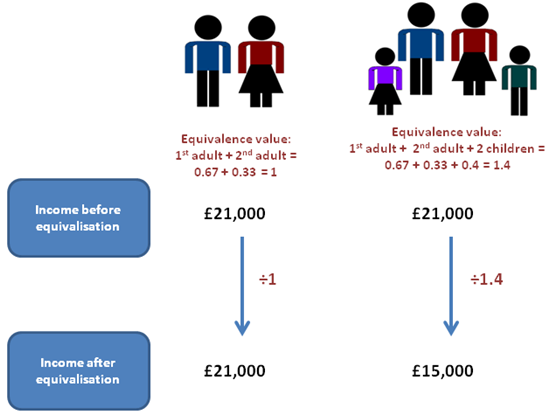
In measuring how living standards have changed over time, median household disposable income is widely regarded as one of the most important indicators. As it represents the middle of the income distribution, the median household income provides a good indication of the standard of living of the “typical” household in terms of income. However, it is also desirable to have information on the whole distribution of household income and analyse not only a typical household but also those towards the top and bottom of the income distribution.
A variety of inequality measures are calculated based on disposable income. Together, these measures provide evidence on how incomes are shared across households and how this is changing over time. However, an important limitation in using such measures as proxies for changes in material living standards is their lack of timeliness.
Unlike macro-economic indicators such as gross domestic product (GDP) per head or real household disposable income (RHDI), which are typically available within a few months, statistics on the distribution of income in the UK and other countries are typically produced to a much longer timetable, reflecting the complexity involved in collecting, processing and analysing household financial survey data. For example, our Effects of taxes and benefits on UK household income publication has historically been released in June, approximately 15 months after the end of the income reference period.
In February 2015, the UK Statistics Authority published their monitoring review on The Coherence and Accessibility of Official Statistics on Income and Earnings. In that report, they noted that users had said that “a 15-month lag in publishing key income and earnings statistics means that the relevance to decision-making is diminished almost before the statistics are released”. The Authority went on to recommend that “where data cannot be collected or compiled at the required frequency or timeliness, attempts to model or forecast/nowcast estimates should be considered”, and our current work exploring nowcasting of household income was warmly welcomed.
Nôl i'r tabl cynnwys9. Future plans for publication
In line with UK Statistics Authority guidance, we will carefully evaluate these statistics to determine future plans. Consideration will be given to the quality of the estimates possible through nowcasting and the extent to which estimates produced using such methods are able to meet user needs. This will inform any future plans for publication, including the frequency and level of detail provided.
Ahead of this evaluation, our current intention is to publish these provisional estimates on an annual basis, with the aim of publishing the next release based on the financial year ending 2018 in summer 2018.
Nôl i'r tabl cynnwys