Table of contents
- Main points
- Things you need to know about this release
- Why do we estimate cash measures of RHDI and the saving ratio?
- How do we estimate cash measures of RHDI and the saving ratio?
- RHDI fell by 0.1% on a cash basis, but grew 0.4% on a national accounts basis
- Impact of cash-based methodology on RHDI
- Cash basis saving ratio fell to 1.4% from 2.0% in the previous quarter; not historically low as opposed to the national accounts saving ratio
- Impact of cash-based methodology on the saving ratio
- Further information to understand the transactions removed from national account measures
1. Main points
- This latest release sees the introduction of a new cash-based household final consumption expenditure implied deflator to better reflect price changes observed by households.
- Real Household Disposable Income fell by 0.1% on a cash basis as a result of rising prices, quarter on quarter a year ago. In contrast, National Accounts RHDI grew 0.4%.
- The divergence in the growth of the two RHDI measures is attributed to higher interest paid by households on loans for the cash basis RHDI, as it includes imputed bank charges excluded in the National Accounts measure.
- Unlike the national accounts saving ratio, the cash basis saving ratio is not at historically low levels despite its fall to 1.4% in Quarter 3 (July to Sept) 2017 from 2.0% in the previous quarter.
- Household spending rose by 1% on a cash basis in Quarter 3 2017 compared with the previous quarter; faster than on a national accounts basis, which rose by 0.8%.
2. Things you need to know about this release
This article provides an update to data for the experimental Alternative measures of UK real household disposable income and the saving ratio: April to June 2017, which was published on 3 October 2017. These data estimate disposable income and the saving ratio less the transactions that are imputed and unobserved by households. Section 4 explains the removal of such transactions in greater detail.
This article compares experimental cash-based measures of real household disposable income (RHDI) and the saving ratio with the internationally comparable national accounts defined methodology as published in the Quarterly Sector Accounts on 22 December 2017.
In this latest iteration, RHDI is calculated by using a new cash-based deflator. Previously, gross disposable household income (GDHI) on a cash basis was deflated by using the national accounts household final consumption expenditure implied deflator. From this article onwards, the deflator used will be the national accounts household expenditure deflator less imputed rental and financial intermediation services indirectly measured (FISIM). This cash-based deflator will represent more closely price changes actually experienced by households.
This is an experimental product and we are continually reviewing the methodology used to produce the cash measures of real household disposable income (RHDI) and the saving ratio as well as how we present the product.
Following user feedback, we have added the time series (1997 onwards) of transactions removed from the national accounts measures of RHDI and the saving ratio in the Alternative measures of RHDI and saving ratio: Table 1. We hope this will make it easier for users to follow through the methodology using one single dataset.
We continue to welcome feedback from users about the future content of this article and publication tables and are particularly interested to know how you make use of these data to inform your work. Please email us at sector.accounts@ons.gov.uk.
Estimates within this release
This article includes new data for the latest available quarter, Quarter 3 (July to Sept) 2017. It also includes revisions from Quarter 1 (Jan to Mar) 2016 to Quarter 2 (Apr to June) 2017. These revisions reflect better or more complete source data and methodological improvements that have been introduced in line with the National Accounts Revisions Policy: updated December 2017.
Data within this article are estimated in current prices (also called nominal terms), except for RHDI, which is estimated by deflating gross disposable income using the cash-based household final consumption expenditure implied deflator. This cash-based deflator excludes the effect of price changes that are not directly experienced by households (that is imputed rentals of housing and FISIM) in order to better reflect the real purchasing power of households in terms of the quantity of goods and services they would be able to purchase if observed prices remained constant over time.
Current price series are expressed in terms of the prices during the time period being estimated. In other words, they describe the prices recorded at the time of production or consumption and include the effect of price inflation over time. RHDI, on the other hand, is a measure of the real purchasing power of households’ incomes and it enables users to make comparisons of households’ disposable income over time.
All data in this article are adjusted for seasonality, unless otherwise stated. Seasonal adjustment removes seasonal or calendar effects from data to enable more meaningful comparisons over time.
Back to table of contents3. Why do we estimate cash measures of RHDI and the saving ratio?
Estimates of real household disposable income (RHDI) and the saving ratio published in the Quarterly Sector Accounts include transactions that are not directly observed by households.
For example, imputed rental represents the value of housing services that owner-occupiers derive from their homes. This is the amount that they would have to pay in rental to achieve the same consumption of housing services. Whilst this concept is important when measuring economic activity and in like-for-like international comparisons, it is not expenditure (or income) directly observed by homeowners. As a result, the national accounts measure of RHDI can differ from the perceived experience of households.
We therefore consider “cash RHDI”. This measure removes imputed rental and other imputed transactions resulting in a measure of RHDI that is a closer representation of disposable income as measured by social surveys. This is mainly achieved by following guidance within the Organisation for Economic Co-operation and Development Framework for Statistics on the Distribution of Household Income, Consumption and Wealth and the United Nations Economic Commission for Europe (UNECE) Canberra Group Handbook on Household Income Statistics.
We also consider a “‘cash”’ saving ratio. This measure removes imputed transactions from the use of disposable income account. For example, imputed rental and financial intermediation services indirectly measured (FISIM) (both removed from the national accounts measure of final consumption expenditure) and the adjustment for the change in pension entitlements. Their removals result in a measure of gross saving that reflects household saving (excluding pension contributions) in a given quarter or year.
Back to table of contents4. How do we estimate cash measures of RHDI and the saving ratio?
To calculate gross disposable household income (GDHI), we have to work through the allocation of primary income account and secondary distribution of income account of the households sector, adding up all the resources and subtracting all the uses from the two accounts. To calculate GDHI on a cash basis, we exclude the imputed resources and uses in the allocation of primary income account and secondary distribution of income account.
There are 11 transactions that are included in the national accounts calculation of GDHI but excluded from the cash measure of GDHI. These are:
- B.2g (resource): Gross operating surplus
- D.12 (resource): Employers’ social contributions
- P.119 (resource): (Plus) Financial Intermediation Services Indirectly Measured (FISIM)
- D.442 (resource): Property income payable on pension entitlements
- D.4432 (resource): Investment income attributable to collective investment fund shareholders – retained earnings
- P.119 (use): (Less) Financial Intermediation Services Indirectly Measured (FISIM)
- D.612 (resource): Employers’ imputed social contributions
- D.72 (resource): Non-life insurance claims
- D.611 (use): Employers’ actual social contributions
- D.612 (use): Employers’ imputed social contributions
- D.614 (use): Households’ social contribution supplements
Within the national accounts, there are accounting identities, which mean that the values of some of the above transactions net to zero:
- Employers’ social contributions (D.12r) is equal and opposite to the sum of Employers’ actual social contributions (D.611u) and Employers’ imputed social contributions (D.612u)
- Income payable on pension entitlements (D.442r) is equal and opposite to Households’ social contributions supplements (D.614u)
Therefore, only the removal of the following six transactions explains the differences between GDHI on a cash basis and a national accounts basis:
- B.2g (resource): Gross operating surplus
- P.119 (resource): (Plus) Financial Intermediation Services Indirectly Measured (FISIM)
- D.4432 (resource): Investment income attributable to collective investment fund shareholders – retained earnings
- P.119 (use): (Less) Financial Intermediation Service Indirectly Measured (FISIM)
- D.612 (resource): Employers’ imputed social contributions
- D.72 (resource): Non-life insurance claims
Once we have calculated GDHI on a cash basis, we use the cash-based household final consumption expenditure implied deflator to remove the effect of price changes observed by households to calculate real household disposable income (RHDI) on a cash basis.
The saving ratio estimates the amount of money households have available to save (known as gross saving) as a percentage of their total disposable income (known as total available resources).
To calculate the saving ratio, we must first calculate gross saving. Within the national accounts, gross saving is calculated by subtracting final consumption expenditure from total available resources, where total available resources are the sum of GDHI and the adjustment for the change in pension entitlements. The adjustment for the change in pension entitlements is excluded from the cash-based measure of the saving ratio as it takes into account pension entitlements that are not accessed at that point in time. Therefore, on a cash basis, gross saving is calculated by subtracting final consumption expenditure on a cash basis from GDHI on a cash basis.
Final consumption expenditure on a cash basis is calculated by subtracting the following from the national accounts measure of final consumption expenditure, to ensure that we are removing imputed transactions consistently from both resources and uses where appropriate:
- imputed rental
- financial intermediation services indirectly measured (FISIM)
The saving ratio on a cash basis is then gross saving on a cash basis expressed as a percentage of GDI on a cash basis (which is equal to the cash measure of total available resources).
Back to table of contents5. RHDI fell by 0.1% on a cash basis, but grew 0.4% on a national accounts basis
In Quarter 3 (July to Sept) 2017, real household disposable income (RHDI) fell by 0.1% on a cash basis compared with the same quarter a year ago. This was mainly due to inflation having a negative contribution of 2.5 percentage points on RHDI growth. This more than offset the positive contribution of wages and salaries of 2.4 percentage points, as seen in Figure 1. Since Quarter 1 (Jan to Mar) 2016, the impact of inflation on RHDI has gradually increased while the impact of net property income (for example, net income from dividends, interest received on deposits and interest paid on loans) has become negligible.
Figure 1: Contributions to quarter-on-same-quarter-a-year-ago growth rate in cash basis Real Household Disposable Income, percentage (%)
Source: Office for National Statistics
Notes:
- Sum of components may not equal to the growth rate of cash basis real household disposable income due to rounding.
- Q1 refers to Quarter 1 (Jan to Mar), Q2 refers to Quarter 2 (Apr to June), Q3 refers to Quarter 3 (July to Sept) and Q4 refers to Quarter 4 (Oct to Dec).
Download this chart Figure 1: Contributions to quarter-on-same-quarter-a-year-ago growth rate in cash basis Real Household Disposable Income, percentage (%)
Image .csv .xlsCompared with the previous quarter, RHDI also fell by 0.1% on a cash basis in Quarter 3 2017. The rise in inflation and taxes on income were the main contributors to this squeeze in incomes, partly offset by a rise in wages and salaries and an increase in income generated through dividends.
The negative growth of RHDI on a cash basis implies that, after the removal of transactions not directly observed by households, households had less to spend in the latest quarter compared with both the previous quarter and the same quarter a year ago.
This is in contrast to the positive growth of RHDI as published in the Quarterly Sector Accounts, which implies that households had more to spend. In the latest quarter, the growth rate of RHDI on a national accounts basis quarter on previous quarter was 0.2%, and 0.4% quarter on same quarter a year ago as seen in Figure 2.
The difference between the two RHDI growth rates, quarter on quarter a year ago, stems mainly from the inclusion and increase of imputed bank charges (also known as financial intermediation services indirectly measured (FISIM) paid by households in the calculation of cash-based RHDI. In the national accounts, FISIM is subtracted from total interest paid by households for accounting reasons; the value of the charge is recorded as sales of services in the production accounts of financial institutions and as a use of disposable income in the accounts of their customers (for example, households). In summary, FISIM paid by households increased by £1.5 billion quarter on same quarter a year ago, and the inclusion of this transaction in the calculation of cash-based RHDI contributed negatively to cash-based RHDI growth. See Annex A for contributions to gross disposable household income on a national accounts basis by transactions excluded from the cash-based measure.
Figure 2: Comparison between Real Household Disposable Income on a cash basis and National Accounts basis, quarter on quarter a year ago growth rates
Quarter 1 (Jan to Mar) 1998 to Quarter 3 (July to Sept) 2017, UK
Source: Office for National Statistics
Notes:
- Q1 refers to Quarter 1 (Jan to Mar), Q2 refers to Quarter 2 (Apr to June), Q3 refers to Quarter 3 (July to Sept) and Q4 refers to Quarter 4 (Oct to Dec).
Download this chart Figure 2: Comparison between Real Household Disposable Income on a cash basis and National Accounts basis, quarter on quarter a year ago growth rates
Image .csv .xls6. Impact of cash-based methodology on RHDI
Up until this release, the differences between the two measures of real household disposable income (RHDI) were due to the transactions removed from gross disposable household income (GDHI). Annex A shows the nominal quarter on quarter a year ago contributions to national accounts GDHI by the removed transactions. The total value of these contributions is the nominal difference between national accounts GDHI and cash-based GDHI.
In addition, from this release onwards, the household final consumption expenditure (HHFCE) implied deflator used in the calculation of cash-based RHDI will no longer be that from the national accounts. It will now be on a cash basis following a simple method for the removal of imputed rentals and financial intermediation services indirectly measured (FISIM) to ensure consistency with the above methodology. The purpose of this change is to better represent price changes actually experienced by households.
Annex B and C show the effects from the removal of the two transactions in both the current price and chained volume measure form of HHFCE. Imputed rentals make up most of the difference between national accounts HHFCE and cash-based HHFCE.
The HHFCE implied deflator is formed by dividing its current price form by its chained volume measure form. Figure 3 shows the comparison between HHFCE implied deflator on a national accounts and HHFCE implied deflator on a cash basis.
Since Quarter 3 (July to Sept) 2014, the difference between the two deflators has been relatively small. The main contributor to the difference between the two deflators before Quarter 3 2014 is imputed rentals for housing. Although, during the economic downturn of 2008, the main contributor to the differences was the rise in financial intermediation services indirectly measured (FISIM) in current prices.
Figure 3: Real household final consumption expenditure implied deflators, index (reference year 2015), seasonally adjusted
Quarter 1 (Jan to Mar) 1997 to Quarter 3 (July to Sept) 2017, UK
Source: Office for National Statistics
Notes:
- Q1 refers to Quarter 1 (Jan to Mar), Q2 refers to Quarter 2 (Apr to June), Q3 refers to Quarter 3 (July to Sept) and Q4 refers to Quarter 4 (Oct to Dec).
Download this chart Figure 3: Real household final consumption expenditure implied deflators, index (reference year 2015), seasonally adjusted
Image .csv .xlsRevisions to real household disposable income
There were revisions to RHDI on a cash basis from Quarter 1 (Jan to Mar) 2016 and this was down to national accounts revisions (see National Accounts Revisions Policy) and the introduction of the cash basis HHFCE implied deflator. Revisions before Quarter 1 2016 are exclusively as a result of the change in the deflator, as demonstrated in the accompanying dataset Alternative measures of RHDI and saving ratio: Table 1 where a summary of revisions can be found, as well as the latest and previously published cash basis dataset.
Back to table of contents7. Cash basis saving ratio fell to 1.4% from 2.0% in the previous quarter; not historically low as opposed to the national accounts saving ratio
In contrast to the latest Quarterly Sector Accounts, which stated that the saving ratio had fallen to its joint third lowest rate in 20 years of 5.2%, the fall in the cash basis saving ratio in Quarter 3 (July to Sept) 2017 to 1.4% is not particularly low when compared with the last 20 years. Up until Quarter 4 (Oct to Dec) 2008, the cash basis saving ratio averaged at 0.7% and was often negative, as seen in Figure 4. A negative saving ratio implies that households are spending more than was earned in a given period.
The fall in the cash basis saving ratio to 1.4% in Quarter 3 2017 was due to household spending rising faster than gross household disposable income (GDHI). Spending rose by £2.5 billion while GDHI only increased by £0.9 billion. This meant that the amount available to save (gross savings) fell by £1.6 billion, and thus the fall in the cash basis saving ratio.
In percentage terms, household spending rose by 1% on a cash basis. This was faster than household spending on a national accounts basis where it grew by 0.8%. On a national accounts basis, spending rose by £2.6 billion while GDHI increased by £1.7 billion.
Figure 4: Household saving ratio (%), Seasonally adjusted
Quarter 1 (Jan to Mar) 1997 to Quarter 3 (July to Sept) 2017, UK
Source: Office for National Statistics
Notes:
- Q1 refers to Quarter 1 (Jan to Mar), Q2 refers to Quarter 2 (Apr to June), Q3 refers to Quarter 3 (July to Sept) and Q4 refers to Quarter 4 (Oct to Dec).
Download this chart Figure 4: Household saving ratio (%), Seasonally adjusted
Image .csv .xls8. Impact of cash-based methodology on the saving ratio
The difference between the national accounts saving ratio and the cash basis saving ratio is caused by the value of the transactions excluded from the calculation of gross disposable household income (see section 4 and Annex A) and the transactions removed from national accounts gross saving (see Annex D).
To visualise the transactions removed from national accounts gross saving, Annex D shows the contributions to the nominal differences between gross saving on a national accounts basis and gross saving on a cash basis since 1997.
Table 1 presents the changes in the values of transactions that are included in the calculation of the saving ratio on a national accounts basis, but are excluded from the saving ratio on a cash basis. The exclusion of these transactions (and the changes in the value of these transactions) explains the difference between the cash measure and national accounts measure of the saving ratio, in Quarter 3 (July to Sept) 2017.
The main contributor to the lower cash basis saving ratio is the increase in (and removal of) non-life insurance claims (£0.6 billion), the amount of financial intermediation services indirectly measured (FISIM) paid by households (£0.5 billion), and the fall in the adjustment for the change in pension entitlements (£0.6 billion).
Table 1: Change in the value of transactions removed from the national accounts methodology to calculate the cash measure of gross disposable household income and the saving ratio, Quarter 3 (July to Sept) 2017
| Transaction removed | CDID | Change, quarter on previous quarter, £ million | |
|---|---|---|---|
| Gross operating surplus (B.2g) | CAEO | -50 | |
| Employers’ social contributions* (D.12r) | DTWP | 103 | |
| (Plus) Financial Intermediation Services Indirectly Measured (FISIM) (P.119r) | CRNC | -315 | |
| Investment income payable on pension entitlements* (D.442r) | KZL5 | -137 | |
| Collective investment fund shareholders - Retained earnings (D.4432r) | MN7M | 18 | |
| (Less) Financial Intermediation Services Indirectly Measured (FISIM) (P.119u) | CRNB | 502 | |
| Employers’ imputed social contributions (D.612r) | L8RQ | -1 | |
| Non-life insurance claims (D.72r) | RNLU | 619 | |
| Employers’ actual social contributions* (D.611u) | L8NM | 178 | |
| Employers’ imputed social contributions* (D.612u) | MA4B | -75 | |
| Households’ social contribution supplements* (D.614u) | L8QA | -137 | |
| Adjustment for the change in pension entitlements (D.8r) | RNMB | -589 | |
| Imputed rental for housing (removed from final consumption expenditure on a cash basis) | GBFJ | 259 | |
| Financial Intermediation Services Indirectly Measured (FISIM) (removed from final consumption expenditure on a cash basis) | C68W | -174 | |
| Source: Office for National Statistics | |||
| Notes | |||
| 1. Changes in the value of transactions marked with an asterix (*) net to zero | |||
| 2. 'r' = resource, 'u' = uses, 'g' = gross | |||
Download this table Table 1: Change in the value of transactions removed from the national accounts methodology to calculate the cash measure of gross disposable household income and the saving ratio, Quarter 3 (July to Sept) 2017
.xls (28.7 kB)9. Further information to understand the transactions removed from national account measures
Within the national accounts there are accounting identities, which mean that changes in the value of some of the transactions presented in Table 1 net to zero. These transactions are marked with an asterisk (*).
For example, the value of employers’ social contributions is equal and opposite to the sum of employers’ actual social contributions and employers’ imputed social contributions. Likewise, property income payable on pension entitlements is equal and opposite to households’ social contributions. Therefore, the value of these transactions (and any changes in the value of these transactions between quarters) net to zero. Therefore, it is only the removal of the other transactions presented in Table 1 that explain the difference between the saving ratio on a cash basis and a national accounts basis.
Table 1 also contains four-character series identifiers (CDIDs) to enable users to further explore the data and methodology used.
The introduction of a cash-based household final consumption expenditure implied deflator does not affect the cash basis saving ratio as the household final consumption expenditure value used was already on a cash basis (that is, with imputed rentals and FISIM removed).
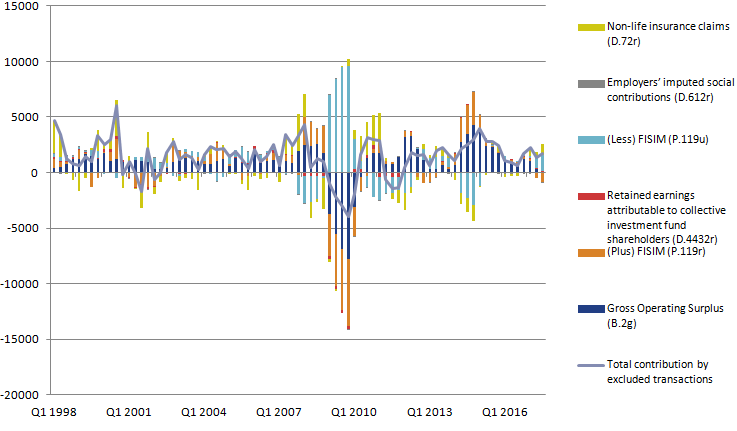
Annex A: Nominal contributions to gross disposable household income on a National Accounts basis by transactions excluded from the cash-based measure, quarter on quarter a year ago, £million, seasonally adjusted
Quarter 1 (Jan to Mar) 1998 to Quarter 3 (July to Sept) 2017, UK
Source: Office for National Statistics
Notes:
- Q1 refers to Quarter 1 (Jan to Mar), Q2 refers to Quarter 2 (Apr to June), Q3 refers to Quarter 3 (July to Sept) and Q4 refers to Quarter 4 (Oct to Dec).
Download this image Annex A: Nominal contributions to gross disposable household income on a National Accounts basis by transactions excluded from the cash-based measure, quarter on quarter a year ago, £million, seasonally adjusted
.png (26.6 kB) .xls (50.2 kB)
Annex B: Effects of removing transactions from household final consumption expenditure on a national accounts basis as per cash-based methodology
£million, Current Price, seasonally adjusted, Quarter 1 (Jan to Mar) 1997 to Quarter 3 (July to Sept) 2017, UK
Source: Office for National Statistics
Notes:
- Household final consumption expenditure, current price.
- Financial intermediation services indirectly measured.
- This series can also be interpreted as the Cash-based Household final consumption expenditure, current price.
- Q1 refers to Quarter 1 (Jan to Mar), Q2 refers to Quarter 2 (Apr to June), Q3 refers to Quarter 3 (July to Sept) and Q4 refers to Quarter 4 (Oct to Dec).
Download this chart Annex B: Effects of removing transactions from household final consumption expenditure on a national accounts basis as per cash-based methodology
Image .csv .xls
Annex C: Effects of removing transactions from household final consumption expenditure on a national accounts basis as per cash-based methodology
£million, Seaonally adjusted, Chained volume measure, Quarter 1 (Jan to Mar) 1997 to Quarter 3 (July to Sept) 2017, UK
Source: Office for National Statistics
Notes:
- Household final consumption expenditure, Chained volume measure.
- Financial intermediation services indirectly measured.
- This series can also be interpreted as the Cash-based Household final consumption expenditure, chained volume measure.
- Q1 refers to Quarter 1 (Jan to Mar), Q2 refers to Quarter 2 (Apr to June), Q3 refers to Quarter 3 (July to Sept) and Q4 refers to Quarter 4 (Oct to Dec).
Download this chart Annex C: Effects of removing transactions from household final consumption expenditure on a national accounts basis as per cash-based methodology
Image .csv .xls
Annex D: Contributions to the nominal difference between gross saving on a national accounts basis and cash basis, £million, Current Price, Seasonally adjusted
Quarter 1 (Jan to Mar) 1997 to Quarter 3 (July to Sept) 2017, UK
Source: Office for National Statistics
Notes:
- Household final consumption expenditure, current price.
- Financial intermediation services indirectly measured.
- Q1 refers to Quarter 1 (Jan to Mar), Q2 refers to Quarter 2 (Apr to June), Q3 refers to Quarter 3 (July to Sept) and Q4 refers to Quarter 4 (Oct to Dec).