Cynnwys
- Main points
- Things you need to know about this release
- Why do we estimate cash measures of real households and NPISH disposable income (RHDI) and the saving ratio?
- How do we estimate cash measures of real households and NPISH disposable income (RHDI) and the saving ratio?
- Real households and NPISH disposable income (RHDI) on a cash basis fell for the third consecutive quarter
- Why did RHDI on a cash basis fall by more than RHDI on a national accounts basis?
- The households and NPISH saving ratio on a cash basis fell to negative 4.8% in Quarter 1 2017
- The households and NPISH saving ratio on a cash basis fell by more than the national accounts saving ratio in Quarter 1 2017
- Why did the households and NPISH saving ratio on a cash basis fall by more than the national accounts households and NPISH saving ratio?
1. Main points
- Real households and non-profit institutions serving households (NPISH) disposable income (RHDI) on a cash basis decreased by 1.9% in Quarter 1 (Jan to Mar) 2017, following a decrease of 0.7% in Quarter 4 (Oct to Dec) 2016.
- This was the third consecutive quarter of falling RHDI on a cash basis, which is the same trend as RHDI on a national accounts basis.
- In Quarter 1 2017, the households and NPISH saving ratio on a cash basis fell to negative 4.8%, which implies that households and NPISH spent more than they earned in income during the quarter.
- This is the lowest quarterly saving ratio on a cash basis since Quarter 1 2008, when it was negative 6.7%.
- The fall in the saving ratio on a cash basis was mainly due to a rise in taxes on income and wealth; this was also the main contributor to the fall in the saving ratio on a national accounts basis.
- Between Quarter 4 2016 and Quarter 1 2017, the saving ratio fell by 2.6 percentage points on a cash basis compared with a fall of 1.6 percentage points on a national accounts basis; the saving ratio on a cash basis last fell by more in Quarter 1 2013, when it fell by 3.0 percentage points.
2. Things you need to know about this release
This article provides an update to data for the experimental Alternative measures of real households disposable income and the saving ratio: Mar 2017, which was published on 19 April 2017. These data estimate disposable income and the saving ratio less the transactions that are imputed and unobserved by households.
This article compares experimental cash-based measures of real households disposable income (RHDI) and the saving ratio with the internationally comparable national accounts defined methodology as published in the Quarterly Sector Accounts on 30 June 2017.
From 29 September 2017, the UK Economic Accounts will present separate estimates for the households sector and the non-profit institutions serving households (NPISH) sector. Currently, these two sectors are presented as though they are one sector, households and NPISH. Within this article, a separate estimate will be presented for households (for RHDI and the households saving ratio). This work is part of the scope of methodological improvements being introduced as part of the UK National Accounts, The Blue Book: 2017, due to be published on 31 October 2017.
On 5 June 2017, we published an article to inform you of the indicative impact to the main non-financial and financial accounts estimates being introduced when revised figures for the UK National Accounts are published on 29 September 2017. Within this article, we published an indicative households only “cash” saving ratio that shows the impact of removing NPISH data from the transactions included in the current “cash basis” methodology. We will publish an update on 21 August that will provide the indicative impact of changes up to 2015.
Until September 2017, this article continues to present combined estimates for the households and non-profit institutions serving households (NPISH) sectors as though they were one sector.
This is an experimental product and we are reviewing the methodology used to produce the cash measures of RHDI and the saving ratio. We welcome feedback from users about the future content of this article and publication tables and are particularly interested to know how you make use of these data to inform your work. Please email us at sector.accounts@ons.gov.uk.
Estimates within this release
This article includes new data for the latest available quarter, Quarter 1 (Jan to Mar) 2017; there are no revisions made to previously published data. This article follows the National Accounts revisions policy.
Data within this article are estimated in current prices (also called nominal terms), with the exception of real households and NPISH disposable income (RHDI), which is estimated by deflating gross disposable income using the households and NPISH final consumption expenditure implied deflator. This is to remove the effect of price inflation. Current price series are expressed in terms of the prices during the time period being estimated. In other words, they describe the prices recorded at the time of production or consumption and include the effect of price inflation over time. RHDI is a measure of the real purchasing power of households and NPISH incomes, in terms of the quantity of goods and services they would be able to purchase if prices remained constant over time. It enables users to make comparisons of households and NPISH disposable income over time.
All data in this article are adjusted for seasonality, unless otherwise stated. Seasonal adjustment removes seasonal or calendar effects from data to enable more meaningful comparisons over time.
Nôl i'r tabl cynnwys3. Why do we estimate cash measures of real households and NPISH disposable income (RHDI) and the saving ratio?
Estimates of real households and non-profit institutions serving households (NPISH) disposable income and the saving ratio published in the Quarterly Sector Accounts include transactions that are not directly observed by households.
For example, imputed rental represents the value of housing services that owner-occupiers derive from their homes. This is the amount that they would have to pay in rental to achieve the same consumption of housing services. Whilst this concept is important when measuring economic activity, it is not expenditure (or income) directly observed by homeowners. As a result, the national accounts measure of RHDI can differ from the perceived experience of households.
We therefore consider “cash RHDI”. This measure removes imputed rental and other imputed transactions resulting in a measure of RHDI that is a closer representation of disposable income as measured by social surveys. This is mainly achieved by following guidance within the Organisation for Economic Co-operation and Development Framework for Statistics on the Distribution of Households Income, Consumption and Wealth and the United Nations Economic Commission for Europe (UNECE) Canberra Group Handbook on Household Income Statistics.
We also consider a “cash” saving ratio. This measure removes imputed transactions from the use of disposable income account (the adjustment for the change in pension entitlements as well as imputed rental and financial intermediation services indirectly measured (FISIM) from the national accounts measure of final consumption expenditure). This results in a measure of gross saving that reflects households’ saving (excluding pension contributions) in the respective quarter or year.
Nôl i'r tabl cynnwys4. How do we estimate cash measures of real households and NPISH disposable income (RHDI) and the saving ratio?
To calculate gross disposable income (GDI), we have to work through the allocation of primary income account and secondary distribution of income account of the households and non-profit institutions serving households (NPISH) sector, adding up all the resources and subtracting all the uses from the two accounts. To calculate GDI on a cash basis, we exclude the imputed resources and uses in the allocation of primary income account and secondary distribution of income account from this calculation.
There are 11 transactions that are included in the national accounts calculation of GDI, but are excluded from the cash measure of GDI. These are:
- B.2g (resource) Gross operating surplus
- D.12 (resource) Employers’ social contributions
- P.119 (resource) (Plus) Financial intermediation services indirectly measured (FISIM)
- D.442 (resource) Property income payable on pension entitlements
- D.4432 (resource) Investment income attributable to collective investment fund shareholders - Retained earnings
- P.119 (use) (Less) Financial intermediation services indirectly measured (FISIM)
- D.612 (resource) Employers’ imputed social contributions
- D.72 (resource) Non-life insurance claims
- D.611 (use) Employers’ actual social contributions
- D.612 (use) Employers’ imputed social contributions
- D.614 (use) Households’ social contribution supplements
Within the national accounts, there are accounting identities which mean that the values of some of the above transactions net to zero:
- Employers’ social contributions (D.12r) is equal and opposite to the sum of Employers’ actual social contributions (D.611u) and Employers’ imputed social contributions (D.612u)
- Income payable on pension entitlements (D.442r) is equal and opposite to Households’ social contributions supplements (D.614u)
Therefore, only the removal of the following six transactions explains the differences between GDI on a cash basis and a national accounts basis:
- B.2g (resource) Gross operating surplus
- P.119 (resource) (Plus) Financial intermediation services indirectly measured (FISIM)
- D.4432 (resource) Investment income attributable to collective investment fund shareholders - Retained earnings
- P.119 (use) (Less) Financial intermediation service indirectly measured (FISIM)
- D.612 (resource) Employers’ imputed social contributions
- D.72 (resource) Non-life insurance claims
Once we have calculated GDI, we use the households and NPISH final consumption expenditure implied deflator to remove the effect of price changes to calculate real households and NPISH disposable income (RHDI).
The saving ratio estimates the amount of money households and NPISH have available to save (known as gross saving) as a percentage of their total disposable income (known as total available resources).
To calculate the saving ratio, we must first calculate gross saving. Within the national accounts, gross saving is calculated by subtracting final consumption expenditure from total available resources, where total available resources is the sum of GDI and the adjustment for the change in pension entitlements. The adjustment for the change in pension entitlements is excluded from the cash measure of the saving ratio. Therefore, on a cash basis, gross saving is calculated by subtracting final consumption expenditure on a cash basis from GDI on a cash basis.
Final consumption expenditure on a cash basis is calculated by subtracting the following from the national accounts measure of final consumption expenditure, to ensure that we are removing imputed transactions consistently from both resources and uses where appropriate: - imputed rental - financial intermediation services indirectly measured (FISIM)
The saving ratio on a cash basis is then gross saving on a cash basis expressed as a percentage of GDI on a cash basis (which is equal to the cash measure of total available resources).
Nôl i'r tabl cynnwys5. Real households and NPISH disposable income (RHDI) on a cash basis fell for the third consecutive quarter
Real households and NPISH disposable income (RHDI) on a cash basis fell by 1.9% in Quarter 1 (Jan to Mar) 2017, following a fall of 0.7% in Quarter 4 (Oct to Dec) 2016. This represents the largest quarterly fall in RHDI on a cash basis since Quarter 1 2013 when it fell by 2.9%. This also represents the third consecutive quarter of falling RHDI on a cash basis, which is the same trend as RHDI on a national accounts basis. This is the first time RHDI on a cash basis has fallen for three consecutive quarters since the beginning of the time series in Quarter 1 1997.
Figure 1: UK RHDI on a national accounts basis and RHDI on a cash basis, percentage change quarter on quarter
Quarter 1 (Jan to Mar) 2013 to Quarter 1 (Jan to Mar) 2017
Source: Office for National Statistics
Download this chart Figure 1: UK RHDI on a national accounts basis and RHDI on a cash basis, percentage change quarter on quarter
Image .csv .xlsThe fall in RHDI on a cash basis in Quarter 1 2017 was due to a fall in nominal gross disposable income (GDI) on a cash basis of 1.5% and a rise in the households and NPISH final consumption implied deflator of 0.5%.
This fall in nominal GDI on a cash basis was primarily due to a rise in taxes on income and wealth of £5.0 billion, and a fall in social benefits other than transfers in kind received of £0.9 billion. This was partially offset by a rise in wages and salaries of £1.2 billion.
The latest estimates for taxes on income and wealth may in part reflect timing issues, although there is evidence for increased taxes. For further detail about the increase in taxes on income and wealth paid by households and NPISH this quarter, please refer to the explanation in section 3 of the Quarterly Sector Accounts bulletin.
Compared with the same quarter a year ago, Quarter 1 2016, RHDI on a cash basis fell by 2.4%. This fall was mainly due to a rise in taxes on income and wealth of £3.8 billion, and falls in dividend income of £1.9 billion and social benefits other than transfers in kind received of £1.4 billion and other smaller changes, partially offset by a rise in wages and salaries of £6.9 billion. RHDI on a cash basis, when compared with the corresponding quarter of the previous year, last fell by more in Quarter 1 2011, when it fell by 3.2%.
Nôl i'r tabl cynnwys6. Why did RHDI on a cash basis fall by more than RHDI on a national accounts basis?
The fall in RHDI on a cash basis in Quarter 1 (Jan to Mar) 2017 of 1.9% was larger than the fall in RHDI on a national accounts basis of 1.4%. The difference between the two measures of RHDI is explained by the changes in the value of imputed transactions that are included in the calculation of GDI on a national accounts basis but excluded from GDI on a cash basis, deflated by the final consumption expenditure implied deflator.
Figure 2 presents the contributions to the:
- quarter-on-quarter change in RHDI on a national accounts basis
- quarter-on-quarter change in the value of the imputed transactions excluded from the calculation of RHDI on a cash basis
- quarter-on-quarter change in RHDI on a cash basis
Figure 2: Contributions to the quarter on quarter change in RHDI, the transactions excluded from RHDI on a cash basis and RHDI on a cash basis
Quarter 1 (Jan to Mar) 2017
Source: Office for National Statistics
Download this chart Figure 2: Contributions to the quarter on quarter change in RHDI, the transactions excluded from RHDI on a cash basis and RHDI on a cash basis
Image .csv .xlsThe larger fall in RHDI on a cash basis than RHDI on a national accounts basis was largely due to increases in net financial intermediation services indirectly measured (FISIM) and non-life insurance claims between Quarter 4 (Oct to Dec) 2016 and Quarter 1 2017.
Nôl i'r tabl cynnwys7. The households and NPISH saving ratio on a cash basis fell to negative 4.8% in Quarter 1 2017
The households and NPISH saving ratio fell to negative 4.8% in Quarter 1 (Jan to Mar) 2017 from negative 2.2% in Quarter 4 (Oct to Dec) 2016. This represents the lowest households and NPISH saving ratio on a cash basis since Quarter 1 2008, when it was negative 6.7%.
A negative saving ratio on cash basis implies that households and NPISH spent more than they have earned in income during the quarter.
The households and NPISH saving ratio on a cash basis was negative in every quarter between Quarter 1 2004 and Quarter 3 (July to Sept) 2008. The lowest households and NPISH saving ratio on a cash basis was in Quarter 1 2008, when it was negative 6.7%.
More recently, the households and NPISH saving ratio on a cash basis has been negative in 8 of the last 17 quarters since Quarter 1 2013 and has been negative for three consecutive quarters from Quarter 3 2016 to Quarter 1 2017.
Figure 3: UK saving ratio on a national accounts basis and on a cash basis
Quarter 1 (Jan to Mar) 1997 to Quarter 1 (Jan to Mar) 2017
Source: Office for National Statistics
Download this chart Figure 3: UK saving ratio on a national accounts basis and on a cash basis
Image .csv .xlsThe fall in the saving ratio on a cash basis in Quarter 1 2017 reflects a fall in total available resources on a cash basis of £3.8 billion and a rise in final consumption expenditure on a cash basis of £2.6 billion. This resulted in a fall in gross saving on a cash basis of £6.4 billion. This is the largest fall in gross saving on a cash basis since Quarter 1 2013, when it fell by £6.9 billion. In Quarter 1 2017, gross saving on a cash basis of negative £12.1 billion was the lowest since Quarter 1 2008, when it was negative £13.1 billion, and the second lowest since the beginning of the time series in Quarter 1 1997.
Figure 4 illustrates the relationship between total resources on a cash basis and final consumption on a cash basis. Gross saving (shown by the bars) is the residual of total resources on a cash basis when final consumption expenditure on a cash basis has been subtracted. The saving ratio on a cash basis is gross saving on a cash basis expressed as a proportion of total available resources on a cash basis. For comparison, a similar chart was included in the Quarterly Sector Accounts bulletin to illustrate the national accounts saving ratio.
Figure 4: UK saving ratio on a cash basis
Quarter 1 (Jan to Mar) 2005 to Quarter 1 (Jan to Mar) 2017
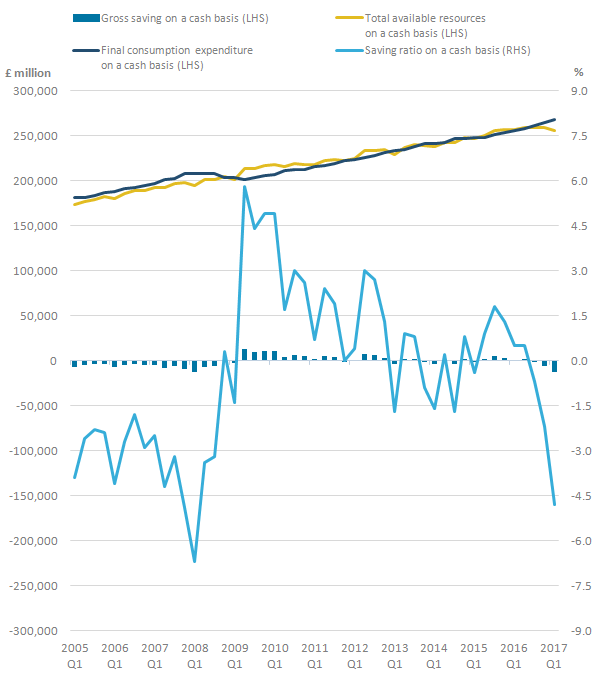
Source: Office for National Statistics
Download this image Figure 4: UK saving ratio on a cash basis
.png (34.1 kB) .xls (122.9 kB)
In Quarter 1 2017, the fall in total available resources on a cash basis was primarily due to a rise in taxes on income and wealth of £5.0 billion, and a fall in social benefits other than transfers in kind received of £0.9 billion. This was partially offset by a rise in wages and salaries of £1.2 billion. The rise in final consumption expenditure was mainly due to increases in spending on transport and restaurants and hotels.
Nôl i'r tabl cynnwys8. The households and NPISH saving ratio on a cash basis fell by more than the national accounts saving ratio in Quarter 1 2017
In Quarter 1 (Jan to Mar) 2017, the saving ratio on a cash basis of negative 4.8% was the lowest quarterly saving ratio on a cash basis since Quarter 1 2008, when it was negative 6.7%, and the third lowest since the beginning of the time series in Quarter 1 1997. The saving ratio on a national accounts basis fell to 1.7% in Quarter 1 2017 from 3.3% in Quarter 4 (Oct to Dec) 2016. This was the lowest saving quarterly saving ratio since comparable records began in 1963.
The fall in the saving ratio on a cash basis in Quarter 1 2017 of 2.6 percentage points was larger than the fall in the saving ratio on a national accounts basis of 1.6 percentage points. The difference in the magnitude of the falls in the saving ratio in Quarter 1 2017 reflects larger falls in gross saving and total available resources on a cash basis in Quarter 1 2017 than on a national accounts basis.
Nôl i'r tabl cynnwys9. Why did the households and NPISH saving ratio on a cash basis fall by more than the national accounts households and NPISH saving ratio?
An increase in the value of transactions excluded from the calculation of total available resources on a cash basis of £1.1 billion, partially offset by an increase in the value of transactions removed from final consumption expenditure of £0.2 billion, caused gross saving on a cash basis to fall by £1.0 billion more than gross saving on a national accounts basis.
Table 1 presents the changes in the values of the transactions that are included in the calculation of the saving ratio on a national accounts basis, but are excluded from the saving ratio on a cash basis. The exclusion of these transactions (and the changes in the value of these transactions) explains the differences between the cash measure and national accounts measure of the saving ratio.
Within the national accounts, there are accounting identities, which mean that changes in the value of some of the transactions presented in Table 1 net to zero. These transactions are marked with an asterisk (*).
For example, the value of employers’ social contributions is equal and opposite to the sum of employers’ actual social contributions and employers’ imputed social contributions. Likewise, property income payable on pension entitlements is equal and opposite to households’ social contributions. Therefore, the value of these transactions (and any changes in the value of these transactions between quarters) net to zero.
Therefore, it is only the removal of the other transactions presented in Table 1 that explain the difference between the saving ratio on a cash basis and a national accounts basis.
Table 1 also contains the four-letter series identifiers (CDIDs) that are presented in the accompanying dataset to this article to enable users to further explore the data and methodology used.
Table 1: Change in the value of transactions removed from the national accounts methodology to calculate the cash measure of gross disposable income and the saving ratio Quarter 1 (Jan to Mar) 2017
| £ million | |||
| Transaction removed | CDID | Change, quarter on previous quarter | |
| Gross operating surplus | CAEN | 193 | |
| D.12 (resource) Employers' social contributions* | ROYK | 350 | |
| P.119 (resource) (Plus) Financial Intermediation Services Indirectly Measured (FISIM) | IV8W | -516 | |
| D.442 (resource) Property income payable on pension entitlements* | L8HT | 892 | |
| D.4432 (resource) Investment income attributable to collective investment fund shareholders - Retained earnings | L8IG | -1 | |
| P.119 (use) (Less) Financial Intermediation Services Indirectly Measured (FISIM) | IV8X | 958 | |
| D.612 (resource) Employers' imputed social contributions | L8RG | 2 | |
| D.72 (resource) Non-life insurance claims | RPHN | 156 | |
| D.611 (use) Employers' actual social contributions* | L8NK | 657 | |
| D.612 (use) Employers' imputed social contributions* | M9XB | -307 | |
| D.614 (use) Households' social contribution supplements* | L8Q8 | 892 | |
| D.8 (resource) Adjustment for the change in pension entitlements | RPQJ | 336 | |
| Imputed rental for housing (removed from final consumption expenditure on a cash basis) | GBFJ | 377 | |
| Financial Intermediation Services Indirectly Measured (FISIM) (removed from final consumption expenditure on a cash basis) | C68W | -200 | |
| Source: Office for National Statistics | |||
| Notes: | |||
| 1. * denotes the transactions whose values net to 0 | |||
Download this table Table 1: Change in the value of transactions removed from the national accounts methodology to calculate the cash measure of gross disposable income and the saving ratio Quarter 1 (Jan to Mar) 2017
.xls (30.7 kB)In Quarter 1 (Jan to Mar) 2017, the value of the transactions excluded from the calculation of gross disposable income (GDI) on a cash basis increased by £0.8 billion. The largest contribution to this increase was a rise in net financial intermediation services indirectly measured (FISIM) of £0.4 billion. This represents the value of implied service charges paid by households to financial intermediaries (such as banks and building societies) in the form of foregone interest on deposits and higher interest payments on loans in lieu of direct fees for the provision of these services by financial intermediaries.
The value of the adjustment for the change in pension entitlements (which is removed from the calculation of total available resources on a cash basis) rose by £0.3 billion. Together with the transactions removed to calculate GDI on a cash basis, this explains why total available resources on a cash basis fell by £1.1 billion more than total available resources on a national accounts basis. Overall, total available resources on a cash basis fell by £3.8 billion, compared with a fall of £2.7 billion on a national accounts basis.
Further, the value of the transactions excluded from the calculation of final consumption expenditure on a cash basis rose by £0.2 billion. This rise meant that final consumption expenditure on a cash basis did not increase by as much as on a national accounts basis. Therefore, consumption growth did not have such a large downward impact on gross saving on a cash basis as on a national accounts basis.
Nôl i'r tabl cynnwys