
Cynnwys
- Main points
- Statistician’s comment
- Things you need to know about this release
- Life expectancy and healthy life expectancy in England, by Index of Multiple Deprivation 2015 (IMD15), 2014 to 2016
- Life expectancy and healthy life expectancy in Wales by Welsh Index of Multiple Deprivation 2014 (WIMD14), 2014 to 2016
- The Slope Index of Inequality (SII) for life expectancy and healthy life expectancy in England
- The Slope Index of Inequality (SII) for life expectancy and healthy life expectancy in Wales
- Comparing inequalities in life expectancy and healthy life expectancy between 2011 to 2013 and 2014 to 2016, England
- Comparing inequalities in life expectancy and healthy life expectancy between 2011 to 2013 and 2014 to 2016, Wales
- Quality and methodology
1. Main points
In England, the least deprived males at birth in 2014 to 2016 could expect to live almost a decade longer than the most deprived (9.3 years), while for females the gap was 7.4 years.
In 2014 to 2016, the least deprived males and females at birth in Wales could expect to live 8.9 years and 7.3 years more than the most deprived, respectively.
Large gaps in longevity by level of deprivation exposure persisted at age 65 years in England and Wales; the gap for men exceeded 4.7 years and the gap for women exceeded 4.6 years.
The gap in healthy life expectancy at birth exceeded 18 years for both males and females in England whereas in Wales, it surpassed 17 years for both males and females.
There were increases in the socioeconomic inequality in male and female life expectancy at birth and at age 65 years between 2011 to 2013 and 2014 to 2016 in both England and Wales; however, the increases were only statistically significant in England.
2. Statistician’s comment
“The changes in life expectancy and healthy life expectancy between 2011 to 2013 and 2014 to 2016 were generally most favourable among those living in the least deprived 10% of areas in both countries. There were noticeable falls in female life expectancy at birth in the 20% most deprived populations in England. The growth in the inequality in life expectancy was a result of more favourable longevity gains among less deprived populations.”
Ellie Osborn, Health Analysis and Life Events, Office for National Statistics.
Nôl i'r tabl cynnwys3. Things you need to know about this release
What are health state life expectancies?
The life expectancy (LE) estimates reported in this release are period-based life expectancies. This is a measure of the average number of years a person would live from a given age, if he or she experienced the particular area’s age-specific mortality rates for that time period throughout his or her life. This measure makes no allowance for any future actual or projected changes in mortality. Further, the smaller sample size in Wales can cause more fluctuation in the Welsh health state life expectancy estimates.
Healthy life expectancy (HLE) is an estimate of the number of years lived in “Very good” or “Good” general health, based on how individuals perceive their general health.
Disability-free life expectancy (DFLE) is an estimate of the number of years lived without a long-lasting physical or mental health condition that limits daily activities.
What are deprivation deciles?
National deciles of area deprivation are created through ranking small geographical populations known as Lower Layer Super Output Areas (LSOAs) based on their deprivation score and grouping them into 10 divisions based on the subsequent ranking. Each decile represents 10% of the population, with decile one being the 10% most deprived LSOAs and decile 10 being the 10% least deprived LSOAs. Please note that the LSOA mid-year population estimates are currently undergoing a revision and as a result, we will look to revise our estimates in the future.
Deprivation deciles have been calculated separately for LSOAs in England and for LSOAs in Wales as their deprivation measures are derived differently and are not therefore comparable. For England, the Index of Multiple Deprivation 2015 (IMD15) was used as the measure of deprivation; in Wales, the Welsh Index of Multiple Deprivation 2014 (WIMD14) was used. The Quality and methodology section of this statistical bulletin details the domains each country’s IMD contains.
The back series of estimates using IMD15 and WIMD14 are provided in the datasets between 2011 to 2013 and 2014 to 2016 for life expectancy (LE) and healthy life expectancy (HLE) only. Even though there is no commentary in the bulletin, disability-free life expectancy (DFLE) data are included for the period 2014 to 2016 only; the time period is restricted due to changes from 2013 in the survey items used to produce statistical measures of disability.
How is inequality measured?
Inequality in this bulletin is measured in absolute terms using the range and the Slope Index of Inequality (SII). The range is the absolute difference between the most and least deprived deciles. The SII can be interpreted in the same way as the range but takes into account inequality across the whole distribution, as well as giving greater weight to larger populations and less weight to smaller populations. This means that the higher the SII, the more unequal the population is with regard to health outcome.
It is worth noting that Public Health England (PHE) also calculate the SII, which is published in the Public Health Outcomes Framework (PHOF) back to 2010 to 2012, with slightly differing methodology for those aged over 65 years.
Nôl i'r tabl cynnwys4. Life expectancy and healthy life expectancy in England, by Index of Multiple Deprivation 2015 (IMD15), 2014 to 2016
In England, the gap in life expectancy at birth was 9.3 years for males and 7.4 years for females in 2014 to 2016
Life expectancy (LE) at birth among the most deprived males in England was 73.9 years, compared with 83.3 years among the least deprived, nearly a decade difference (Figure 1). Males in the least deprived 50% of areas could expect to live beyond the age of 80 years, while those in the 50% most deprived fell short of 80 years.
Females in decile one were expected to live 78.8 years, while in decile 10 they were expected to live 86.2 years (Figure 2). Males living in deciles five through to 10 had statistically significant longer LE than females in decile one.
The gap between adjacent deciles was larger between the two most deprived deciles, decile one and decile two, for both males and females. Decile two males were expected to live more than two years longer than males in decile one, showing a stark contrast even between relatively deprived populations.
Inequalities in healthy life expectancy at birth were wider than life expectancy for males and females
While there was a difference in life expectancy (LE) at birth when comparing males and females, healthy life expectancy (HLE) had a smaller disparity by sex.
HLE at birth among the most deprived males in England was 51.9 years, compared with 70.4 years among the least deprived, almost two decades of life in “Good” general health less (Figure 1). Males in the least deprived 40% of areas were expected to live on average more than 65 years in “Good” health, while those in the most deprived 30% were expected to live fewer than 60 years in “Good” health.
The gap between adjacent deciles was largest between decile one and decile two; the latter were expected to live almost four years longer in “Good” health than males in the most deprived decile. This demonstrates health outcomes were contrasting even between relatively deprived populations, as was also found for LE.
Figure 1: Healthy life expectancy (HLE) and life expectancy (LE) for males at birth by national deprivation deciles
England, 2014 to 2016
Source: Office for National Statistics
Notes:
Life expectancy includes all usual residents.
The health state prevalence estimates used to estimate Healthy Life Expectancy (HLE) are sourced from Annual Population Survey (APS) data. The APS excludes residents of communal establishments except NHS housing and students in halls of residence where inclusion takes place at their parents' address.
Deprivation deciles are based on the Index of Multiple Deprivation 2015 (IMD15), which is the official measure of relative deprivation. Decile one represents the most deprived and decile 10 represents the least deprived. More information regarding England's IMD measure is available.
Figures may not sum due to rounding.
Download this chart Figure 1: Healthy life expectancy (HLE) and life expectancy (LE) for males at birth by national deprivation deciles
Image .csv .xlsFemales in decile one could expect to live 51.8 years in “Good” health, compared with 70.7 years in decile 10, again approaching two decades of life in “Good” health less (Figure 2). Females in the least deprived 50% of areas were expected to live more than 65 years in “Good” health, while those in the most deprived 30% were expected to live fewer than 60 years in “Good” health.
The gap between adjacent deciles was larger between decile one and decile two for females and larger than the equivalent gap for males. Decile two females were expected to live 4.6 years longer in “Good” health than females in decile one.
Additionally, females in the least deprived 10% of areas (decile 10) were living 2.3 years longer in “Good” health than females in decile nine, showing an association with area deprivation even between the 20% least deprived populations.
The presence of the largest gap existing between decile one and two for both HLE as well as LE lends weight to the argument that falling below a given threshold of deprivation may lead to a disproportionate hazard affecting health outcome.
Figure 2: Healthy life expectancy (HLE) and life expectancy (LE) for females at birth by national deprivation deciles
England, 2014 to 2016
Source: Office for National Statistics
Notes:
Life expectancy includes all usual residents.
The health state prevalence estimates used to estimate Healthy Life Expectancy (HLE) are sourced from Annual Population Survey (APS) data. The APS excludes residents of communal establishments except NHS housing and students in halls of residence where inclusion takes place at their parents' address.
Deprivation deciles are based on the Index of Multiple Deprivation 2015 (IMD15), which is the official measure of relative deprivation. Decile one represents the most deprived and decile 10 represents the least deprived. More information regarding England's IMD measure is available.
Figures may not sum due to rounding.
Download this chart Figure 2: Healthy life expectancy (HLE) and life expectancy (LE) for females at birth by national deprivation deciles
Image .csv .xlsThe least deprived men and women at age 65 years could expect to live 5.1 and 4.6 years longer respectively than their most deprived counterparts
At age 65 years, the most deprived men were expected to live 15.8 years, that is, 5.1 years fewer than the least deprived, who were expected to live 20.9 years (Figure 3). For women, life expectancy (LE) at age 65 years in the most deprived decile was 18.6 years, compared with 23.2 years among the least deprived, a gap of 4.6 years (Figure 4).
The gap between deciles nine and 10 (the deciles with the lowest levels of deprivation) was the largest for both men and women at age 65 years. At older ages, differences in comparative wealth and assets between the two least deprived deciles may disproportionately influence the contrast in health outcomes observed. This is in sharp contrast to at birth, where the two most deprived deciles had the largest longevity gap.
Figure 3: Healthy life expectancy (HLE) and life expectancy (LE) for men at age 65 years by national deprivation deciles
England, 2014 to 2016
Source: Office for National Statistics
Notes:
Life expectancy includes all usual residents.
The health state prevalence estimates used to estimate Healthy Life Expectancy (HLE) are sourced from Annual Population Survey (APS) data. The APS excludes residents of communal establishments except NHS housing and students in halls of residence where inclusion takes place at their parents' address.
Deprivation deciles are based on the Index of Multiple Deprivation 2015 (IMD15), which is the official measure of relative deprivation. Decile one represents the most deprived and decile 10 represents the least deprived. More information regarding England's IMD measure is available.
Figures may not sum due to rounding.
Download this chart Figure 3: Healthy life expectancy (HLE) and life expectancy (LE) for men at age 65 years by national deprivation deciles
Image .csv .xlsAt age 65 years, the most deprived men were expected to live 6.2 years in “Good” health, 7.1 years less than the least deprived who were expected to live 13.3 years (Figure 3). For women, HLE at age 65 years in the most deprived decile was 6.8 years, compared with 14.5 years among the least deprived, a gap of 7.7 years (Figure 4).
The gaps between deciles for men and women at age 65 years did not have as much variation as other demographics, with the largest gap for men between deciles two and three at 1.4 years and for women, between deciles three and four at 1.5 years.
Figure 4: Healthy life expectancy (HLE) and life expectancy (LE) for women at age 65 years by national deprivation deciles
England, 2014 to 2016
Source: Office for National Statistics
Notes:
Life expectancy includes all usual residents.
The health state prevalence estimates used to estimate Healthy Life Expectancy (HLE) are sourced from Annual Population Survey (APS) data. The APS excludes residents of communal establishments except NHS housing and students in halls of residence where inclusion takes place at their parents' address.
Deprivation deciles are based on the Index of Multiple Deprivation 2015 (IMD15), which is the official measure of relative deprivation. Decile one represents the most deprived and decile 10 represents the least deprived. More information regarding England's IMD measure is available.
Figures may not sum due to rounding.
Download this chart Figure 4: Healthy life expectancy (HLE) and life expectancy (LE) for women at age 65 years by national deprivation deciles
Image .csv .xls5. Life expectancy and healthy life expectancy in Wales by Welsh Index of Multiple Deprivation 2014 (WIMD14), 2014 to 2016
In Wales, the gap in life expectancy at birth was 8.9 years for males and 7.3 years for females in 2014 to 2016
Life expectancy (LE) at birth among the most deprived males in Wales was 73.6 years, compared with 82.5 years among the least deprived, a difference of 8.9 years in length of life (Figure 5). Males in the least deprived 30% of areas were expected to live beyond the age of 80 years, while the remaining 70% were expected to fall short of this. The gap between adjacent deciles was largest between decile one and decile two (the two most deprived deciles), with the latter expected to live 1.6 years longer. Furthermore, there was also a sizeable gap in male LE at birth observed between decile two and decile three.
Females in decile one were expected to live 78.4 years, while decile 10 females were expected to live 85.7 years (Figure 6). Females in the most deprived decile (decile one) were living shorter lives than males living in the 50% least deprived areas, showing socioeconomic advantage for males in Wales was compensating for the disadvantage of sex.
Healthy life expectancy (HLE) at birth for males was 51.4 years in the most deprived 10% of areas compared with 69.0 years in the least deprived areas, a difference of 17.6 years (Figure 5). The largest adjacent gap for males at birth was 3.0 years between deciles two and three; however, only the 30% least deprived males were expected to live more than 65 years in “Good” health, while the most deprived 40% were expected to live fewer than 60 years in “Good” health.
Figure 5: Healthy life expectancy (HLE) and life expectancy (LE) for males at birth by national deprivation deciles
Wales, 2014 to 2016
Source: Office for National Statistics
Notes:
Life expectancy includes all usual residents.
The health state prevalence estimates used to estimate Healthy Life Expectancy (HLE) are sourced from Annual Population Survey (APS) data. The APS excludes residents of communal establishments except NHS housing and students in halls of residence where inclusion takes place at their parents' address.
Deprivation deciles are based on the Welsh Index of Multiple Deprivation 2014 (WIMD14), which is the official measure of relative deprivation. Decile one represents the most deprived and decile 10 represents the least deprived. More information regarding Wales' IMD measure is available.
Figures may not sum due to rounding.
Download this chart Figure 5: Healthy life expectancy (HLE) and life expectancy (LE) for males at birth by national deprivation deciles
Image .csv .xlsHLE at birth for females was 51.5 years in decile one, that is, 17.9 years fewer than decile 10, which was 69.5 years (Figure 6). The largest gap between adjacent deciles was between deciles four and five at 3.9 years, followed by 3.7 years between deciles one and two. The 40% least deprived were expected to exceed 65 years in “Good” health, while the 40% most deprived were expected to live fewer than 60 years in “Good” health.
Figure 6: Healthy life expectancy (HLE) and life expectancy (LE) for females at birth by national deprivation deciles
Wales, 2014 to 2016
Source: Office for National Statistics
Notes:
Life expectancy includes all usual residents.
The health state prevalence estimates used to estimate Healthy Life Expectancy (HLE) are sourced from Annual Population Survey (APS) data. The APS excludes residents of communal establishments except NHS housing and students in halls of residence where inclusion takes place at their parents' address.
Deprivation deciles are based on the Welsh Index of Multiple Deprivation 2014 (WIMD14), which is the official measure of relative deprivation. Decile one represents the most deprived and decile 10 represents the least deprived. More information regarding Wales' IMD measure is available.
Figures may not sum due to rounding.
Download this chart Figure 6: Healthy life expectancy (HLE) and life expectancy (LE) for females at birth by national deprivation deciles
Image .csv .xlsA rise in deprivation was not always associated with a corresponding decrease in healthy life expectancy in Wales at age 65 years
At age 65 years, the most deprived men were expected to live 15.7 years, that is, 4.7 years shorter than the least deprived who were expected to live 20.3 years. For women, LE in the most deprived decile was 17.8 years, compared with 23.0 years among the least deprived, a gap of just over five years.
At age 65 years, there was not the expected increase in HLE with a subsequent decrease in deprivation for each sex. Men in the 10% least deprived areas could expect to live 12.2 years in “Good” health compared with 6.0 years in decile one, over twice as many years (Figure 7). However, men in decile eight could also expect to spend 12.2 years in “Good” health, highlighting the non-linear (that is, increasing at every adjacent point from decile one to decile 10) pattern of HLE at age 65 years by deprivation in Wales.
Figure 7: Healthy life expectancy (HLE) and life expectancy (LE) for men at age 65 years by national deprivation deciles
Wales, 2014 to 2016
Source: Office for National Statistics
Notes:
Life expectancy includes all usual residents.
The health state prevalence estimates used to estimate Healthy Life Expectancy (HLE) are sourced from Annual Population Survey (APS) data. The APS excludes residents of communal establishments except NHS housing and students in halls of residence where inclusion takes place at their parents' address.
Deprivation deciles are based on the Welsh Index of Multiple Deprivation 2014 (WIMD14), which is the official measure of relative deprivation. Decile one represents the most deprived and decile 10 represents the least deprived. More information regarding Wales' IMD measure is available.
Figures may not sum due to rounding.
Download this chart Figure 7: Healthy life expectancy (HLE) and life expectancy (LE) for men at age 65 years by national deprivation deciles
Image .csv .xlsWomen at age 65 years could expect to live 13.0 years in “Good” health in decile 10 and 6.9 years in decile one, a difference of 6.1 years. However, the highest HLE was found in decile nine, where women could expect 13.2 years of life in “Good” health.
The largest adjacent decile gap occurred between deciles four and five, largely because decile five had a higher HLE than decile six. This demonstrates a more irregular socioeconomic pattern in HLE at age 65 years, where the 30% least deprived had similar HLE, rather than a clear increase with diminishing exposure to deprivation. However, the 40% most deprived had a clearly distinct less favourable health profile compared with the 60% least deprived.
Figure 8: Healthy life expectancy (HLE) and life expectancy (LE) for women at age 65 years by national deprivation deciles
Wales, 2014 to 2016
Source: Office for National Statistics
Notes:
Life expectancy includes all usual residents.
The health state prevalence estimates used to estimate Healthy Life Expectancy (HLE) are sourced from Annual Population Survey (APS) data. The APS excludes residents of communal establishments except NHS housing and students in halls of residence where inclusion takes place at their parents' address.
Deprivation deciles are based on the Welsh Index of Multiple Deprivation 2014 (WIMD14), which is the official measure of relative deprivation. Decile one represents the most deprived and decile 10 represents the least deprived. More information regarding Wales' IMD measure is available.
Figures may not sum due to rounding.
Download this chart Figure 8: Healthy life expectancy (HLE) and life expectancy (LE) for women at age 65 years by national deprivation deciles
Image .csv .xls6. The Slope Index of Inequality (SII) for life expectancy and healthy life expectancy in England
The inequality in healthy life expectancy at birth approached two decades for males and females in England, more than twice that of life expectancy
In 2014 to 2016, the inequality in life expectancy (LE) for males at birth as measured using the Slope Index of Inequality (SII) stood at 9.3 years, whereas for females the SII was 7.3 years. At age 65 years, the SII in LE for men was 5.2 years compared with 4.7 years for women, suggesting sizeable socioeconomic inequalities persist at age 65 years, as found in alternative measures of socioeconomic position.
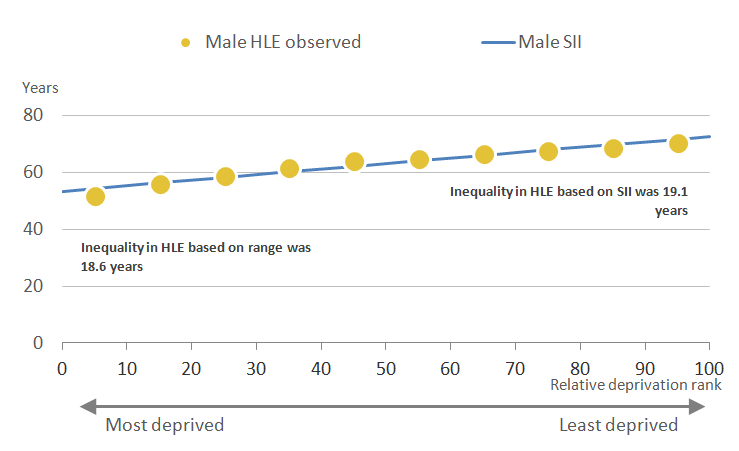
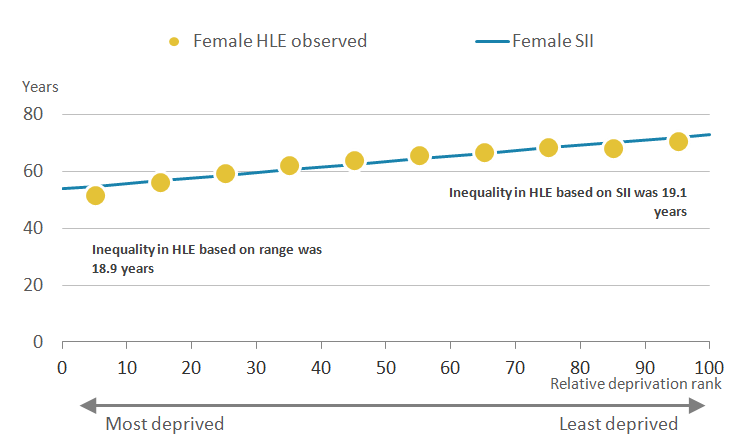
While there was a statistically significant higher inequality in male LE compared with female LE at birth and at age 65 years, this was not found for healthy life expectancy (HLE). The SII at birth was 19.1 years for each sex, while at age 65 years the inequality was larger for women at 7.9 years compared with 7.5 years for men.
Figures 9 and 10 plot the SII (a line of best fit) that estimates HLE at birth in 2014 to 2016 from the most to least deprived for males and females respectively. As can be observed for males, the majority of data points were close to or on the line, suggesting a good fit between HLE and area deprivation. For females, the SII in HLE at birth was also a good fit to the decile specific estimates. The SII in male HLE at birth was 0.5 years wider than the range, while for females it was 0.2 years wider than the range.
Figure 9: Inequality in healthy life expectancy (HLE) for males at birth by national deprivation deciles
England, 2014 to 2016
Source: Office for National Statistics
Notes:
The health state prevalence estimates used to estimate Healthy Life Expectancy (HLE) are sourced from Annual Population Survey (APS) data. The APS excludes residents of communal establishments except NHS housing and students in halls of residence where inclusion takes place at their parents' address.
Slope Index of Inequality (SII) is calculated by taking the difference between the extremes of a population weighted regression line of best fit.
Download this image Figure 9: Inequality in healthy life expectancy (HLE) for males at birth by national deprivation deciles
.PNG (14.6 kB) .xls (33.8 kB)
Figure 10: Inequality in healthy life expectancy (HLE) for females at birth by national deprivation deciles
England, 2014 to 2016
Source: Office for National Statistics
Notes:
The health state prevalence estimates used to estimate Healthy Life Expectancy (HLE) are sourced from Annual Population Survey (APS) data. The APS excludes residents of communal establishments except NHS housing and students in halls of residence where inclusion takes place at their parents' address.
Slope Index of Inequality (SII) is calculated by taking the difference between the extremes of a population weighted regression line of best fit.
Download this image Figure 10: Inequality in healthy life expectancy (HLE) for females at birth by national deprivation deciles
.PNG (14.6 kB) .xls (33.8 kB)
7. The Slope Index of Inequality (SII) for life expectancy and healthy life expectancy in Wales
The inequality in male and female healthy life expectancy at birth in Wales spanned almost two decades
In 2014 to 2016, the inequality in male life expectancy (LE) at birth in Wales stood at 9.0 years, a statistically significant higher inequality to that of females, which stood at 7.3 years. At age 65 years, inequalities persisted with a gap of 4.8 years for both men and women, showing an alignment in the magnitude of inequality at older ages.
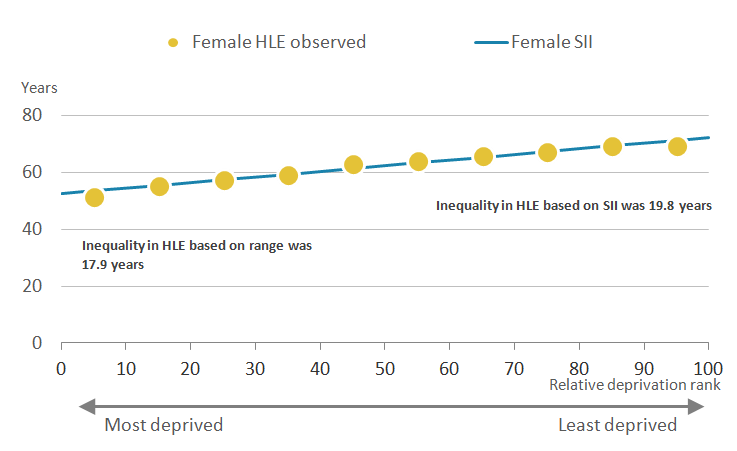
Healthy life expectancy (HLE) at birth had a more substantial gap, but the inequality was reversed with females having the larger inequality, which stood at 19.8 years compared with 18.3 years for males. At age 65 years, the gap in HLE was also wider for women at 7.1 years compared with 6.4 years for men.
The deprivation deciles were also close to the line of best fit in Wales (Figures 11 and 12). The Slope Index of Inequality (SII) in male HLE at birth was 0.7 years wider than the range, while for females it was 0.9 years wider than the range.
Figure 11: Inequality in healthy life expectancy (HLE) for males at birth by national deprivation deciles
Wales, 2014 to 2016

Source: Office for National Statistics
Notes:
The health state prevalence estimates used to estimate Healthy Life Expectancy (HLE) are sourced from Annual Population Survey (APS) data. The APS excludes residents of communal establishments except NHS housing and students in halls of residence where inclusion takes place at their parents' address.
Slope Index of Inequality (SII) is calculated by taking the difference between the extremes of a population weighted regression line of best fit.
Download this image Figure 11: Inequality in healthy life expectancy (HLE) for males at birth by national deprivation deciles
.PNG (14.4 kB) .xls (33.8 kB)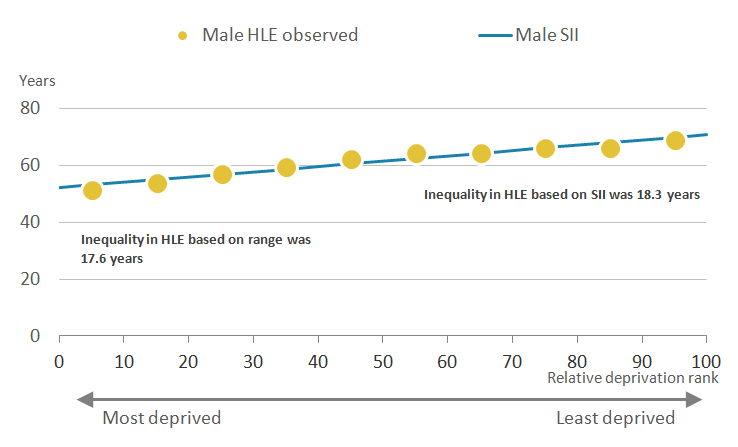
Figure 12: Inequality in healthy life expectancy (HLE) for females at birth by national deprivation deciles
Wales, 2014 to 2016
Source: Office for National Statistics
Notes:
The health state prevalence estimates used to estimate Healthy Life Expectancy (HLE) are sourced from Annual Population Survey (APS) data. The APS excludes residents of communal establishments except NHS housing and students in halls of residence where inclusion takes place at their parents' address.
Slope Index of Inequality (SII) is calculated by taking the difference between the extremes of a population weighted regression line of best fit.
Download this image Figure 12: Inequality in healthy life expectancy (HLE) for females at birth by national deprivation deciles
.PNG (14.6 kB) .xls (33.8 kB)
8. Comparing inequalities in life expectancy and healthy life expectancy between 2011 to 2013 and 2014 to 2016, England
The socioeconomic inequality in life expectancy significantly widened in England, whilst healthy life expectancy also showed increases for males
While the range and Slope Index of Inequality (SII) for life expectancy (LE) and healthy life expectancy (HLE) are important for a given point estimate such as that in 2014 to 2016, the change from the most recent non-overlapping period (2011 to 2013) is also important to consider, as it provides an opportunity to assess progress in narrowing the gap. Table 1 contains the SII in England for LE and HLE for the periods 2011 to 2013 and 2014 to 2016.
There were statistically significant increases in the socioeconomic inequality in LE for males and females at birth and at age 65 years in England. In general, the change in LE at birth for females across all deciles was less favourable than for males; the effect was to both close the gap between male and female LE and act to increase the socioeconomic inequality in female LE.
There was a statistically significant increase in the inequality in male LE at birth of 0.3 years, with the SII growing from 9.0 years in 2011 to 2013 to 9.3 years in 2014 to 2016. At age 65 years, the pattern of change across deciles mostly followed the picture described at birth. There was a statistically significant increase in the socioeconomic inequality in LE for men at age 65 years, rising to 5.2 years in 2014 to 2016 from 4.9 years in 2011 to 2013.
For females, there was a statistically significant increase in the socioeconomic inequality in LE at birth between 2011 to 2013 and 2014 to 2016. In the earlier period, the SII was 6.9 years but this grew to 7.3 years, a 0.4 year increase. For women, there was a statistically significant rise in the socioeconomic inequality in LE at age 65 years as measured by the SII, increasing to 4.7 years in 2014 to 2016, from 4.3 years in 2011 to 2013.
Table 1: Comparison of the Slope Index of Inequality (SII) and the range for life expectancy (LE) and healthy life expectancy (HLE) by sex, at birth and age 65 years, England, 2011 to 2016
| 2011 to 2013 | 2014 to 2016 | |||||||
|---|---|---|---|---|---|---|---|---|
| SII (years) | Range (years) | SII (years) | Range (years) | SII difference | Range difference | |||
| Males at birth | ||||||||
| LE | 9.0 | 9.0 | 9.3 | 9.3 | 0.3 | 0.3 | ||
| HLE | 18.6 | 18.0 | 19.1 | 18.6 | 0.5 | 0.5 | ||
| Men at age 65 | ||||||||
| LE | 4.9 | 4.9 | 5.2 | 5.1 | 0.3 | 0.3 | ||
| HLE | 6.9 | 6.2 | 7.5 | 7.1 | 0.6 | 0.9 | ||
| Females at birth | ||||||||
| LE | 6.9 | 6.9 | 7.3 | 7.4 | 0.4 | 0.5 | ||
| HLE | 19.1 | 18.5 | 19.1 | 18.9 | -0.0 | 0.5 | ||
| Women at age 65 | ||||||||
| LE | 4.3 | 4.4 | 4.7 | 4.6 | 0.3 | 0.3 | ||
| HLE | 7.3 | 7.0 | 7.9 | 7.7 | 0.6 | 0.7 | ||
| Source: Office for National Statistics | ||||||||
| Notes: | ||||||||
| 1. Life expectancy includes all usual residents. | ||||||||
| 2. The health state prevalence estimates used to estimate Healthy Life Expectancy (HLE) are sourced from Annual Population Survey (APS) data. The APS excludes residents of communal establishments except NHS housing and students in halls of residence where inclusion takes place at their parents' address. | ||||||||
| 3. SII is calculated by taking the difference between the extremes of a population weighted regression line of best fit. | ||||||||
| 4. Range is calculated by taking the difference between decile one and decile 10. | ||||||||
| 5. Figures may not sum due to rounding. | ||||||||
Download this table Table 1: Comparison of the Slope Index of Inequality (SII) and the range for life expectancy (LE) and healthy life expectancy (HLE) by sex, at birth and age 65 years, England, 2011 to 2016
.xls (31.2 kB)The inequality in healthy life expectancy grew for males, but fell slightly for females in England
A key ambition of government policy is to take actions to narrow the socioeconomic inequality in health outcomes, of which healthy life expectancy (HLE) is one. The estimates reported for the period 2014 to 2016 show increases in the SII for males at birth and both sexes at age 65, but these increases were not statistically significant (Table 1). However, the observed results were more consistent with a worsening rather than improving picture of socioeconomic health inequality in England.
In 2011 to 2013, the Slope Index of Inequality (SII) in male HLE at birth stood at 18.6 years, but this had increased by half a year to 19.1 years in 2014 to 2016. For females, the SII in HLE at birth was 19.1 years in 2011 to 2013, which remained unchanged in 2014 to 2016.
The inequality in HLE at age 65 years also grew for men between 2011 to 2013 and 2014 to 2016. In the earlier period, the SII stood at 6.9 years growing to 7.5 years in 2014 to 2016, a 0.6 year increase for men. For women, the SII in 2011 to 2013 was 7.3 years, rising to 7.9 years in 2014 to 2016.
Nôl i'r tabl cynnwys9. Comparing inequalities in life expectancy and healthy life expectancy between 2011 to 2013 and 2014 to 2016, Wales
The socioeconomic inequality in life expectancy widened more for males in Wales
Table 2 contains the Slope Index of Inequality (SII) in Wales for LE and HLE for the periods 2011 to 2013 and 2014 to 2016. While increases were observed in the socioeconomic inequality in LE for males and females at birth and at age 65 years, these were not statistically significant.
Inequality in male life expectancy (LE) at birth increased; the SII widened from 8.6 years in 2011 to 2013 to 9.0 years in 2014 to 2016, an increase of 0.4 years. The SII in female LE at birth also increased from 7.1 years to 7.3 years, an increase of 0.2 years.
At age 65 years the pattern of change across deciles for men was more favourable than at birth, and particularly more favourable than for women. The SII, however, increased from 4.4 years in 2011 to 2013 to 4.8 years in 2014 to 2016. For women at age 65 years, the SII in LE had a slight increase from 4.7 years in 2011 to 2013, rising to 4.8 years in 2014 to 2016.
Table 2: Comparison of the Slope Index of Inequality (SII) and the range for life expectancy (LE) and healthy life expectancy (HLE) by sex, at birth and age 65 years, Wales, 2011 to 2016
| 2011 to 2013 | 2014 to 2016 | |||||||
|---|---|---|---|---|---|---|---|---|
| SII (years) | Range (years) | SII (years) | Range (years) | SII difference | Range difference | |||
| Males at birth | ||||||||
| LE | 8.6 | 8.6 | 9.0 | 8.9 | 0.4 | 0.3 | ||
| HLE | 18.4 | 17.0 | 18.3 | 17.6 | -0.1 | 0.6 | ||
| Men at age 65 | ||||||||
| LE | 4.4 | 4.4 | 4.8 | 4.7 | 0.4 | 0.3 | ||
| HLE | 6.7 | 5.2 | 6.4 | 6.2 | -0.3 | 1.0 | ||
| Females at birth | ||||||||
| LE | 7.1 | 7.3 | 7.3 | 7.3 | 0.2 | 0.1 | ||
| HLE | 20.5 | 19.8 | 19.8 | 17.9 | -0.7 | -1.9 | ||
| Women at age 65 | ||||||||
| LE | 4.7 | 4.9 | 4.8 | 5.3 | 0.1 | 0.4 | ||
| HLE | 7.6 | 7.4 | 7.1 | 6.1 | -0.5 | -1.3 | ||
| Source: Office for National Statistics | ||||||||
| Notes: | ||||||||
| 1. Life expectancy includes all usual residents. | ||||||||
| 2. The health state prevalence estimates used to estimate Healthy Life Expectancy (HLE) are sourced from Annual Population Survey (APS) data. The APS excludes residents of communal establishments except NHS housing and students in halls of residence where inclusion takes place at their parents' address. | ||||||||
| 3. SII is calculated by taking the difference between the extremes of a population weighted regression line of best fit. | ||||||||
| 4. Range is calculated by taking the difference between decile one and decile 10. | ||||||||
| 5. Figures may not sum due to rounding. | ||||||||
| 6. For more information on how to interpret simulated confidence intervals see the methodology section. | ||||||||
Download this table Table 2: Comparison of the Slope Index of Inequality (SII) and the range for life expectancy (LE) and healthy life expectancy (HLE) by sex, at birth and age 65 years, Wales, 2011 to 2016
.xls (31.7 kB)The inequality in healthy life expectancy narrowed in Wales
For males and females at both birth and aged 65 years, the SII for healthy life expectancy (HLE) narrowed, which is more consistent with an improving picture in levels of socioeconomic inequality in Wales.
The SII for males at birth narrowed to 18.3 years from 18.4 years, whereas for females the SII narrowed to 19.8 years from 20.5 years. This has acted to narrow the inequality between males and females on this measure in Wales.
At age 65 years, the SII improved for men decreasing from 6.7 years to 6.4 years. However, women were observed to have a greater narrowing in the inequality, with the SII falling from 7.6 years to 7.1 years.
Nôl i'r tabl cynnwys10. Quality and methodology
The Health state life expectancies Quality and Methodology Information report contains important information on:
- the strengths and limitations of the data and how it compares with related data
- users and uses of the data
- how the output was created
- the quality of the output including the accuracy of the data
Calculating health state life expectancy
The data used in calculating the prevalence of health states were obtained from the Annual Population Survey (APS). They were aggregated over a three-year period to achieve sufficiently large sample sizes to enable meaningful statistical comparison at national and subnational level.
The prevalence of “Good” general health and disability-free among males and females resident in private households in England and Wales were estimated for each decile. Healthy life expectancy (HLE) was then calculated using the Sullivan method, which combines prevalence data with mortality and mid-year population estimates (MYE) over the same period and geographical coverage to calculate estimates of life expectancy (LE), HLE and disability-free life expectancy (DFLE) by age and sex (for more information, see the ONS life table template).
The APS provides prevalence information for those aged 16 and over. We are able to estimate lower age groups by using a census imputation method.
Results are presented with 95% confidence intervals in datasets to help interpretation. Confidence intervals in this statistical bulletin indicate the uncertainty surrounding the health state life expectancy measures (healthy life expectancy and disability-free life expectancy) and allow more meaningful comparisons between deciles. When comparing two estimates, non-overlapping confidence intervals are indicative of statistical significance.
Indices of multiple deprivation
The national deprivation deciles are scores based on the area as a whole and not everyone within a Lower Layer Super Output Area (LSOA) necessarily experiences the same level or type of deprivation. For example, some unemployed individuals live in less deprived LSOAs, while some higher-income individuals live in more deprived LSOAs. Similarly, deciles are a broad grouping and the levels of deprivation and the underlying factors determining the LSOA-level deprivation score will vary within the decile. Those LSOAs at the higher and lower end of each specific decile may vary considerably from each other. The widest variation is generally found between deciles 1 and 10.
England’s measure of deprivation is based on the Index of Multiple Deprivation (IMD) 2015; this index is calculated using seven domains:
- income
- employment
- education, skills and training
- health and disability
- crime
- barriers to housing and services
- living environment
Wales’s measure of deprivation is based on the Welsh Index of Multiple Deprivation (WIMD) 2014; this is calculated using eight domains:
- income
- employment
- health
- education
- access to services
- community safety
- physical environment
- housing
Slope Index of Inequality
The Slope Index of Inequality (SII) was used to assess the absolute inequality in life expectancy (LE) and each health state life expectancy between the least and most deprived deciles. This indicator measures the gaps by taking account of the inequality across all adjacent deciles of relative deprivation, rather than focusing only on the differencing of the two extremes.
To calculate the SII the following method was used.
Deciles were ordered by decreasing area deprivation, that is, from the most to the least deprived. The fraction of the total population in each decile (f) was calculated. The cumulative frequency (ci), that is, the cumulative sum of the population in successively less deprived deciles, was also obtained and the relative deprivation rank (x) for each decile was calculated. This is explained through the following formula:
The formula calculates the relative deprivation rank for use in the SII calculation.
The SII (a line of best fit) was then estimated by regressing the outcome measures (LE, HLE and DFLE) separately against the relative deprivation rank (x), weighted by the population in each decile.
Confidence interval details for SII indicators
The confidence intervals for the SII are calculated using a simulation program. Simulation is a method used to estimate the degree of uncertainty for measures where the statistical distributions underpinning the measure are too complex to analyse mathematically.
For each decile, the life expectancy (LE), healthy life expectancy (HLE) and disability-free life expectancy (DFLE) have been calculated along with its standard error (SE). These SEs give information about the degree of uncertainty around each of the health state life expectancy values: essentially, it describes a statistical distribution for each decile.
Using a random number generating algorithm, a random value is taken from each decile LE and HLE distribution and the SII recalculated. This is repeated many times (for example, 10,000), to build up a distribution of SII values based on random sampling from the decile LE distributions. The 2.5% and 97.5% values from this distribution of SII values are then reported as the 95% confidence interval for the SII, rather than that based on 10 observations representing the deciles.
Note that previously the confidence intervals were calculated based purely on the SII regression slope, ignoring the distributional information about the decile LEs and HLEs. This method generally overestimated the width of the confidence intervals, that is, it was overly conservative in most cases. The current method allows greater discrimination between areas and over time and greater opportunity to detect significance change over time.
Nôl i'r tabl cynnwysManylion cyswllt ar gyfer y Bwletin ystadegol
Related publications
- Health state life expectancies by national deprivation deciles, England: 2018 to 2020
- Health state life expectancies in England, Northern Ireland and Wales: between 2011 to 2013 and 2020 to 2022
- Healthy life expectancy at birth and age 65 by upper tier local authority and area deprivation: England, 2012 to 2014