Table of contents
1. Main points
- In Quarter 2 (April to June) 2020, VAT turnover diffusion indices were the lowest on record at the total industry level and for the services, production and construction sectors, with around 100,000 more firms reporting decreasing turnover than increasing turnover compared with the previous quarter.
- 73% of businesses using safety measures reported their implementation had increased their operating costs between 15 and 28 June, according to the latest Business Impact of Coronavirus Survey.
- The proportion of adults avoiding physical contact with older or vulnerable adults increased to 81% from 77% in the previous week, according to the latest Opinions and Lifestyle Survey (collected 2 to 5 July).
- Between 28 June and 5 July, high streets saw a moderate increase in footfall to just under 50% of the level the same day a year ago, while shopping centres and retail parks saw smaller increases.
- Job adverts measured by Adzuna fell between 26 June and 3 July 2020, from 51% to 47% of their 2019 average, with nearly all categories showing a decline.
- Overall, prices for high demand products (HDPs) fell 0.1% in the week ending 5 July relative to the week ending 28 June; household and hygiene goods prices fell 0.5% while prices for food remained stable.
- Total daily ship visits decreased slightly to 372 average daily visits between 29 June and 5 July, from 399 average daily visits in the week before.
The Business Impact of COVID-19 Survey (BICS) is voluntary and currently unweighted, so it may only reflect the characteristics of those who responded. Online price change analysis is experimental and should not be compared with our regular consumer price statistics. Results presented are experimental.
2. Value Added Tax (VAT) returns
This section contains:
- the latest quarterly turnover diffusion indices by industry up to Quarter 2 (April to June) 2020; 260,920 firms reported their turnover returns to Her Majesty’s Revenue and Customs (HMRC) in Quarter 2
- the latest monthly turnover diffusion indices by industry up to May 2020, where 35,370 firms have reported their turnover
- the number of new firms reporting their VAT returns up to June 2020
Turnover diffusion indices
Turnover diffusion indices are an aggregate measure used to track whether the majority of firms are reporting an increase or decrease in turnover in their Value Added Tax (VAT) returns. They are calculated as the percentage of firms with increasing turnover minus the percentage with decreasing turnover.
Estimates are based on matched businesses who have responded in both periods of interest. If a business uses the VAT deferral scheme, they should continue to submit VAT returns as normal; therefore, the volume of VAT returns should not be affected. The number of business returns in the most recent period are a little lower than normal, but this should not impact the interpretation of the results.
In Figure 1, the heatmap is a visual way of showing the VAT diffusion indices based on the standard deviation from their historical 2008 to 2019 average. Larger deviations are more darkly coloured, with red representing negative change, and teal positive change, when compared with the previous period.
The monthly estimate of GDP for May 2020 will be published on 14 July 2020. June 2020 estimates of Retail sales in Great Britain will be published on 24 July 2020. It is important to note that the timely VAT indicators are not attempting to forecast or predict gross domestic product (GDP) or other headline economic statistics here, and the indicators should not be interpreted in this way.
Figure 1: In Quarter 2 (April to June) 2020, VAT turnover diffusion indices were the lowest on record at the total industry level and for the services, production and construction sectors
Embed code
Source: Her Majesty’s Revenue and Customs
Notes
- Agri - Agriculture, forestry and fishing, All - All industries, SA - Seasonally adjusted, NSA - Not seasonally adjusted.
- All industries are unweighted: each firm contributing to the index has the same weight regardless of turnover, size or industry.
- The thresholds for the colours in the heatmap are based on standard deviations from the mean of the indicator between 2008 and 2019.
- The VAT diffusion indices published in the dataset underly the heatmap
Figure 1 shows that in Quarter 2 (Apr to June) 2020, compared with the previous quarter, the all-industry diffusion index was 14.6 standard deviations below its historical average from 2008 to 2019. This indicates that far more firms had decreasing turnover than increasing turnover. This was driven by considerable declines in all the major sectors, with services declining 16.1 standard deviations below its historical average from 2008 to 2019.
The month-on-month diffusion indices are informative about movements within the quarter. Figure 1 shows the month-on-month all-industry turnover diffusion index for May 2020 compared with April 2020 was 1.0 standard deviations above its historical mean, with a diffusion index of 0.03. This can be interpreted that in May 2020, out of the 35,370 firms who reported, around 1,000 more firms saw their turnover increase than firms who saw their turnover decrease compared with April 2020.
However, Figure 1 shows the month-on-year-ago all-industries diffusion index in May 2020 remained substantially below its historical average at negative 3.0 standard deviations.
Figure 2: The VAT quarter-on-quarter turnover diffusion index of negative 0.38 is the lowest on record at the total industry level
Quarterly VAT turnover diffusion index, Quarter 1 (Jan to March) 2018 to Quarter 2 (April to June) 2020, seasonally adjusted, current prices
Source: Her Majesty’s Revenue and Customs
Notes:
- Index<0 means more firms reported a decrease in turnover rather than an increase.
Download this chart Figure 2: The VAT quarter-on-quarter turnover diffusion index of negative 0.38 is the lowest on record at the total industry level
Image .csv .xlsFor Quarter 2 2020, the quarter-on-quarter turnover diffusion index for all industries was negative 0.38, which is the lowest on record since the series started in Quarter 1 (Jan to Mar) 2008. In other words, out of the 260,920 firms that reported their turnover in Quarter 2 2020, around 100,000 more firms saw their turnover decrease than the number of firms who saw their turnover increase.
This is largely driven by the services sector which includes 66% of all quarterly VAT returners (172,510) in Quarter 2 2020. The Quarter 2 2020 indexes for services, production and construction were all the lowest on record with diffusion indices at negative 0.37, negative 0.49 and negative 0.48 respectively.
Please note the monthly and quarterly diffusion indices can exhibit different trends as only a subset of firms contribute towards the monthly diffusion indices. Quarterly returns are allocated to the calendar quarter in which two or more of the months lie. For example, a quarterly return covering the period March 2020 to May 2020 will be allocated to Quarter 2 2020. At this stage of the quarterly data cycle, there is limited information about June 2020 feeding into the Quarter 2 2020 estimates.
For more information on how the quarterly reporting periods are derived, see VAT reporting periods in Section 2 of the VAT methodology article. The number of firms contributing towards each of the diffusion indices is published in the dataset.
New reporters
The new reporters index measures the number of firms sending VAT returns for the first time, which is related to the number of firm births. In June 2020, the number of new VAT reporters was 13,950 which is below the 2015 to 2019 five-year average of 20,908 and, apart from April 2020, was the lowest since April 2012.
Figure 3: Between April and June 2020, the average number of new reporters was 25% lower than the same three months this time last year
The number of new firm reporters, January 2015 to June 2020, non-seasonally adjusted
Source: Her Majesty’s Revenue and Customs
Download this chart Figure 3: Between April and June 2020, the average number of new reporters was 25% lower than the same three months this time last year
Image .csv .xlsMore about coronavirus
3. Business impact of the coronavirus
This section includes initial results from Wave 8 of the Business Impact of Coronavirus (COVID-19) Survey (BICS) for the period 15 June to 28 June 2020, which closes on 12 July 2020. Out of 24,496 businesses sampled, 18% had responded as of 7 July 2020.
Figure 4: 41% of businesses were providing pay top-ups to the Coronavirus Job Retention Scheme, covering 74% of their furloughed workforce
Headline indicators from the Business Impact of Coronavirus Survey, 15 June to 28 June, UK
Embed code
Notes:
- All percentages are a proportion of the number of businesses who responded apart from the workforce percentages on furlough leave and receiving pay top-ups, which are apportioned by workforce size.
- Businesses were asked for their experiences for the reference period 15 June to 28 June 2020, but for questions regarding to their experiences of the past two weeks or expectations in the next two weeks, businesses may respond from the point of completion of the questionnaire (29 June to 7 July).
Between 15 and 28 June 2020, 88% of businesses were trading (Figure 2), with 85% of businesses trading for more than the last two weeks prior to completing the questionnaire. Four percent said they had restarted trading in the last two weeks after a pause in trading.
Of the 11% of businesses temporarily closed, 4% intend to restart in the next two weeks and 7% do not. Of businesses trading, 7% of their total workforce had returned from furlough in the two weeks prior to completing the questionnaire and 3% had returned from remote working. In businesses intending to restart trade in the next two weeks, 5% of the workforce are expected to return from furlough and 3% are expected to return from remote working.
Of businesses currently trading, 43% reported that they had less than six months of cash reserves and 3% reported they had no cash reserves. These figures were both higher for businesses who had paused trading with 56% reporting less than six months of cash reserves and 10% reporting no cash reserves.
Table 1 shows the financial performance of businesses currently trading.
| Turnover has increased by more than 50% | 1% |
| Turnover has increased between 20% and 50% | 3% |
| Turnover has increased by up to 20% | 8% |
| Turnover has not been affected | 25% |
| Turnover has decreased by up to 20% | 20% |
| Turnover has decreased between 20% and 50% | 21% |
| Turnover has decreased by more than 50% | 16% |
| Not sure | 5% |
Download this table Table 1: 58% of businesses continuing to trade reported that their turnover had decreased below what is normally expected for this time of year
.xls .csvBusinesses were also asked if they were using, or intending to use, any of the following safety measures and the effect of their implementation on their operating costs (Figure 5):
- personal protective equipment (PPE)
- temperature checks
- routine COVID-19 testing
- social distancing
- shift working
- working in fixed teams
- staggered breaks
- hygiene measures
- other
Figure 5: 73% of businesses using safety measures reported their implementation had increased their operating costs
Percentage of businesses continuing to trade and who are using one or more safety measures, UK, 15 June to 28 June 2020
Source: Office for National Statistics – Business Impact of Coronavirus Survey
Notes:
- Bars may not sum to 100% due to rounding.
- The percentages of businesses reporting that operating costs had substantially decreased has been removed due to being less than 1%.
Download this chart Figure 5: 73% of businesses using safety measures reported their implementation had increased their operating costs
Image .csv .xls5. Footfall
These figures are provided by Springboard, a provider of data on customer activity. They measure the volume of footfall compared with the same day the previous year, across the categories of high streets, retail parks and shopping centres. For example, Tuesday 30 June 2020 was compared with Tuesday 2 July 2019.
Figure 7: Between 28 June and 5 July, high streets saw a moderate increase in footfall to just under 50% of their level the same day a year ago, while shopping centres and retail parks saw smaller increases
Volume of footfall, UK, 1 March to 5 July, year-on-year percentage change between footfall on the same day

Source: Springboard and the Department for Business, Energy and Industrial Strategy
Notes:
- Many essential shops were allowed to open on 15 June 2020 in England, 12 June 2020 in Northern Ireland and 22 June in Wales. In Scotland, some non-essential shops were allowed to reopen from 29 June, and more from 13 to 15 July.
- “Prime Minister’s announcement” refers to the advisory announcement on 16 March 2020 to avoid non-essential travel, bars, restaurants and other indoor leisure venues, and to work from home if possible.
Download this image Figure 7: Between 28 June and 5 July, high streets saw a moderate increase in footfall to just under 50% of their level the same day a year ago, while shopping centres and retail parks saw smaller increases
.png (165.6 kB)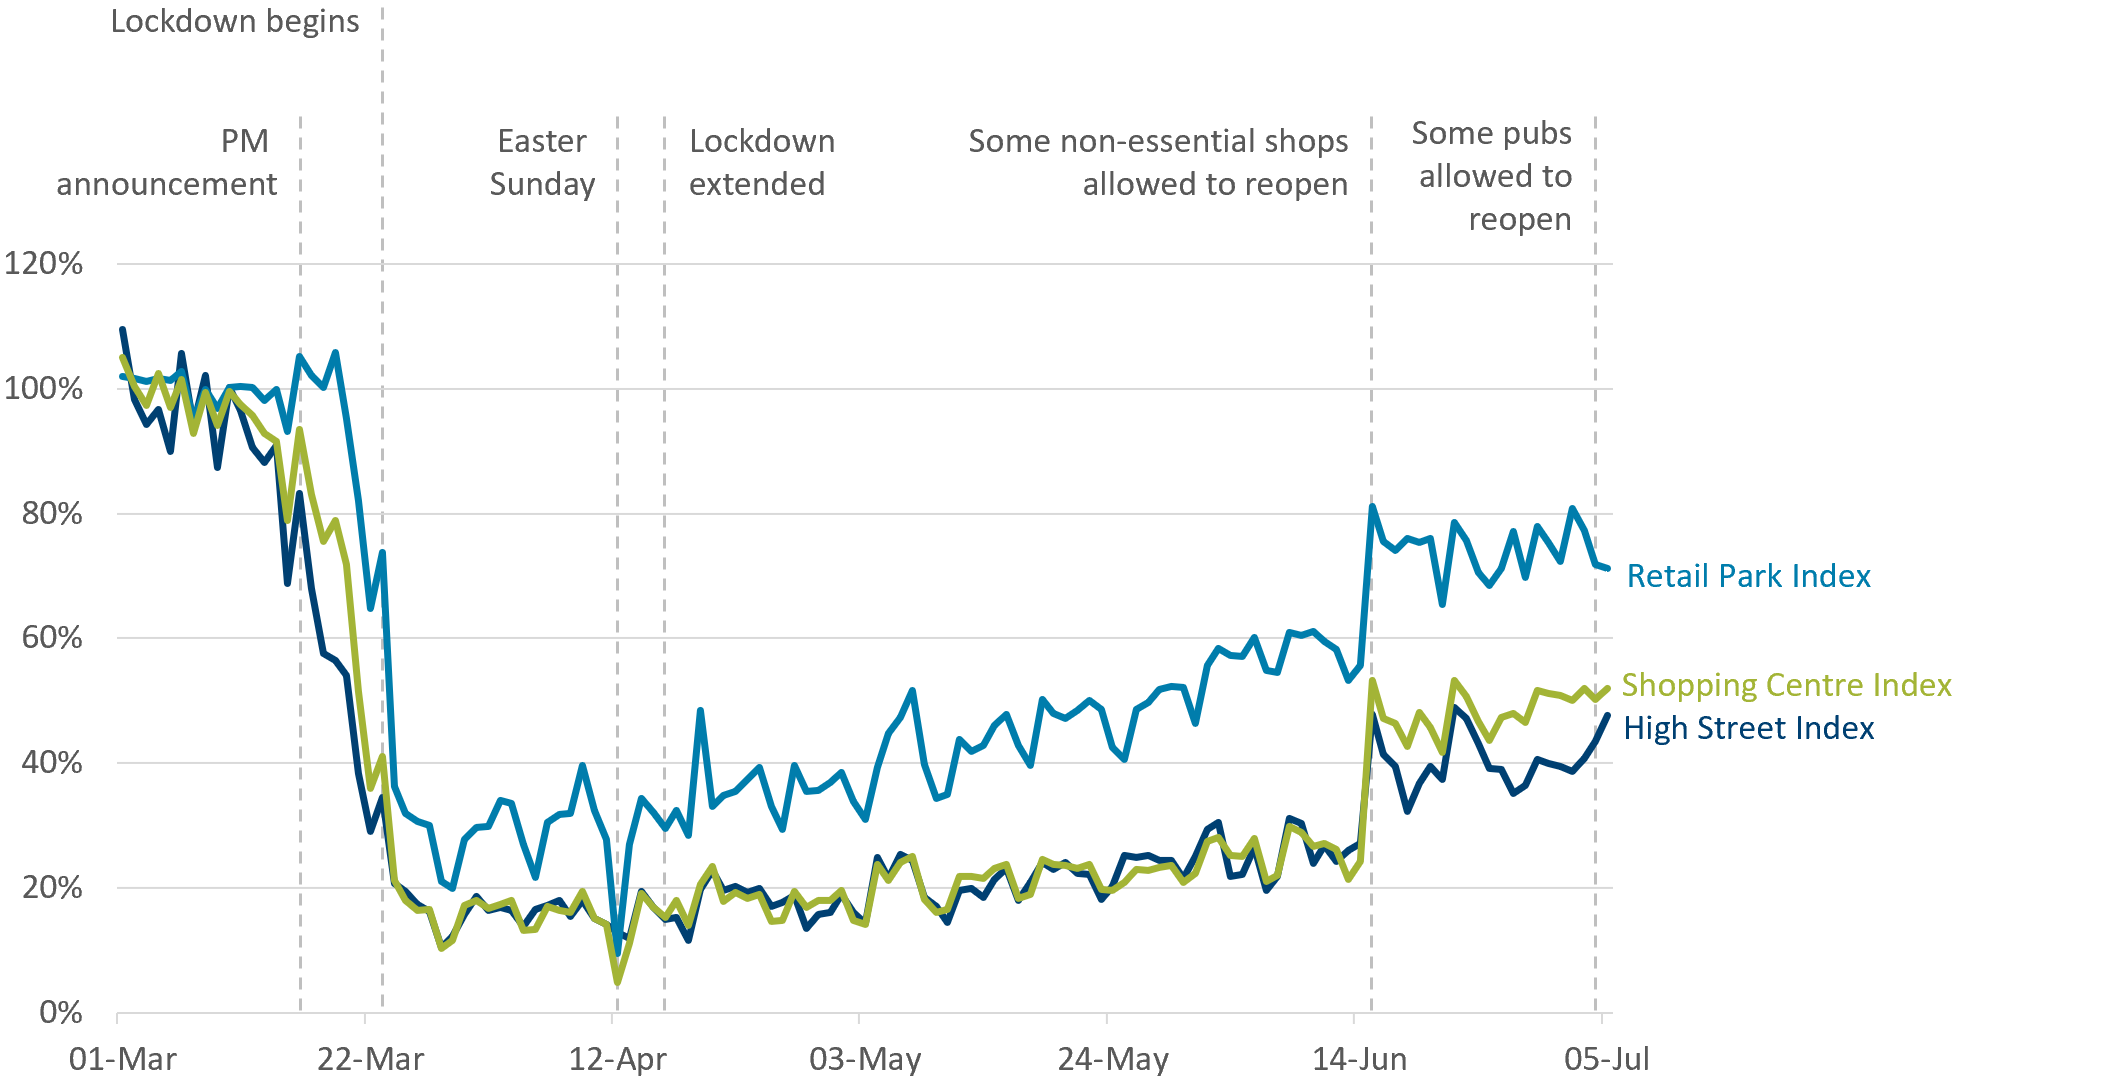
In the three weeks since the re-opening of non-essential shops and businesses in England on 15 June, overall levels of footfall have been fairly flat. However, between 28 June and 5 July footfall saw a moderate increase, mostly led by an increase in high streets in the last two days of the week.
Footfall on high streets increased substantially over the weekend from under 40% to around 50% of its level on the same day last year. This may be because Saturday 4 July saw a further easing of lockdown restrictions, with pubs allowed to re-open in England and Northern Ireland if they observed social distancing measures.
From 28 June to 5 July footfall in shopping centres increased slightly, to just over 50% of its level on the same day last year. Over the same period footfall in retail parks was more volatile, with footfall on average around 75% of its level the same week last year.
Back to table of contents6. Online job adverts
These figures use job adverts provided by Adzuna, an online job search engine. These estimates are experimental and will be developed over the coming weeks. The number of job adverts over time is an indicator of the demand for labour.
Figure 8: Between 26 June and 3 July 2020, job adverts fell from 51% to 47% of their 2019 average, with nearly all Adzuna categories showing a decline
Total weekly job adverts on Adzuna, UK, 4 January 2019 to 3 July 2020: index 2019 average = 100
Embed code
Notes:
- The observations were collected on a roughly weekly basis; however, they were not all observed at the same point in each week, leading to slightly irregular gaps between each observation.
- These series have a small number of missing weeks, mostly in late 2019, and the latest is in January 2020. These values have been imputed using linear interpolation. The data points that have been imputed are clearly marked in the accompanying dataset.
- Further category breakdowns are included in the Online job advert estimates dataset, and more details on the methodology can be found in Using Adzuna data to derive an indicator of weekly vacancies.
Total online job adverts still stand at around half of their 2019 average, with a 4% decrease between 26 June and 3 July.
Of the 29 Adzuna vacancy categories, only three saw an increase in this period; these were wholesale and retail (1%), catering and hospitality (1%), and the unknown category (1%). The increases in the first two of these reflect the expectation of shops and bars reopening.
The greatest fall in adverts between 26 June and 3 July was in the transport, logistics and warehouse category which fell by 12%, followed by domestic help, which fell by 10%.
In the most recent week, the volume of online job adverts for graduate jobs remained unchanged at just under 40% of its 2019 average.
The categories presented here were selected because of user interest. Note that the Adzuna categories used do not correspond to Standard Industrial Classification (SIC) categories, so these values are not directly comparable with the ONS Vacancy Survey. The Institute for Employment Studies are also using Adzuna data to produce weekly vacancy indicators, and more granular breakdowns of these data can be found in their release.
Back to table of contents7. Online price change for high-demand products (HDPs)
A timely indication of weekly price change for high-demand products (HDPs) has been developed, covering the period 16 March to 5 July 2020. A timeline of developments for these indicators can be found in Online price changes of high-demand products methodology. This analysis is experimental and should not be compared with our regular consumer price statistics.
Figure 9: Prices for household and hygiene goods have fallen 0.5% in the latest week while prices for food remain stable
Online price change of high-demand products, UK, percentage change between Week 15 (22 June to 28 June 2020) and Week 16 (29 June to 5 July)
Source: Office for National Statistics – Faster indicators
Notes:
- More information on the strengths and limitations of the online price changes data is available.
Download this chart Figure 9: Prices for household and hygiene goods have fallen 0.5% in the latest week while prices for food remain stable
Image .csv .xlsFigure 9 shows that the all HDP items index has decreased 0.1% between Week 15 and Week 16. All food prices remained stable, while all household and hygiene goods fell by 0.5%.
The movements in all household and hygiene goods were primarily driven by sales on a number of these products. The largest item-level price changes were tinned beans, which increased by 0.7%, and toilet rolls, which decreased by 1.3%. This is the largest fall in the price of toilet rolls since the start of the series on 16 March, with several retailers selling them on offer.
Figure 10 shows that the all HDP items index, the all household and hygiene index and the all food index are all broadly back in line with their March levels in Week 1.
Figure 10: Overall, prices for food and household and hygiene items have returned to similar levels as seen in March
Online price change of selected high-demand products 16 March to 5 July
Source: Office for National Statistics – Faster indicators
Notes:
- Index movements may not be exactly the same as percentage changes shown in Figure 9 as a result of rounding.
- Week 1 refers to the period 16 to 22 March 2020, and Week 16 refers to the period 29 June to 5 July 2020
- The time series for all individual HDP items are published in a dataset alongside this release.
Download this chart Figure 10: Overall, prices for food and household and hygiene items have returned to similar levels as seen in March
Image .csv .xls8. Shipping
These shipping indicators are based on counts of all vessels, cargo and tanker vessels and passenger vessels. As discussed in Faster indicators of UK economic activity: shipping, we expect the shipping indicators to be related to the import and export of goods.
This week we have introduced shipping data for the port of Hull. This has introduced a small discontinuity in the aggregate totals, of around 3% of the total. Visits to Hull are counted in the aggregate series from 1 June 2020.
Figure 11: Total daily ship visits decreased slightly to 372 average daily visits between 29 June and 5 July, from 399 average daily visits in the week before
Daily movements in shipping visits, UK, seasonally adjusted, 01 January 2020 to 5 July 2020
Source: exactEarth
Notes:
- The seasonally adjusted and trend estimates are estimated using a modified version of the seasonal adjustment method TRAMO-SEATS. More information is available in the Coronavirus and the latest indicators for the UK economy and society methodology.
- The seasonal adjustment method may be limited as this is a short time series, it will be fine-tuned in future releases.
- Daily and weekly shipping visits and unique visits are available by port in the dataset, along with non-seasonally adjusted aggregate series.
Download this chart Figure 11: Total daily ship visits decreased slightly to 372 average daily visits between 29 June and 5 July, from 399 average daily visits in the week before
Image .csv .xlsOn a seasonally adjusted basis, total daily ship visits decreased slightly to an average of 372 over the most recent week, 29 June to 5 July 2020, which compares with an average of 399 in the previous week. Cargo and tanker visits saw little change, falling to a weekly average of 108 visits a day, compared with 111 visits a day the week before. Passenger visits have continued to remain stable into early July, with a weekly average of 72 passenger visits between 29 June and 5 July.
Back to table of contents9. Data
Economic activity, faster indicators, UK
Dataset | Released 9 July 2020
Data on road traffic and Value Added Tax (VAT) data from HM Revenue and Customs (HMRC).
Weekly and daily shipping indicators
Dataset | Released 9 July 2020
The weekly and daily shipping indicators dataset associated with the faster indicators of UK economic activity.
Online price changes for high-demand products
Dataset | Released 9 July 2020
Weekly online price changes of selected high-demand products (HDPs).
Online job advert estimates
Dataset | Released 9 July 2020
Experimental job advert indices covering the UK job market.
10. Glossary
Diffusion index
The diffusion index tracks the growth in turnover and expenditure of firms. It is constructed to lie between negative one and one. If all firms report an increase in turnover or expenditure in the latest period relative to the base period, the index would be one. For example, if 65% of firms have increasing turnover, 30% have decreasing turnover and 5% turnover remains unchanged, then the diffusion index is 0.35.
Faster indicator
A faster indicator provides insights into economic activity using close-to-real-time big data, administrative data sources, rapid response surveys or experimental statistics, which represent useful economic and social concepts.
High-demand product (HDP) basket
The HDP basket contains everyday essential items that were identified at the beginning of the crisis to have high consumer demand, including items from food, health and hygiene categories. The selection of these items was based on anecdotal evidence on patterns of consumer spend. The basket does not cover all items within these categories.
New reporter
A new reporter is defined as a firm with a VAT reference (that is, firm identification number) which has not previously reported its VAT returns. New reporters are published within one month of the end of the reporting period.
The new reporting behaviour measure is classified by the month the data were received by HMRC, known as the receipt date, which is not necessarily the same as the reference period (the period for which the VAT return is made).
For more information please see the methodology article on Value Added Tax returns.
Back to table of contents11. Measuring the data
Detailed information on the data sources, quality and methodology of the different indicators included in this bulletin is available in the Coronavirus and the latest indicators of the UK economy and society methodology.
We will summarise any crucial updates to the quality or methodology in this section in the future.
Back to table of contents12. Strengths and limitations
Detailed information on the strengths and limitations of the different indicators included in this bulletin is available in the Coronavirus and the latest indicators of the UK economy and society methodology.
We will summarise any crucial updates or warnings in this section in the future.
Back to table of contents
4. Social impacts of the coronavirus on Great Britain
This section includes some headline results from Wave 16 of the Opinions and Lifestyle Survey (OPN) covering the period 2 to 5 July 2020. The full results will be published in Coronavirus and the social impacts on Great Britain on 10 July 2020.
Figure 6 shows that in the most recent week the proportion of adults avoiding physical contact with older or more vulnerable adults increased to 81%, from 77% in the previous week. For most of April this proportion was above 90%, before steadily declining through May and June.
The proportion of working adults travelling to work and exclusively working from home saw little change from the previous week. However, the proportion visiting a park or public green space continued to grow, from 50% to 52%.
Figure 6: The proportion of adults avoiding physical contact with older or vulnerable adults increased to 81% from 77% in the previous week
Proportion of adults, Great Britain, 20 March to 5 July 2020
Source: Office for National Statistics – Opinions and Lifestyle Survey
Notes:
Download this chart Figure 6: The proportion of adults avoiding physical contact with older or vulnerable adults increased to 81% from 77% in the previous week
Image .csv .xls