Cynnwys
- Main points
- Latest indicators at a glance
- OpenTable seated diner reservations
- Retail footfall
- UK spending on debit and credit cards
- Social impact of the coronavirus
- Business impacts and insights
- Roads and traffic camera data
- Shipping
- Online job adverts
- Data
- Glossary
- Measuring the data
- Strengths and limitations
- Related links
1. Main points
On Saturday 17 April 2021, estimates for UK seated diner reservations were at 60% of the level seen on the equivalent Saturday of 2019; this is a decrease of 19 percentage points from Monday 12 April 2021, when pubs and restaurants were first allowed to reopen in England for outdoor dining (OpenTable). See Section 3.
Overall retail footfall in the UK in the week to 17 April 2021 increased by 31 percentage points from the previous week, to 75% of the level seen in the equivalent week of 2019; this period includes the easing of lockdown restrictions in England and Wales on 12 April 2021 (Springboard). See Section 4.
The CHAPS-based indicator of credit and debit card purchases for delayable goods (such as clothing and furnishings) increased substantially by 26 percentage points in the week to 15 April 2021, to 89% of its average February 2020 level; this period includes the reopening of non-essential retail stores in England and Wales on 12 April 2021. See Section 5.
Of the 95% of adults who reported they had left home in the last seven days, the proportion who shopped for things other than food or medicine saw a notable increase of 6 percentage points to 20% this week (period to 18 April 2021) compared with the previous week (period to 11 April 2021); this period includes the reopening of non-essential retail stores in England and Wales on 12 April 2021. See Section 6.
According to final results from Wave 28 of BICS (22 March to 4 April 2021), the proportion of the workforce of all UK businesses on furlough was 17%, a slight decrease from 19% in the previous wave (Business Insights and Conditions Survey (BICS)). See Section 7.
The volume of motor vehicle traffic on Monday 19 April 2021 was at 92% of the level seen in the first week of February 2020, a slight increase from the previous week and a continuation of the recent upward trend (Department for Transport (DfT)). See Section 8.
Traffic camera activity in the week ending 18 April 2021 increased in London, Northern Ireland, and the North East when compared with the previous week (Transport for London, TrafficWatchNI, North East Traffic Cameras). See Section 8.
There was an average of 363 daily ship visits in the week ending 18 April 2021, a 10% increase from the previous week and 5% higher than the equivalent week of 2019 (exactEarth). See Section 9.
Total UK online job adverts on 16 April 2021 were at 99% of their February 2020 average level, broadly unchanged from 9 April 2021 (Adzuna). See Section 10.
There were 15,771 company incorporations in the week to 16 April 2021, a 12% decrease on the previous week (17,881) but 36% higher than the equivalent week in 2019 (11,558) (Companies House). See the accompanying dataset.
There were 5,325 voluntary dissolution applications in the week to 16 April 2021, a 5% increase on the previous week (5,059) and 9% higher than the equivalent week of 2019 (4,903) (Companies House). See the accompanying dataset.
The overall price of items in the online food and drink basket increased by 0.2% in the week ending 18 April 2021; the main upward contribution came from “sugar, jam, syrup, chocolate and confectionary”, of which chocolate experienced the largest price rise (online price collection). See the accompanying dataset.
Results presented throughout this bulletin are experimental and may be subject to revision.
2. Latest indicators at a glance
Embed code
This week, the following indicators are featured in this section of the bulletin only:
Companies House company incorporations and voluntary dissolution applications
online price changes
Energy Performance Certificate (EPC) lodgements
3. OpenTable seated diner reservations
OpenTable is a leading provider of online restaurant reservations, and these data are publicly available in their The state of the restaurant industry dashboard. These data show the impact of recent events and restrictions on the hospitality industry using a sample of restaurants on the OpenTable network across all channels, that is, online reservations, phone reservations, and walk-ins.
On Saturday 17 April 2021, estimates for UK seated diner reservations were at 60% of the level seen on the equivalent Saturday of 2019. This is a decrease of 19 percentage points from Monday 12 April 2021, the day that pubs and restaurants were first allowed to reopen for outdoor dining, when the figure was at 79% of the level seen on the equivalent Monday of 2019. Figures for London and Manchester on Saturday 17 April 2021 were 44% and 85% of the levels seen on the equivalent Saturday of 2019, respectively.
Nôl i'r tabl cynnwys4. Retail footfall
National retail footfall
National footfall figures are supplied by Springboard, a provider of data on customer activity. It measures the following for overall UK retail footfall, as well as by high street, retail park, and shopping centre categories:
daily retail footfall as a percentage of its level on the same day of the equivalent week of 2019; for example, Saturday 17 April 2021 is compared with Saturday 13 April 2019
total weekly retail footfall as a percentage of its level in the equivalent week of 2019
the percentage change in weekly footfall compared with the previous week; for example, Week 15 of 2021 is compared with Week 14 of 2021
Springboard's weekly data are defined over a seven-day period running from Sunday to Saturday; Week 15 of 2021 therefore refers to the period Sunday 11 April 2021 to Saturday 17 April 2021
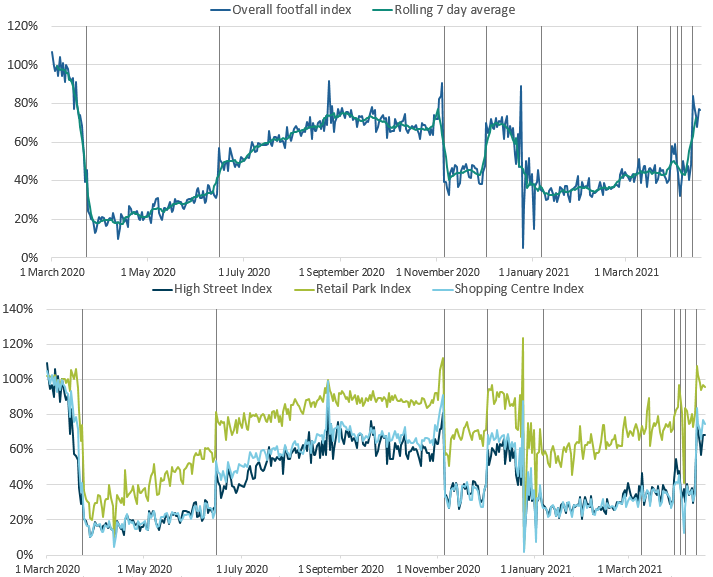
Figure 1: In the week to 17 April 2021, overall retail footfall in the UK was at 75% of its level in the equivalent week of 2019, an increase of 31 percentage points from the previous week
Volume of retail footfall, percentage compared with the equivalent day of the equivalent week of 2019, 1 March 2020 to 17 April 2021
Source: Springboard and the Department for Business, Energy & Industrial Strategy
Notes:
- The vertical lines indicate key events. In order, the events are; first National lockdowns imposed; lockdown restrictions begin to ease across the UK; circuit-breaker lockdown in England; regional restrictions begin in England; national lockdown begins in England; Good Friday 2021; Easter Monday 2021; opening of non-essential businesses in England.
Download this image Figure 1: In the week to 17 April 2021, overall retail footfall in the UK was at 75% of its level in the equivalent week of 2019, an increase of 31 percentage points from the previous week
.PNG (84.1 kB)
According to Springboard, in the week to 17 April 2021, overall retail footfall in the UK increased by 31 percentage points from the previous week to 75% of the level seen in the equivalent week of 2019. This increase coincides with the easing of lockdown restrictions in England and Wales on 12 April 2021.
Consistent with the trend observed since the beginning of the year, in the week to 17 April 2021, footfall at retail parks remained substantially higher than that at high streets and shopping centres, at 98% of its level in the equivalent week of 2019. The corresponding figures for shopping centres and high streets were 72% and 65%, respectively.
All retail locations saw substantial week-on-week increases in footfall, with shopping centres increasing by 127% and high streets increasing by 93%. Footfall in retail parks increased by 35% between the weeks ending 10 April and 17 April 2021. Users should note that week-on-week changes in footfall are presented as percentages rather than percentage points because the figures represent differences in the level of footfall between periods, rather than movements in an index.
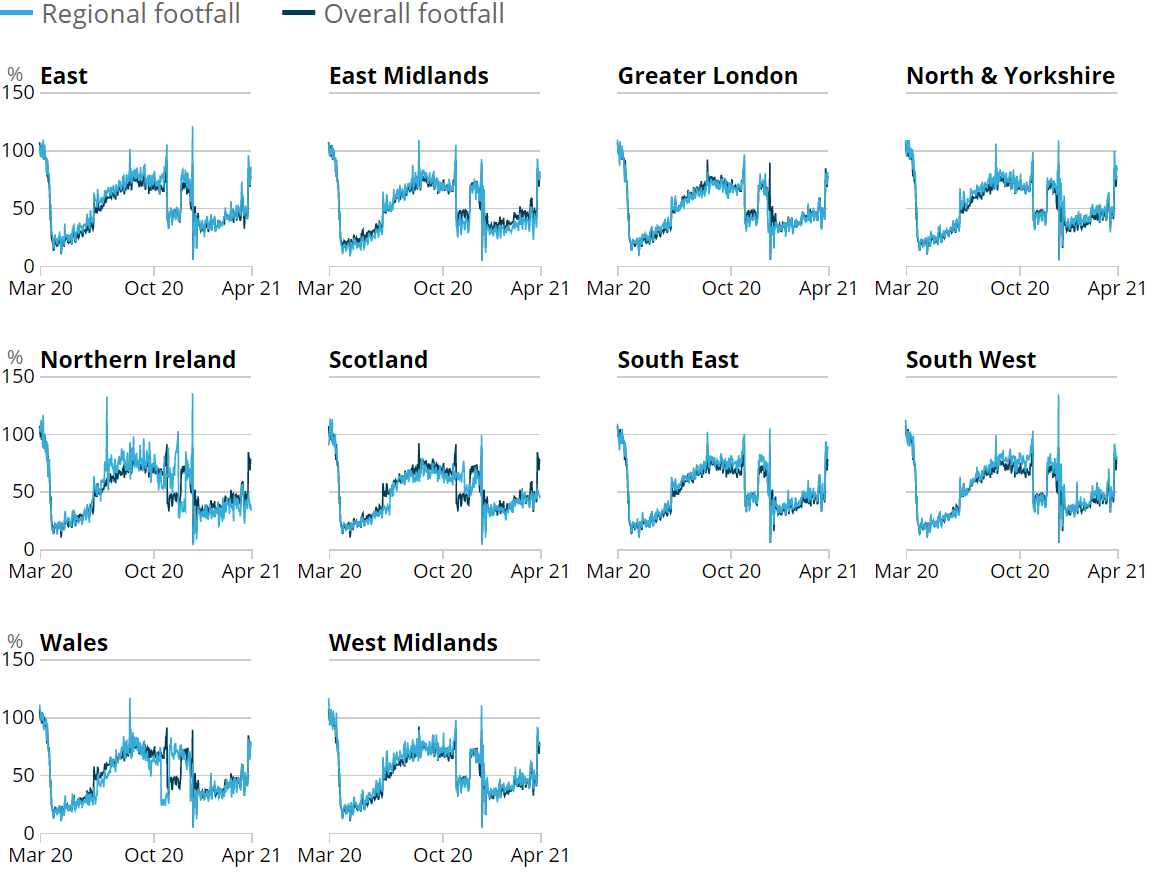
Figure 2: In the week to 17 April 2021, retail footfall was strongest in the South East of England at 85% of its level in the equivalent week of 2019
Volume of overall daily retail footfall, percentage of the level recorded on the same day of the equivalent week of 2019, UK regions, 1 March 2020 to 17 April 2021
Source: Springboard and the Department for Business, Energy & Industrial Strategy
Notes:
- Prior to 3 January 2021 daily indices were generated by comparing footfall against its level on the same day of the equivalent week the year before. From this date onwards they were generated by comparing footfall against its level on the same day of the equivalent week in 2019. For a two-day period, from 1 January 2021 to 2 January 2021 daily indices were therefore generated using a 2021 vs. 2020 comparison.
Download this image Figure 2: In the week to 17 April 2021, retail footfall was strongest in the South East of England at 85% of its level in the equivalent week of 2019
.PNG (110.0 kB)
According to Springboard, in the week to 17 April 2021, retail footfall was strongest in the South East of England at 85% of the level seen in the equivalent week of 2019. In the same period, retail footfall was weakest in Northern Ireland at 40% of its level in the equivalent week of 2019. Across all UK regions, retail footfall remains below its level in the equivalent week of 2019.
All countries and regions of the UK saw increases in retail footfall between the weeks ending 10 April 2021 and 17 April 2021 with the East Midlands seeing the largest increase by 114%. Scotland saw the smallest week-on-week increase of 14%.
Nôl i'r tabl cynnwys5. UK spending on debit and credit cards
These data series are experimental faster indicators for estimating UK spending on credit and debit cards. They track the daily Clearing House Automated Payment System (CHAPS) payments made by credit and debit card payment processors to around 100 major UK retail corporates. More information on the indicator is provided in the accompanying methodology article.
Companies are allocated to one of four categories based on their primary business:
"staples" refers to companies that sell essential goods that households need to purchase, such as food and utilities
"work-related" refers to companies providing public transport or selling petrol
"delayable" refers to companies selling goods whose purchase could be delayed, such as clothing or furnishings
"social" refers to spending on travel and eating out
Figure 3: In the week to 15 April 2021, the CHAPS indicator of credit and debit card purchases for delayable goods increased 26 percentage points from last week to 89% of its February 2020 average
Index February 2020 = 100, a backward looking seven-day rolling average,13 January 2020 to 15 April 2021, non-seasonally adjusted, nominal prices
Source: Office for National Statistics and Bank of England calculations
Notes:
- The daily payment data is the sum of card transactions processed up to the previous working day, so there is slight time lag when compared with real-life events on the chart.
- The vertical lines indicate key events. In order, the events are: PM COVID-19 announcement; lockdown begins; some non-essential shops allowed to reopen; local COVID-19 alert levels; national restrictions begin in England; Christmas Eve; lockdown begins in England and Scotland; 'stay at home' rule ends in England; the re-opening of non-essential retail stores in England.
- Percentage point difference is derived from current week and previous week index before rounding.
Download this chart Figure 3: In the week to 15 April 2021, the CHAPS indicator of credit and debit card purchases for delayable goods increased 26 percentage points from last week to 89% of its February 2020 average
Image .csv .xlsFigure 3 shows changes in the value of CHAPS payments received by large UK corporates from their credit and debit card processors, "merchant acquirers".
In the week to 15 April 2021, the CHAPS-based indicator of credit and debit card purchases in aggregate increased by 8 percentage points from the previous week to 91% of its February 2020 average. This was mainly driven by a sharp weekly increase in delayable spending of 26 percentage points, which coincided with the reopening of non-essential retail stores in England and Wales on 12 April 2021. Work-related spending edged up by 3 percentage points while staples consumption fell by 4 percentage points. Social spend was stable over the week.
In the latest week, despite its 4-percentage point decline, card spending on staples was at 112% of its February 2020 average level. Delayable, social and work-related purchases were 89%, 72% and 88% of their average levels in February 2020, respectively.
The full data time series available for data on UK spending on debit and credit cards can be found in the accompanying dataset.
Nôl i'r tabl cynnwys7. Business impacts and insights
Final results from Wave 28 of the Business Insights and Conditions Survey (BICS) cover the reference period 22 March to 4 April 2021, with a response rate of 25.3% (9,857 responses). The survey was live for the period 6 to 18 April 2021.
These dates should be kept in mind in relation to local and national restrictions in place during the reference period and the date when the business responded.
For experimental single-site weighted regional estimates that have been updated up to Wave 26 (22 February to 21 March 2021), please see Understanding the business impacts of local and national restrictions: March 2021.
Figure 4: The proportion of the workforce of all UK businesses (excluding those permanently ceased trading) on furlough has decreased slightly from 19% in the previous wave to 17%
Headline indicators from the Business Insights and Conditions Survey (BICS), 22 March to 18 April 2021
Embed code
Notes:
Final weighted results, Wave 28 of Office for National Statistics' (ONS') Business Insights and Conditions Survey (BICS).
A detailed description of the weighting methodology and the weights used for each variable is available in Business Insights and Conditions Survey (BICS).
Businesses were asked for their experiences for the reference period 22 March to 4 April 2021. However, for questions regarding the last two weeks, businesses may respond from the point of completion of the questionnaire (6 to 18 April 2021).
The final result of 17% of businesses' workforce on furlough leave from the end of March through to early April 2021 equates to approximately 5.6 million people. These numbers are based on multiplying the BICS-weighted furlough proportions by the Inter-Departmental Business Register (IDBR) total annual employment. This will not be consistent with employment estimates from Labour market statistics as these are based on different sources over different time periods, but provides an indication of the use of furlough. Additionally, the BICS proportion furloughed figure does not include the public sector, financial sector, and parts of agriculture.
BICS plans to update the methodology for producing the BICS estimate of number of employees furloughed (however, the percentage furlough numbers and tables will remain the same) from their publication in two weeks’ time, through alignment of eligible employments covered by the HM Revenue and Customs (HMRC) Coronavirus Job Retention Scheme (CJRS).
Across all UK industries in Wave 28:
74% of businesses had been trading for more than the last two weeks (broadly unchanged from Wave 27)
4% of businesses had started trading within the last two weeks after a pause in trading (an increase from 2% in Wave 27)
9% of businesses had paused trading but intend to restart in the next two weeks (an increase from 5% in Wave 27); this increase coincides with the reopening of retail and hospitality in England on 12 April 2021
10% of businesses had paused trading and do not intend to restart in the next two weeks (a decrease from 18% in Wave 27)
4% of businesses had permanently ceased trading (an increase from 3% in Wave 27)
8. Roads and traffic camera data
Road traffic in Great Britain
According to Department for Transport (DfT) non-seasonally adjusted road traffic data, the volume of all motor vehicle traffic on 19 April 2021 increased by 1 percentage point from the previous week, to 92% of the level seen in the first week of February 2020. This is a continuation of the recent upward trend and coincides with the further easing of restrictions in England and Wales that came into effect on 12 April 2021.
Compared with last week, car traffic, light commercial vehicle traffic, and heavy goods vehicle traffic all increased by 1 percentage point to 87%, 106%, and 107% of the levels seen on the same day of the first week in February 2020, respectively.
Figure 5: The volume of motor vehicle traffic on Monday 19 April was 92% of the level seen in the first week of February 2020, a slight increase from the previous week
Daily road traffic index: 100 = same traffic as the equivalent day of the week in the first week of February 2020, 1 March 2020 to 19 April 2021, non-seasonally adjusted
Source: Department for Transport road traffic statistics: management information
Notes:
- The vertical lines indicate key events. In order, these events are: First National lockdowns imposed; Good Friday; Easter Monday; Bank holiday; Bank holiday; National restrictions begin in England; Christmas Day; Boxing Day; New Year's Day; Lockdowns announced in England and Scotland; 'stay at home' rule ends in England; Good Friday; Easter Monday
Download this chart Figure 5: The volume of motor vehicle traffic on Monday 19 April was 92% of the level seen in the first week of February 2020, a slight increase from the previous week
Image .csv .xlsThe daily DfT estimates are indexed to the first week of February 2020 and the comparison is with the same day of the week. The data provided are useful as an indication of traffic change rather than actual traffic volumes. More information on the methods, quality and economic analysis for these indicators can be found in the DfT methodology article.
Traffic camera activity
Traffic cameras are a valuable source for understanding the level of activity in towns and cities as well as changing patterns of mobility. Further information on the methodology used to produce these data is available in our methodology article and Data Science Campus blog.
In the accompanying dataset, the following categories are available as non-seasonally adjusted, seasonally adjusted and trend data:
cars
motorbikes (only available for London and the North East)
buses
trucks
vans
pedestrians and cyclists
The categories are available for the following regions, which give a broad coverage across the UK and represent a range of different-sized settlements in urban and rural settings:
Figure 6: In the week to 18 April 2021, average levels of traffic camera activity increased in London, Northern Ireland and the North East when compared with the previous week
Traffic camera activity in selected areas, daily counts of cars, buses, pedestrians and cyclists, UK, seasonally adjusted, March 2020 to April 2021
Embed code
Notes:
- The three regions shown here were selected to be representative of the six regions available.
In the week to 18 April 2021, average levels of all types of traffic camera activity in London increased (except for motorbikes) compared with the previous week:
cars saw a weekly increase of 7% to 117% of the average level in the week before the first UK-wide lockdown (week ending 22 March 2020)
buses increased by 3% to 98%
trucks increased by 9% to 104%
vans increased by 7% to 111%
pedestrians and cyclists increased by 6% to 120%
motorbikes decreased by 8% to 111%
Traffic camera activity increased in the North East compared with the previous week:
cars saw a weekly increase of 10% to 102% of the average level in the week before the first UK-wide lockdown (week ending 22 March 2020)
buses increased by 6% to 104%
trucks increased by 5% to 93%
vans increased 7% to 94%
pedestrians and cyclists increased by 30% to 101%
Traffic camera activity also increased in Northern Ireland compared with the previous week:
cars increased by 13%
buses increased by 38%
trucks increased by 31%
vans increased by 14%
pedestrians and cyclists increased by 15%
Caution should be taken when interpreting weekly changes for Northern Ireland because of the relatively low numbers of counts across all categories. Comparisons with pre-lockdown levels cannot be made for Northern Ireland as data are not available for the week before the first UK-wide lockdown.
Nôl i'r tabl cynnwys9. Shipping
These shipping indicators are based on counts of all vessels, and cargo and tanker vessels. As discussed in Faster indicators of UK economic activity: shipping, we expect the shipping indicators to be related to the import and export of goods.
We are closely monitoring exactEarth data for any notable effects on UK shipping activity because of the Suez Canal blockage, which took place between 23 and 29 March 2021. However, we will be unable to delineate the exact effects of the blockage from any other contributing factors to changes in activity.
The coronavirus (COVID-19) pandemic first began to affect the level of shipping visits from the week ending 29 March 2020. For this reason, average ship visits in the latest week are compared with the equivalent week in 2019 rather than 2020.
Figure 7: There was an average of 363 daily ship visits in the week ending 18 April 2021, a 10% increase from the previous week (330) and 5% higher than the equivalent week in 2019 (347)
Daily movements in shipping visits, UK, seasonally adjusted, 1 December 2019 to 18 April 2021
Source: exactEarth
Download this chart Figure 7: There was an average of 363 daily ship visits in the week ending 18 April 2021, a 10% increase from the previous week (330) and 5% higher than the equivalent week in 2019 (347)
Image .csv .xlsThe 10% weekly increase in average daily ship visits in the week ending 18 April 2021 can be attributed to increased activity in numerous UK ports including Grimsby and Immingham, Tees and Hartlepool, Holyhead and Liverpool.
Figure 8: There was an average of 103 cargo and tanker ship visits in the week ending 18 April 2021, a 4% increase from the previous week (99) but the same as the equivalent week in 2019 (103)
Daily movements in cargo and tanker shipping visits, UK, seasonally adjusted, 1 December 2019 to 18 April 2021
Source: exactEarth
Notes:
- The vertical lines indicate key events. In order, the events are: storm Ciara; FCO advises against all non-essential international travel; lockdown begins; UK international travel quarantine begins; travel corridors to 59 countries come into force; storm Ellen; storm Francis, storm Alex; storm Aiden; storm Darcy.
Download this chart Figure 8: There was an average of 103 cargo and tanker ship visits in the week ending 18 April 2021, a 4% increase from the previous week (99) but the same as the equivalent week in 2019 (103)
Image .csv .xls10. Online job adverts
Job adverts by category
These figures are experimental estimates of online job adverts provided by Adzuna, an online job search engine, by category and by UK country and International territorial level 1 (ITL1) region. The number of job adverts over time is an indicator of the demand for labour. The Adzuna categories used do not correspond to Standard Industrial Classification (SIC) categories, so these values are not directly comparable with the Office for National Statistics (ONS) Vacancy Survey.
Figure 9: On 16 April 2021, total UK online job adverts were at 99% of their February 2020 average level, broadly unchanged from the previous week
Index of job adverts on Adzuna by category, 100 = average job adverts in February 2020, 4 January 2019 to 16 April 2021, non-seasonally adjusted
Embed code
Notes:
- Further category breakdowns are included in the Online job advert estimates dataset and more details on the methodology can be found in Using Adzuna data to derive an indicator of weekly vacancies.
According to Adzuna, on 16 April 2021, total online job adverts were at 99% of their February 2020 average level, similar to the proportion seen last week.
Excluding the “unknown” category, compared with 9 April 2021, the volume of online job adverts increased in 21 out of the 28 categories and fell in the remaining seven, when indexed to February 2020. The largest increase was in “transport and logistics”, which rose by 14 percentage points to 204% of its February 2020 average level. “Catering and hospitality” also increased, by 8 percentage points, to 66% of its February 2020 average level. This is the highest proportion of online job adverts for “catering and hospitality” seen since 12 March 2020, following its notable uptick in recent weeks.
The largest week-on-week decrease was in “domestic help”, which fell by 26 percentage points to 109% of its February 2020 average level on 16 April 2021. Note that this category is often subject to volatility.
Job adverts by region
Figure 10: Total online job adverts in Scotland decreased by 7 percentage points to 96% of their February 2020 average on 16 April 2021, the largest decrease from 9 April seen across all UK countries and regions
Total online job adverts in Scotland decreased by 7 percentage points to 96% of their February 2020 average on 16 April 2021, the largest decrease from 9 April seen across all UK countries and regions
Embed code
According to Adzuna, on 16 April 2021, the volume of online job adverts had increased in 5 out of the 12 UK ITL1 regions, fallen in 5 and remained unchanged in 2 when compared with 9 April 2021. The greatest change was recorded in Scotland, where the proportion of online job adverts fell by 7 percentage points, to 96% of its February 2020 average level.
London saw the greatest increase, but only by 2 percentage points to 86% of its February 2020 average level, the highest proportion for London seen since 20 March 2020. Despite this, London remains the UK region with the lowest proportion of online job adverts. North East England had the highest proportion of online job adverts on 16 April 2021 at 127% of its February 2020 average level.
Nôl i'r tabl cynnwys11. Data
UK spending on credit and debit cards
Dataset | Released 22 April 2021
Experimental faster indicators for monitoring UK retail purchases derived from the Bank of England's Clearing House Automated Payment System (CHAPS) data.
Shipping indicators
Dataset | Released 22 April 2021
Experimental weekly and daily ship visits dataset covering UK ports.
Traffic camera activity
Dataset | Released 22 April 2021
Experimental daily traffic camera counts data for busyness indices covering the UK.
Online job advert estimates
Dataset | Released 22 April 2021
Experimental job advert indices covering the UK online job market.
Company Incorporations and Voluntary Dissolutions
Dataset | Released 22 April 2021
The number of weekly Companies House Incorporations and Voluntary Dissolution applications accepted.
Online weekly price changes
Dataset | Released 22 April 2021
Experimental estimates of online price changes for a selection of food and drink products from several large UK retailers.
Business insights and impact on the UK economy
Dataset | Released 22 April 2021
Responses from the voluntary fortnightly Business Insights and Conditions Survey (BICS), which captures businesses responses on how their turnover, workforce prices, trade and business resilience have been affected in the reference period.
12. Glossary
Faster indicator
A faster indicator provides insights into economic activity using close-to-real-time big data, administrative data sources, rapid response surveys or Experimental Statistics, which represent useful economic and social concepts.
Company incorporations
Incorporations are when a company is added to the Companies House register of limited companies. This can also include where an existing business applies to become a limited company, where it was not one before.
Voluntary dissolution applications
A voluntary dissolution application is when a company applies to begin dissolution proceedings. As such, they effectively chose to be removed from the Companies House register. For a company to be eligible to voluntarily dissolve, it should not have completed any trading activity for a period of three months.
Nôl i'r tabl cynnwys13. Measuring the data
The ONS is publishing more data and analysis than ever before. We are constantly reviewing our publications based on your feedback to make sure that we continue to meet the needs of our users. As a result, future editions of this publication will focus more strongly on headline indicators and main messages. Datasets will continue to be available.
The Business Insights and Conditions Survey (BICS) is published fortnightly. Going forward, on BICS publication weeks, we will refer directly to the BICS publication instead of providing any BICS analysis in our release. Thank you for your continued support and we value your feedback.
UK coronavirus restrictions
A full overview of coronavirus (COVID-19) restrictions for each of the four UK constituent countries, as well as upcoming changes, can be found here:
These restrictions should be considered when interpreting the data featured throughout this bulletin.
Nôl i'r tabl cynnwys14. Strengths and limitations
Information on the strengths and limitations of the indicators in this bulletin is available in the Coronavirus and the latest indicators of the UK economy and society methodology. We will summarise any crucial updates or warnings in this section in the future.
Nôl i'r tabl cynnwys
6. Social impact of the coronavirus
This section includes some provisional results from the Opinions and Lifestyle Survey (OPN) covering the period 14 to 18 April 2021. The survey went out to 6,025 adults in Great Britain and had a response rate of 69%.
Further information to help understand the impact of the coronavirus (COVID-19) pandemic on people, households, and communities in Great Britain, will be available in Coronavirus and the social impacts on Great Britain due to be published 23 April 2021.
Travelling to work
In the week ending 18 April 2021, the proportion of working adults in Great Britain who in the last seven days:
travelled to work (either exclusively or in combination with working from home) increased slightly from the previous week to 55%
worked exclusively from home remained broadly similar to the previous week at 27%
neither travelled to work nor worked from home stayed broadly similar to the previous week at 17%
Shopping
Of the 95% of adults that reported they had left home in the last seven days, the proportion that did so to shop for food and medicine remained broadly unchanged compared with the previous week at 74%.
However, the proportion of these adults who shopped for things other than food and medicine in the last seven days saw a notable increase of 6 percentage points to 20% compared with the previous week. This coincides with the easing of lockdown restrictions in England and Wales, which came into effect on 12 April 2021.
Nôl i'r tabl cynnwys