Cynnwys
- Main points
- Latest indicators at a glance
- UK spending on debit and credit cards
- Business impact of the coronavirus
- Social impacts of the coronavirus
- Footfall
- Shipping
- Online price change in the food and drink basket
- Online job adverts
- Road and traffic camera data
- Company incorporations and voluntary dissolution applications
- Data
- Glossary
- Measuring the data
- Strengths and limitations
- Related links
1. Main points
Today we are launching an experimental faster indicator for estimating UK spending using debit and credit cards. Clearing House Automated Payment System (CHAPS) provides an indicator of UK companies’ sales. See Section 3
According to the Bank of England's CHAPS data, aggregate UK debit and credit card purchases were 35% below their February 2020 average in the week to 14 January 2021. See Section 3
According to the Business Impact of Coronavirus (COVID-19) Survey, over a quarter (26%) of UK businesses currently trading said that turnover had decreased by more than 20% compared with what is normally expected for this time of year. See Section 4
According to the latest Opinions and Lifestyle Survey, in the week ending 17 January 2021, the proportion of working adults in Great Britain who travelled to work in the last seven days stayed the same as the previous period at 48%. See Section 5
According to Springboard, in the week ending 17 January 2021, overall retail footfall in the UK is at 33% when compared with the same week a year ago, the lowest level since the week ending 7 June 2020. See Section 6
According to exactEarth seasonally adjusted shipping data, the seven-day average of the number of daily cargo ship visits has increased recently but has remained low at an average of 89 visits. See Section 7
Overall prices of items in the food and drink basket were unchanged in the week ending 17 January 2021. See Section 8
According to Adzuna, between 8 and 15 January 2021, the volume of online job adverts decreased across all UK regions, except for Yorkshire and The Humber. See Section 9
According to the Department for Transport (DfT), on Monday 18 January 2021 the volume of all motor vehicle traffic remained unchanged when compared with the Monday of the previous week. See Section 10
Results presented throughout this bulletin are experimental and may be subject to revision.
2. Latest indicators at a glance
Embed code
3. UK spending on debit and credit cards
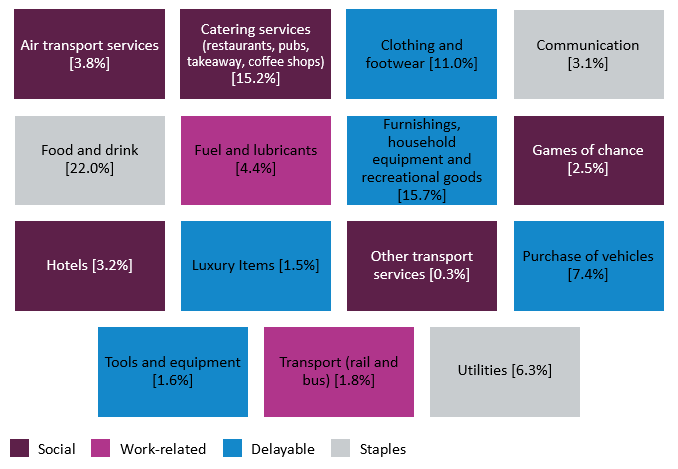
Today we are launching an experimental faster indicator for estimating UK spending on debit and credit cards, which is an indicator of UK companies' sales. The value of Clearing House Automated Payment System (CHAPS) payments received by large UK companies from their credit and debit card processors, known as "merchant acquirers", provides an indicator of UK companies' transactions made by customers, both via physical and online platforms. More information on the indicator is provided in the accompanying methodology article. Companies are allocated to one of four categories based on their primary business:
"staples" refers to companies that sell essential goods that households need to purchase, such as food and utilities
"work-related" refers to companies providing public transport or selling petrol
"delayable" refers to companies selling goods whose purchase could be delayed, such as clothing or furnishings
"social" refers to spending on travel and eating out
Scope of CHAPS
Users should note that, where used, the term "retail" in CHAPS is not consistent with that used in the Office for National Statistics (ONS) Retail sales figures. ONS's figures provide monthly estimates on what consumers are buying, and how much they are spending on items in stores and online. Retail in the CHAPS data uses a broader definition adding to the mix expenditure on social activities, such as sporting events, concerts, a meal or drinks in a pub or restaurant, haircuts, beauty treatments and train fares.
CHAPS may also capture some corporate spending as well as consumer expenditure.
Table 1: Retail sector mapping to data series
Weights in brackets according to the retail sector (relative) share of annual UK household consumption in Q4 2019
Source: ONS and Bank of England calculations
Notes:
- The four consumption category series (staples, delayable, work-related, social) are published in the dataset. Data at these 15 retail sector levels are not publishable.
- The percentages in the table may not add up to 100% due to rounding.
Download this image Table 1: Retail sector mapping to data series
.png (25.4 kB)
Figure 1: In the week to 14 January 2021, aggregate CHAPS debit and credit card purchases were 35% below their February 2020 average
Index February 2020 = 100, percentage change on a backward looking seven-day rolling average,13 January 2020 to 14 January 2021, non-seasonally adjusted, nominal prices
Source: ONS and Bank of England calculations
Notes:
- Users should note the daily payment data is the sum of card transactions processed up to the previous working day, so there is slight time lag when compared with real-life events on the chart.
Download this chart Figure 1: In the week to 14 January 2021, aggregate CHAPS debit and credit card purchases were 35% below their February 2020 average
Image .csv .xlsFigure 1 shows changes in the value of CHAPS payments received by large UK corporates from their credit and debit card processors "merchant acquirers", and shows that debit and credit card spending rose sharply over the festive period. Aggregate CHAPS purchases were on average 4% greater in December 2020 than in February 2020. This increase was driven by staples and delayable spending, such as in supermarkets and other retail stores, which typically increase in December.
Spending fell in the week following Christmas, and has remained relatively low for “work-related”, “social” and “delayable” expenditure. This is expected, coinciding with the extension of Tier 4 restrictions on Boxing Day, and the start of national lockdowns in the UK on 5 January 2021. In the week to 14 January 2021, aggregate CHAPS purchases were 35% below their February 2020 average with delayable expenditure seeing further decline from the previous week to 49% below their February 2020 average.
The full times series available for data on UK spending on debit and credit cards can be found in the accompanying dataset.
More about coronavirus
- Find the latest on coronavirus (COVID-19) in the UK.
- Explore the latest coronavirus data from the ONS and other sources.
- All ONS analysis, summarised in our coronavirus roundup.
- View all coronavirus data.
- Find out how we are working safely in our studies and surveys.
6. Footfall
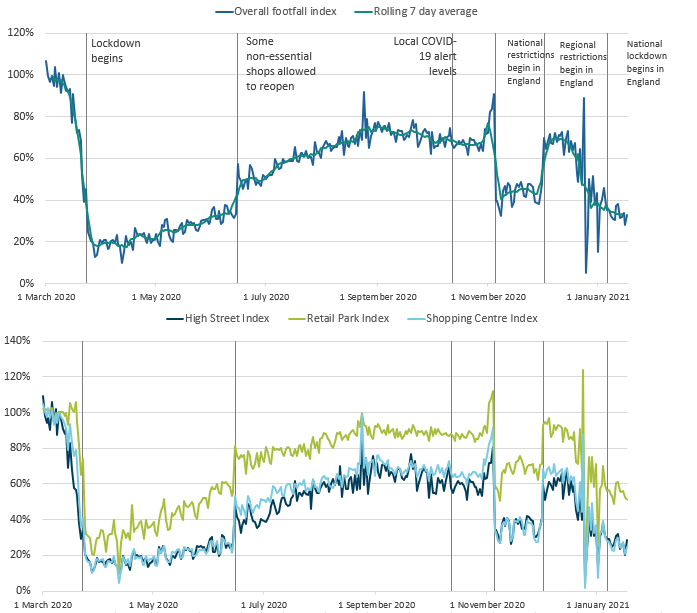
These figures are provided by Springboard, a provider of data on customer activity. They measure the volume of footfall compared with the same day the previous year at the overall level and across the categories of high streets, retail parks and shopping centres. For example, Sunday 10 January 2021 was compared with Sunday 12 January 2020.
Figure 3: In the week ending 17 January 2021, overall footfall is at 33% when compared with the same week a year ago
Volume of footfall, percentage change from the same day the previous year, UK, 1 March 2020 to 17 January 2021
Source: Springboard and the Department for Business, Energy & Industrial Strategy
Notes:
- The spike on Monday 24 August 2020 was caused by the comparison with 26 August 2019, which was bank holiday Monday with good weather. The bank holiday this year was a week later, on 31 August 2020.
Download this image Figure 3: In the week ending 17 January 2021, overall footfall is at 33% when compared with the same week a year ago
.png (88.9 kB)
According to Springboard, in the week ending 17 January 2021, overall retail footfall in the UK fell by 2 percentage points to 33% of the level seen in the same week of the previous year, the lowest level since the week ending 7 June 2020.
Footfall fell across all retail locations compared with the previous week. High streets decreased the most, by 3 percentage points on the week to 25% of the volume seen in the same week a year ago, shopping centres footfall fell by 2 percentage points to 26%, and retail parks footfall fell by 1 percentage point to 56%.
Nôl i'r tabl cynnwys7. Shipping
These shipping indicators are based on counts of all vessels, and cargo and tanker vessels. As discussed in Faster indicators of UK economic activity: shipping, we expect the shipping indicators to be related to the import and export of goods.
Figure 4: There was an average of 242 daily ships visits in the week ending 17 Jan 2020, lower than the same period a year ago
Daily movements in shipping visits, UK, seasonally adjusted, 1 January 2020 to 17 January 2021
Source: exactEarth
Download this chart Figure 4: There was an average of 242 daily ships visits in the week ending 17 Jan 2020, lower than the same period a year ago
Image .csv .xlsDespite the recent increase in daily shipping visits, the seven-day average of all daily ship visits is at lower levels than the same period last year, with the lowest point at 192 visits on 27 December 2020. Levels remain below pre-Christmas levels.
Figure 5: There was a continued low level of average daily cargo ships visits, with an average of 89 daily visits in the week ending 17 January 2020
Daily movements in shipping visits, UK, seasonally adjusted, 1 January 2020 to 17 January 2021
Source: exactEarth
Notes:
- The vertical lines indicate key events. In order, the events are: Storm Ciara; FCO advises against all non-essential international travel; Lockdown begins; UK international travel quarantine begins; travel corridors to 59 countries come into force; Storm Ellen; Storm Francis.
- The number of visits for Hull are included in these data from 1 June onwards.
- The seasonally adjusted and trend estimates are estimated using a modified version of the seasonal adjustment method TRAMO-SEATS. More information is available in the Coronavirus and the latest indicators for the UK economy and society methodology.
- The seasonal adjustment method may be limited as this is a short time series.
- Daily and weekly shipping visits and unique visits are available by port in the dataset, along with non-seasonally adjusted aggregate series.
- The trend is now calculated as a rolling seven-day average of the number of daily ship and cargo ship visits.
Download this chart Figure 5: There was a continued low level of average daily cargo ships visits, with an average of 89 daily visits in the week ending 17 January 2020
Image .csv .xlsSince reaching a low of 71 visits over the Christmas period, the seven-day average of the number of daily cargo ship visits has increased but is at lower levels than the same period last year, with a recent weekly average of 89 visits.
Nôl i'r tabl cynnwys8. Online price change in the food and drink basket
A timely indication of weekly online price change for a selection of food and drink products from several large UK retailers has been developed, covering the period 1 June 2020 to 17 January 2021. Details of the methodology used for these indicators can be found in Online price changes methodology. This analysis is experimental and should not be compared with our regular consumer price statistics.
The data time series, weekly growth rates, and contributions to the weekly change for all individual food and drink items, along with sample sizes, are published in a dataset alongside this release.
The overall prices of items in the online food and drink basket were unchanged between the week ending 10 January 2021 and the week ending 17 January 2021, with some product categories experiencing price falls, while others experienced offsetting price rises.
Figure 6: Overall prices of items in the food and drink basket were unchanged in the latest week
Contributions to online price change of a selection of food and drink products, UK, percentage point contributions to the percentage change between the week ending 10 January 2021 and the week ending 17 January 2021
Source: Office for National Statistics - Online price collection
Notes:
- Contributions may not always sum to the weekly change, as a result of rounding.
Download this chart Figure 6: Overall prices of items in the food and drink basket were unchanged in the latest week
Image .csv .xlsThe main downward contributors in the latest week were sugar, jam, syrup, chocolate and confectionery and milk, cheese and eggs, with a 0.2% and 0.1% price decrease respectively, with both responsible for a 0.01 percentage point downward effect on the unchanged overall price. Chocolate remains the main driver behind this after the Christmas period with price decreases at two major retailers.
Fruit and vegetables including potatoes and tubers categories saw a 0.2% price increase, whilst bread and cereals saw a 0.1% price increase, all of which contributed a 0.02 percentage point upward effect on the unchanged overall price.
Nôl i'r tabl cynnwys9. Online job adverts
These figures use job adverts provided by Adzuna, an online job search engine, and include experimental estimates of online job adverts by Adzuna category and by UK country and NUTS1 region. The number of job adverts over time is an indicator of the demand for labour. The Adzuna categories used do not correspond to Standard Industrial Classification (SIC) categories, so these values are not directly comparable with the Office for National Statistics (ONS) Vacancy Survey.
Figure 7: Between 8 and 15 January 2021, the volume of online job adverts decreased in 26 out of 28 categories
Total weekly job adverts on Adzuna, UK, 4 January 2019 to 15 January 2021, percentage change from the same week in the previous year
Embed code
Notes
The observations were collected on a roughly weekly basis; however, before June 2020 they were not all observed at the same point in each week, leading to slightly irregular gaps between some observations.
These series have a small number of missing weeks, mostly in late 2019, and the latest is in January 2020. These values have been imputed using linear interpolation. The data points that have been imputed are clearly marked in the accompanying dataset.
Further category breakdowns are included in the Online job advert estimates dataset, and more details on the methodology can be found in Using Adzuna data to derive an indicator of weekly vacancies
According to Adzuna, in the latest week ending 15 January 2021, the volume of UK online job adverts decreased by 4 percentage points from the previous week to 68% of the level seen in the same week last year.
Excluding the “unknown” category, online job adverts decreased in 26 out of 28 categories from the previous week; “Healthcare and social care” and “Legal” saw an increase of 7 percentage points and 2 percentage points, respectively. “Manufacturing” and “Transport, logistics and warehouse” each saw the largest decline, down by 15 percentage points from the previous week, to 89% and 86% of the volume seen last year. This week “Catering and Hospitality” has the lowest volume of online job adverts, at 25% of the level seen last year.
Regional job adverts
Figure 8: Between 8 and 15 January 2021, the volume of online job adverts decreased across all UK regions, except for Yorkshire & The Humber
Total weekly job adverts on Adzuna, UK, 4 January 2019 to 15 January 2021, percentage change from the same week in the previous year
Embed code
Notes
- There is a level shift in the Northern Ireland series from 17 October 2019 because a large source of Northern Ireland job adverts was removed, and another level shift from 7 August 2020 because of a new source being included.
In the latest week, job adverts decreased across all UK countries and English regions, except for Yorkshire and The Humber, which broadly stabilised at 77% of its volume when compared with the same week of last year. London remains the region with the lowest volume of job adverts, at 55% of the volume seen in the same week of last year.
The overall decrease in online job adverts coincides with the continuation of various lockdown restrictions across the UK, announced in late December 2020 and early January 2021, ordering the public to stay at home except for essential purposes. For a timetable detailing recent restrictions, see Measuring the data.
Nôl i'r tabl cynnwys10. Road and traffic camera data
According to the Department for Transport (DfT) non-seasonally adjusted road traffic data, on Monday 18 January 2021, the volume of all motor vehicle traffic remained stable when compared with the previous week and was at 63% of the level observed on the same day of the first week of February 2020. This continues the trend whereby overall traffic volumes remain lower than pre-Christmas levels.
On Monday 18 January 2021, traffic volumes of heavy goods vehicles (HGVs), light commercial vehicles and cars remained broadly unchanged compared with Monday 11 January 2021, at 98%, 79% and 57% of the level seen in the first Monday of February 2020 respectively.
Figure 9: On Monday 18 January 2021 the total volume of all motor vehicle traffic remained unchanged when compared with the Monday of the previous week
Daily road traffic index: 100 = same traffic as the equivalent day of the week in the first week of February 2020, 1 March 2020 to 18 January 2021, non-seasonally adjusted, Great Britain
Source: Department for Transport road traffic statistics: management information
Notes:
- On 5 January 2021, Mainland Scotland enters a full national lockdown, England follows on 6 January 2021.
- For full details on the dates on when countries/regions entered their respective tiers and restrictions refer to section 14: lockdown restrictions as of 11 January 2021
Download this chart Figure 9: On Monday 18 January 2021 the total volume of all motor vehicle traffic remained unchanged when compared with the Monday of the previous week
Image .csv .xlsThe daily DfT estimates are indexed to the first week of February 2020 and the comparison is with the same day of the week. The data provided are useful as an indication of traffic change rather than actual traffic volumes. More information on the methods, quality and economic analysis for these indicators can be found in the methodology article.
Traffic camera activity
Traffic cameras are a valuable source for understanding the level of activity in towns and cities as well as changing patterns of mobility. The UK has thousands of publicly accessible traffic cameras with providers ranging from national agencies to local authorities. Further information on the methodology used to produce these data is available in our methodology article and Data Science Campus blog.
In the accompanying dataset, the following categories are available as non-seasonally adjusted, seasonally adjusted and trend data:
cars
motorbikes (only available for London and the North East)
buses
trucks
vans
pedestrians and cyclists
The categories are available for the following regions, which give a broad coverage across the UK and represent a range of different-sized settlements in urban and rural settings:
Table 3 shows the average proportion (%) of all road activity in the latest week ending 17 January 2021 compared with the previous week for London, Northern Ireland, Manchester and the North East.
| Location / Traffic type | Cars | Vans | Buses | Trucks | Motorbikes | Pedestrians & cyclists |
|---|---|---|---|---|---|---|
| London | 98 | 99 | 100 | 102 | 93 | 92 |
| Northern Ireland | 100 | 95 | 78 | 103 | N/A | 89 |
| Manchester | 97 | 101 | 105 | 99 | N/A | 96 |
| North East | 101 | 103 | 98 | 100 | 104 | 104 |
Download this table Table 3: In the week ending 17 January 2021, in the North East average counts of traffic camera activity slightly increased for all vehicle types except buses and trucks which remains similar to the previous week's levels.
.xls .csvTable 4 shows the average proportion (%) of all road activity in the North East and London in the latest week ending 17 January 2021 compared with the period before the spring lockdown. Data for before the spring lockdown are calculated as an average from the period 11 March to 22 March 2020.
| Location / Traffic type | Cars | Vans | Buses | Trucks | Motorbikes | Pedestrians & cyclists |
|---|---|---|---|---|---|---|
| North East | 72 | 77 | 107 | 87 | 54 | 54 |
| London | 63 | 65 | 78 | 75 | 77 | 55 |
Download this table Table 4: In the week ending 17 January 2021, in London road traffic of all vehicle types are below the levels seen before the spring lockdown
.xls .csv11. Company incorporations and voluntary dissolution applications
According to Companies House data, in the week to Friday 15 January 2021, there were 15,326 company incorporations in the UK, down from 16,097 in the week before. This is higher than the number of incorporations seen in the second week of both 2019 and 2020, when 14,344 and 14,301 were registered respectively.
In the week to Friday 15 January 2021, there were 4,629 voluntary company dissolutions, down from 5,233 in the previous week. This is lower than the number of voluntary company dissolutions observed in the second week of 2019 and 2020, when there were 5,139 and 6,605 respectively.
Nôl i'r tabl cynnwys12. Data
UK spending on credit and debit cards
Dataset | Released 21 January 2021
These data series are experimental faster indicators for estimating UK spending using debit and credit cards.
Weekly and daily shipping indicators
Dataset | Released 21 January 2021
The weekly and daily shipping indicators dataset associated with the faster indicators of UK economic activity.
Traffic camera activity
Dataset | Released 21 January 2021
Experimental dataset for business indices covering the UK
Online weekly price changes
Dataset | Released 21 January 2021
The online price changes for a selection of food and drink products from several large UK retailers. These data are experimental estimates developed to deliver timely indicators to help understand the impact of the coronavirus (COVID-19) pandemic.
Online job advert estimates
Dataset | Released 21 January 2021
Experimental job advert indices covering the UK job market.
13. Glossary
Company incorporations
Incorporations are when a company is added to the Companies House register of limited companies. This can also include where an existing business applies to become a limited company, where it was not one before.
Faster indicator
A faster indicator provides insights into economic activity using close-to-real-time big data, administrative data sources, rapid response surveys or Experimental Statistics, which represent useful economic and social concepts.
Voluntary dissolution applications
A voluntary dissolution application is when a company applies to begin dissolution proceedings. As such, they effectively chose to be removed from the Companies House register. For a company to be eligible to voluntarily dissolve, it should not have completed any trading activity for a period of three months.
Nôl i'r tabl cynnwys14. Measuring the data
End of EU exit transition period
As the transition period ends and the UK enters into a new Trade and Cooperation Agreement with the EU, the UK statistical system will continue to produce and publish our wide range of economic and social statistics and analysis. We are committed to continued alignment with the highest international statistical standards, enabling comparability both over time and internationally, and ensuring the general public, statistical users and decision makers have the data they need to be informed.
Footfall methodology
Users should be aware that the percentage changes quoted in this bulletin for the week are based on an average of the percentage change on each of the seven days and are not weighted by footfall volume on each day. This can result in the percentage change in this bulletin differing from that published by Springboard in other publications.
UK regional lockdown restrictions
The following is a summary of the changes in coronavirus (COVID-19) restrictions in each of the four UK constituent countries between Monday 11 January and Monday 18 January 2021.
A full list of national restrictions is available for England from gov.uk, for Scotland from the Scottish Government, for Wales the Welsh Government and for Northern Ireland from nidirect.
Lockdown restrictions as of Monday 11 January 2021
Scotland
- All of mainland Scotland is under full lockdown restrictions; Orkney, the Shetland Islands and parts of the Western Isles are under Level 3 restrictions.
Wales
- All of Wales is in Tier 4 lockdown restrictions.
England
- England is under a full national lockdown.
Northern Ireland
- Northern Ireland is under a full national lockdown.
15 January 2021
UK
- The UK government imposes a full travel ban for travellers from South America and Portugal.
16 January 2021
Scotland
The Scottish Government tightens lockdown restrictions on essential shops and restaurants operating takeaway services.
The consumption of alcohol in public is banned.
18 January 2021
UK
- The UK closes all travel corridors; all arrivals must self-isolate for 10 days and those flying are required to present evidence of a negative COVID test before boarding the plane.
Detailed information on the data sources, quality and methodology of the different indicators included in this bulletin is available in the Coronavirus and the latest indicators of the UK economy and society methodology.
We will summarise any crucial updates to the quality or methodology in this section in the future.
Nôl i'r tabl cynnwys15. Strengths and limitations
Detailed information on the strengths and limitations of the different indicators included in this bulletin is available in the Coronavirus and the latest indicators of the UK economy and society methodology.
We will summarise any crucial updates or warnings in this section in the future.
Nôl i'r tabl cynnwys
5. Social impacts of the coronavirus
This section includes some headline results from Wave 41 of the Opinions and Lifestyle Survey (OPN) covering the period 13 to 17 January 2021. The survey went out to 6,030 adults in Great Britain and had a response rate of 74%.
Further information to help understand the impact of the coronavirus (COVID-19) pandemic on people, households and communities in Great Britain, will be available in Coronavirus and the social impacts on Great Britain published on 22 January 2021.
Travelling to work
In the week ending 17 January 2021, the proportion of working adults in Great Britain who:
travelled to work in the last seven days (both exclusively and in combination with working from home) stayed the same as the previous period (Wave 40) at 48%
worked exclusively from home in the last seven days stayed broadly the same at 35%
neither travelled to work nor worked from home in the last seven days stayed broadly the same at 16%
Shopping
The proportion of adults who shopped for things other than food and medicine in the last seven days stayed broadly the same at 5%; this continued low level coincides with lockdowns in all countries of the UK. The proportion of adults that shopped for food and medicine in the last seven days increased by 3 percentage points to 75%.
Nôl i'r tabl cynnwys