1. Main points
Between 15 and 28 June 2020, 90% of businesses in accommodation and food services reported increased operating costs because of the implementation of safety measures, according to the latest Business Impact of Coronavirus (COVID-19) Survey (BICS).
The proportion of adults shopping for things other than basic necessities increased to 19% from 13% in the previous week, according to the latest Opinions and Lifestyle Survey (OPN).
Between 6 and 12 July 2020, overall footfall remained relatively flat, though the seven-day average was just under 60% of the footfall level the same day a year ago, the highest reported since 20 March 2020.
Between 3 July and 10 July 2020, the volume of job adverts measured by Adzuna remained at just under 50% of their 2019 average.
Overall, prices for household and hygiene goods fell by 0.8% in the week ending 12 July relative to the week ending 5 July, while prices for food rose by 0.5%.
Daily visits of all ships remained stable, with an average of 377 daily visits between 6 and 12 July 2020.
The Business Impact of COVID-19 Survey (BICS) is voluntary and currently unweighted, so it may only reflect the characteristics of those who responded. Online price change analysis is experimental and should not be compared with our regular consumer price statistics. Results presented are experimental.
2. Business impact of the coronavirus
This section includes final results from Wave 8 of the Business Impact of Coronavirus (COVID-19) Survey (BICS) for the period 15 June to 28 June 2020, which closed on 12 July 2020. Out of 24,496 businesses sampled, 23% (5,527 businesses) responded.
Figure 1: 41% of businesses were providing pay top-ups to the Coronavirus Job Retention Scheme, covering 71% of their furloughed workforce
Headline indicators from the Business Impact of Coronavirus (COVID-19) Survey, UK, 15 June to 28 June 2020
Embed code
Source: Office for National Statistics – Business Impact of Coronavirus (COVID-19) Survey
Notes
- All percentages are a proportion of the number of businesses that responded apart from the workforce percentages on furlough leave and receiving pay top-ups, which are apportioned by workforce size.
Of all responding businesses, between 15 and 28 June 2020:
85% had been trading for more than the last two weeks
4% had started trading again within the last two weeks after a pause in trading
4% had paused trading but intended to restart trading in the next two weeks
6% had paused trading and did not intend to restart in the next two weeks
Of businesses trading, 8% of their total workforce had returned from furlough in the two weeks prior to completing the questionnaire and 4% had returned from remote working. Among businesses intending to restart trade in the next two weeks, 6% of the workforce were expected to return from furlough and 4% were expected to return from remote working.
Across all industries, of all businesses that had not permanently stopped trading, 2% of the workforce were off sick or in self-isolation because of the coronavirus with statutory or company pay. More information, including an industry breakdown of these data, can be found in Coronavirus and the economic impacts on the UK.
Of businesses currently trading, 41% reported that they had less than six months of cash reserves and 3% reported that they had no cash reserves. Both of these figures were higher for businesses that had paused trading, with 58% reporting less than six months of cash reserves and 10% reporting no cash reserves.
Businesses were asked if they were using, or intending to use, any of the following safety measures and the effect of their implementation on their operating costs (Figure 2):
- Personal Protective Equipment (PPE)
- temperature checks
- routine COVID-19 testing
- social distancing
- shift working
- working in fixed teams
- staggered breaks
- hygiene measures
- other
Figure 2: In accommodation and food services, 90% of businesses reported increased operating costs because of the implementation of safety measures
Percentage of businesses continuing to trade and that are using one or more safety measures, UK, 15 to 28 June 2020
Source: Office for National Statistics – Business Impact of Coronavirus (COVID-19) Survey
Notes:
- Bars may not sum to 100% because of rounding, and percentages of less than 1% have been removed for disclosure purposes.
- Other services and Mining and quarrying have been removed for disclosure purposes, but their totals are included in “all industries”.
Download this chart Figure 2: In accommodation and food services, 90% of businesses reported increased operating costs because of the implementation of safety measures
Image .csv .xlsIn accommodation and food service activities, 39% of businesses said that the implementation of safety measures had substantially increased their operating costs, while 51% in that industry said that it had increased their costs a little. Information and communication had the highest proportion of businesses reporting that safety measures had no effect on their operating costs at 24%.
More about coronavirus
4. Footfall
These figures are provided by Springboard, a provider of data on customer activity. They measure the volume of footfall compared with the same day the previous year, across the categories of high streets, retail parks and shopping centres. For example, Tuesday 30 June 2020 was compared with Tuesday 2 July 2019.
Figure 4: Between 6 and 12 July, overall footfall was relatively flat, but the seven-day average was just under 60% of the footfall level the same day a year ago, the highest reported since 20 March 2020
Volume of footfall, year-on-year percentage change between footfall on the same day, UK, 1 March to 12 July 2020

Source: Springboard and the Department for Business, Energy and Industrial Strategy
Notes:
- Many essential shops were allowed to open on 15 June 2020 in England, 12 June 2020 in Northern Ireland and 22 June 2020 in Wales. In Scotland, some non-essential shops were allowed to reopen from 29 June 2020 and more from 13 to 15 July 2020.
- “Prime Minister’s announcement” refers to the advisory announcement on 16 March 2020 to avoid non-essential travel, bars, restaurants and other indoor leisure venues and to work from home if possible.
- Pubs were allowed to reopen on 4 July 2020 in both England and Northern Ireland.
Download this image Figure 4: Between 6 and 12 July, overall footfall was relatively flat, but the seven-day average was just under 60% of the footfall level the same day a year ago, the highest reported since 20 March 2020
.png (117.5 kB)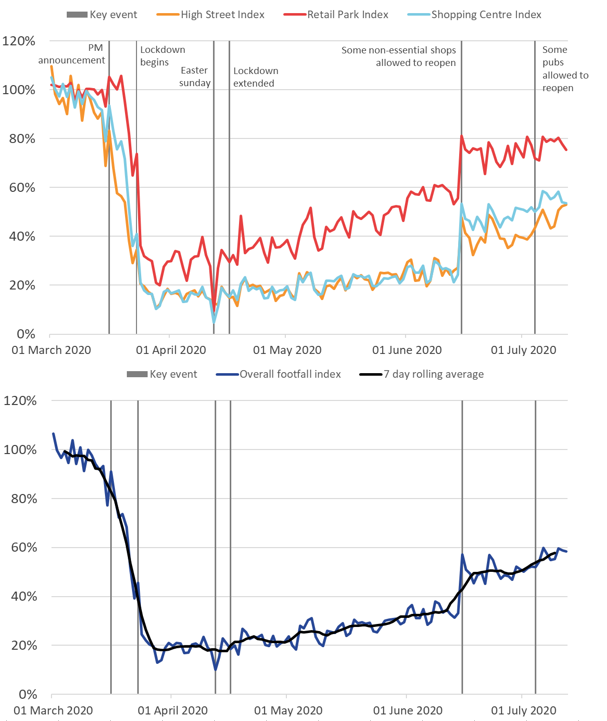
In the four weeks since the re-opening of non-essential shops and businesses in England on 15 June, overall levels of footfall have been gradually increasing. Between 6 and 12 July, overall footfall has been relatively flat, but the seven-day average is just under 60% of the footfall level the same day a year ago, the highest reported since 20 March 2020.
Since 15 June, the upward trend in overall footfall is explained by higher footfall on high streets and in shopping centres. This may be because Saturday 4 July saw a further easing of lockdown restrictions, with some pubs allowed to re-open in England and Northern Ireland if they observed social distancing measures.
Over the same period, footfall in retail parks has been relatively stable at around 75% of its level the same day last year, but footfall in retail parks remained higher compared with high streets and shopping centres.
Nôl i'r tabl cynnwys5. Online job adverts
These figures use job adverts provided by Adzuna, an online job search engine. These estimates are experimental and will be developed over the coming weeks. The number of job adverts over time is an indicator of the demand for labour.
Figure 5: Between 3 July and 10 July 2020, the volume of job adverts remained at just under 50% of their 2019 average
Total weekly job adverts on Adzuna, UK, 4 January 2019 to 10 July 2020: index 2019 average = 100
Embed code
Notes:
- The observations were collected on a roughly weekly basis; however, they were not all observed at the same point in each week, leading to slightly irregular gaps between each observation.
- These series have a small number of missing weeks, mostly in late 2019, and the latest is in January 2020. These values have been imputed using linear interpolation. The data points that have been imputed are clearly marked in the accompanying dataset.
- Further category breakdowns are included in the Online job advert estimates dataset, and more details on the methodology can be found in Using Adzuna data to derive an indicator of weekly vacancies.
Overall, between 3 and 10 July the volume of total online job adverts increased very slightly from 47% to 48% of its 2019 average, having remained at around half of their 2019 average over the last month. Their current level is only slightly higher than the lockdown low point of 42%, reached on 1 May.
Almost all categories saw minimal changes from the previous week, including those of health and social care, education, wholesale and retail, and catering and hospitality. The only category to change substantially was part-time or weekend job adverts, which decreased by 13% in the latest week.
For the first time since early April, the volume of job adverts in catering and hospitality was above 30% of its 2019 average. This is still much lower than the 2019 average, but it shows some increase from five weeks previous, when its value was below 20%.
The categories presented here were selected because of user interest and because they more closely track trends in the Office for National Statistics (ONS) vacancies data. Note that the Adzuna categories used do not correspond to Standard Industrial Classification (SIC) categories, so these values are not directly comparable with the ONS Vacancy Survey.
Nôl i'r tabl cynnwys6. Online price change for high-demand products (HDPs)
A timely indication of weekly price change for high-demand products (HDPs) has been developed, covering the period 16 March to 12 July 2020. A timeline of developments for these indicators can be found in Online price changes of HDPs methodology. This analysis is experimental and should not be compared with our regular consumer price statistics.
Note that there have been further updates to the classification of anti-bacterial wipes and spray cleaning products, causing the back series for these products to be revised. This will also have a small impact on the back series for all household and hygiene goods and all HDP items.
Figure 6: Prices for household and hygiene goods fell by 0.8% in the latest week while prices for food rose by 0.5%
Online price change of high-demand products, UK, percentage change between week 16 (29 June to 5 July) and week 17 (6 to 12 July)
Source: Office for National Statistics – Faster indicators
Notes:
- More information on the strengths and limitations of the online price changes data is available in the Online price changes for high-demand products methodology article.
Download this chart Figure 6: Prices for household and hygiene goods fell by 0.8% in the latest week while prices for food rose by 0.5%
Image .csv .xlsFigure 6 shows the prices for all household and hygiene goods have fallen by 0.8% while prices for all food rose by 0.5% in the latest week (6 to 12 July) compared with the previous week (29 June to 5 July).
The downward movement in all household and hygiene goods was driven by four items falling by more than 1% in week 17: kitchen rolls, spray cleaning, tissues and nappies. All downward movements are driven by one or two retailers reducing the price; however, we are unable to conclude whether this is driven by sales on a number of these products or a longer-term price reduction.
Figure 7 shows that prices for all food items have increased for the first time since the week commencing 18 May, driven by an increase in the price of long-life milk, which has a high expenditure weight. This is explained by one retailer returning long-life milk to its normal price from a sale in the week commencing 15 June. Figure 7 also shows that kitchen rolls have shown a notable downward trend over time, decreasing in price for the tenth consecutive week since 27 April.
Figure 7: Prices for food have increased for the first time since 18 May, driven by an increase in the price of long-life milk
Online price change of selected high-demand products, UK, 16 March to 12 July: index week 1 (16 to 22 March) = 100
Source: Office for National Statistics – Faster indicators
Notes:
- Index movements may not be exactly the same as percentage changes shown in Figure 6 as a result of rounding.
- Week 1 refers to the period 16 to 22 March 2020, and week 17 refers to the period 6 July to 12 July 2020.
- The time series for all individual high-demand product (HDP) items are published in a dataset alongside this release.
Download this chart Figure 7: Prices for food have increased for the first time since 18 May, driven by an increase in the price of long-life milk
Image .csv .xls7. Shipping
These shipping indicators are based on counts of all vessels, cargo and tanker vessels, and passenger vessels. As discussed in Faster indicators of UK economic activity: shipping, we expect the shipping indicators to be related to the import and export of goods.
Figure 8: Daily visits of all ships remained stable with an average of 377 daily visits between 6 and 12 July, compared with 372 average daily visits in the week before
Daily movements in shipping visits, seasonally adjusted, UK, 1 January to 12 July 2020
Source: exactEarth
Notes:
- The number of visits for Hull are included in these data from 1 June 2020 onwards.
- The seasonally adjusted and trend estimates are estimated using a modified version of the seasonal adjustment method TRAMO-SEATS. More information is available in the Coronavirus and the latest indicators for the UK economy and society methodology
- The seasonal adjustment method may be limited as this is a short time series, it will be fine-tuned in future releases.
- Daily and weekly shipping visits and unique visits are available by port in the dataset, along with non-seasonally adjusted aggregate series.
Download this chart Figure 8: Daily visits of all ships remained stable with an average of 377 daily visits between 6 and 12 July, compared with 372 average daily visits in the week before
Image .csv .xlsOn a seasonally adjusted basis, daily visits of all ships remained stable with an average of 377 visits over the most recent week, 6 to 12 July 2020, which compares with an average of 372 in the previous week. Visits of passenger ships also remained stable with an average of 78 visits in the most recent period. Cargo and tanker visits fell slightly, from an average of 108 visits the week before to 93 visits between 6 and 12 July.
Nôl i'r tabl cynnwys8. Data
Weekly and daily shipping indicators
Dataset | Released 16 July 2020
The weekly and daily shipping indicators dataset associated with the faster indicators of UK economic activity.
Online price changes for high-demand products
Dataset | Released 16 July 2020
Weekly online price changes of selected high-demand products (HDPs).
Online job advert estimates
Dataset | Released 16 July 2020
Experimental job advert indices covering the UK job market.
Business Impact of Coronavirus (COVID-19) Survey (BICS) results
Dataset | Released 16 July 2020
Final results from the Business Impact of Coronavirus (COVID-19) Survey (BICS). This qualitative fortnightly survey covers business turnover, workforce, prices and trade. This dataset includes additional information collected as part of the survey including details on prices and imports and exports, which are not included within this bulletin or the Coronavirus and the economic impacts on the UK bulletin.
9. Glossary
Faster indicator
A faster indicator provides insights into economic activity using close-to-real-time big data, administrative data sources, rapid response surveys or experimental statistics, which represent useful economic and social concepts.
High-demand product (HDP) basket
The high-demand product (HDP) basket contains everyday essential items that were identified at the beginning of the crisis to have high consumer demand, including items from food, health and hygiene categories. The selection of these items was based on anecdotal evidence on patterns of consumer spend. The basket does not cover all items within these categories.
Nôl i'r tabl cynnwys10. Measuring the data
An overall footfall index has been added for the first time this week. The overall index is the sum of the average footfall in each destination type (high streets, retail parks and shopping centres) weighted by their respective footfall volumes.
Detailed information on the data sources, quality and methodology of the different indicators included in this bulletin is available in the Coronavirus and the latest indicators for the UK economy and society methodology.
We will summarise any crucial updates to the quality or methodology in this section in the future.
Nôl i'r tabl cynnwys11. Strengths and limitations
Detailed information on the strengths and limitations of the different indicators included in this bulletin is available in the Coronavirus and the latest indicators for the UK economy and society methodology.
We will summarise any crucial updates or warnings in this section in the future.
Nôl i'r tabl cynnwys
3. Social impacts of the coronavirus on Great Britain
This section includes some headline results from Wave 17 of the Opinions and Lifestyle Survey (OPN) covering the period 8 to 12 July 2020. The full results will be published in Coronavirus and the social impacts on Great Britain on 17 July 2020.
Figure 3 shows that in the most recent week, the proportion of adults who went shopping for things other than basic necessities increased to 19%, from 13% in the previous week. This continues a trend of increasing non-essential shopping, from just 5% of adults four weeks previously. In contrast, the proportion of adults who went shopping for essential products decreased to 68% from 70% the week before.
Between 8 and 12 July, the proportion of working adults travelling to work reached 50% for the first time since lockdown was announced. The proportion exclusively working from home saw a small decrease to 27%.
Figure 3: The proportion of adults shopping for things other than basic necessities increased to 19% from 13% in the previous week
Proportion of adults, Great Britain, 20 March to 12 July 2020
Source: Office for National Statistics – Opinions and Lifestyle Survey
Notes:
Download this chart Figure 3: The proportion of adults shopping for things other than basic necessities increased to 19% from 13% in the previous week
Image .csv .xls