Cynnwys
- Main points
- Latest indicators at a glance
- Business impact of the coronavirus
- Social impacts of the coronavirus on Great Britain
- Value Added Tax (VAT) returns
- Company incorporations and voluntary dissolution applications Incorporations
- Online job adverts
- Online price change in the food and drink basket
- Footfall
- Roads and traffic camera data
- Shipping
- Data
- Glossary
- Measuring the data
- Strengths and limitations
- Related links
1. Main points
- According to the latest Business Impact of Coronavirus (COVID-19) Survey, nearly half (48%) of currently trading businesses reported that their turnover had decreased below what is normally expected for this time of year. See Section 3.
- The proportion of adults who travelled to work was 65%, the highest since the series began, according to the latest Opinions and Lifestyle Survey. See Section 4.
- According to VAT returns, in Quarter 3 (July to Sept) 2020, around 23,000 more firms reported increasing turnover than decreasing turnover, compared with Quarter 2 (Apr to June) 2020. See Section 5.
- However, when compared with the same quarter a year ago, more firms are seeing decreasing turnover rather than increasing turnover, meaning turnover has not returned to February 2020 levels, before the impact of the coronavirus (COVID-19) pandemic. See Section 5.
- Between 2 and 9 October 2020, total online job adverts increased from 61% to 63% of their 2019 average, their highest recorded level since 3 April 2020. See Section 7.
- Prices of items in the food and drink basket increased by 0.1% in the latest week, with spirits being the main driver of the weekly change. See Section 8.
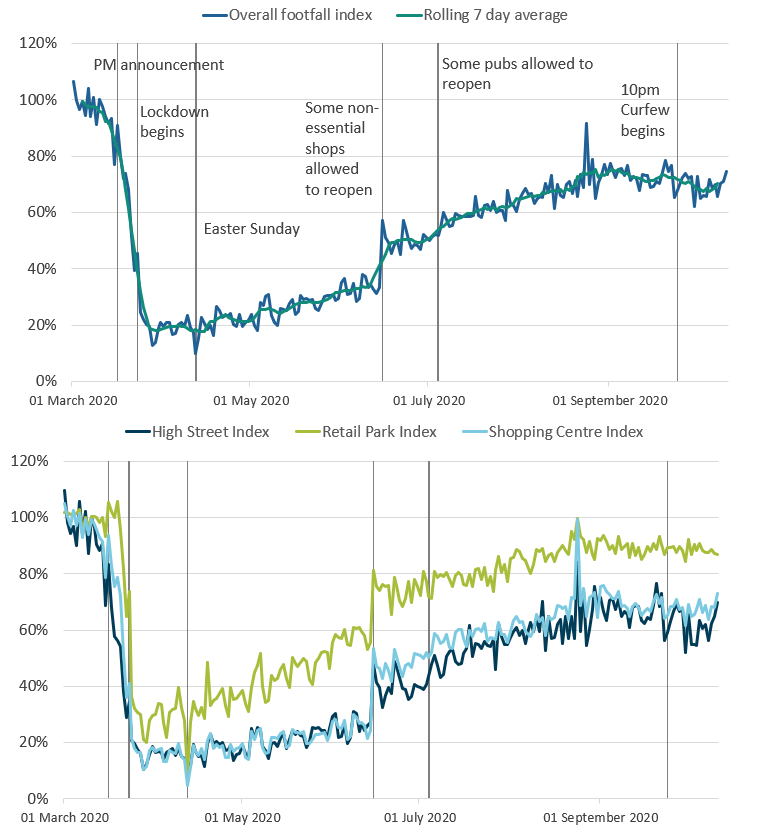
- In the week ending 11 October 2020, overall footfall increased to around 70% of its level in the same period of the previous year, with high streets showing the largest weekly increase. See Section 9.
- In the week ending 11 October 2020, counts of cars, pedestrians and cyclists in London increased on the previous week to around the same average level seen pre-lockdown, according to traffic camera data. See Section 10.
Results presented throughout this bulletin are experimental. Note weekly Energy Performance Certificate (EPC) data are not included in this release because of the switching over of the Energy Performance of Buildings Register. EPC figures will be included in future weeks.
2. Latest indicators at a glance
Table 1: Faster Indicators Summary Dashboard
Embed code
Source: Office for National Statistics – Faster indicators (Hover over indicator column for source)
Notes:
- The latest estimate of the proportion of the workforce on furlough leave is an unweighted initial estimate, therefore not directly comparable to the weighted back data. The final weighted estimate will be available next week.
5. Value Added Tax (VAT) returns
This section contains:
- the number of new firms reporting their Value Added Tax (VAT) returns up to September 2020
- the latest quarterly turnover diffusion indices by industry up to Quarter 3 (July to Sept) 2020; 260,030 firms reported their turnover returns to Her Majesty’s Revenue and Customs (HMRC) in Quarter 3
- the latest monthly turnover diffusion indices by industry up to August 2020, where 36,060 firms have reported their turnover to HMRC
New reporters
The new reporters index measures the number of firms sending VAT returns for the first time, which is related to the number of firm creations.
Figure 2: In September 2020, there were 18,130 new VAT reporters, continuing the pick-up in the months of Quarter 3 (July to Sept) 2020 following a drop in Quarter 2 (April to June) 2020
The number of new firm reporters, January 2015 to September 2020, non-seasonally adjusted
Source: Her Majesty’s Revenue and Customs
Download this chart Figure 2: In September 2020, there were 18,130 new VAT reporters, continuing the pick-up in the months of Quarter 3 (July to Sept) 2020 following a drop in Quarter 2 (April to June) 2020
Image .csv .xlsThe level of new VAT reporters has not returned to the normal levels seen before the impact of the coronavirus (COVID-19) pandemic, and this could be a result of the composition of business births. Experimental evidence from the Inter-Departmental Business Register (IDBR) on business demography up to Quarter 3 (July to Sept) published today, shows that the types of businesses being created during the pandemic are on average smaller and may therefore not be included in the VAT reporters data.
Business VAT turnover estimates
Turnover diffusion indices are an aggregate measure used to track whether the majority of firms are reporting an increase or decrease in turnover in their VAT returns. They are calculated as the percentage of firms with increasing turnover minus the percentage with decreasing turnover.
Estimates are based on matched businesses who have responded in both periods of interest. If a business uses the VAT deferral scheme, they should continue to submit VAT returns as normal; therefore, the volume of VAT returns should not be affected. The number of business returns in the most recent period are a little lower than normal, but this should not have an impact on the interpretation of the results.
The heatmap in Figure 3 is a visual way of showing the VAT diffusion indices based on the standard deviation from their historical 2008 to 2019 average. Larger deviations are more darkly coloured, with red representing a negative change, and teal a positive change, when compared with the previous period.
The monthly estimate of gross domestic product (GDP) for August 2020 was published on Friday 9 October 2020. September 2020 estimates of Retail sales in Great Britain will be published on 23 October 2020. It is important to note that the timely VAT indicators are not attempting to forecast or predict GDP or other headline economic statistics, and the indicators should not be interpreted in this way.
Figure 3: In Quarter 3 (July to Sept) 2020, around 23,000 more firms reported increasing turnover than decreasing turnover at the total industry level when compared with the previous quarter
UK
Embed code
Source: Her Majesty’s Revenue and Customs
Notes
- Agri - Agriculture, forestry and fishing, All - All industries, SA - Seasonally adjusted, NSA - Not seasonally adjusted.
- All industries are unweighted: each firm contributing to the index has the same weight regardless of turnover, size or industry.
- The thresholds for the colours in the heatmap are based on standard deviations from the mean of the indicator between 2008 and 2019.
Figure 3 shows that in Quarter 3 (July to Sept) 2020, compared with the previous quarter, the all-industry diffusion index was 3.9 standard deviations above its historical average from 2008 to 2019 with a diffusion index of 0.09 (teal). That is, out of the 260,030 firms who reported their turnover between Quarter 2 and Quarter 3 2020, around 23,000 more firms saw their turnover increase than firms who saw their turnover decrease. The positive Quarter 3 figure was driven by increases in turnover compared with Quarter 2 across all the major sectors, with services increasing 3.2 standard deviations above its historical average from 2008 to 2019.
However, Quarter 3 2020 business turnover when compared with Quarter 3 2019 is 3.6 standard deviations below its historical average (red), which indicates far more firms across all major industries are seeing decreasing turnover rather than increasing turnover when compared with the same period a year ago.
Figure 3 also shows that the month-on-month all-industry turnover diffusion index for August 2020 compared with July 2020 was steady at 0.1 standard deviations above its historical 2008 to 2019 average (white), with a diffusion index of 0.00. That is, out of the 36,060 firms who reported monthly turnover between July and August 2020, almost an equal number of firms saw their turnover increase as firms who saw their turnover decrease. Across all major industries (services, production, construction), turnover indices remained positive in August 2020 compared with the month before, except for the agricultural industry where more firms saw their turnover decrease rather than increase.
A disparity in the monthly business turnover story is also apparent in the August 2020 month-on-year comparison with August 2019. While the month-on-month analysis suggests business turnover has seen a partial recovery, more businesses are seeing decreasing turnover than increasing turnover when compared with the same month a year ago, meaning turnover has not returned to the levels seen before the impact of the pandemic.
Please note, the monthly and quarterly diffusion indices can exhibit different trends, as only a subset of firms contributes towards the monthly diffusion indices. Quarterly returns are allocated to the calendar quarter in which two or more of the months lie. For example, a quarterly return covering the period June 2020 to August 2020 will be allocated to Quarter 3 2020. At this stage of the quarterly data cycle, there is limited information about September 2020 feeding into the Quarter 3 2020 estimates.
For more information on how the quarterly reporting periods are derived, see VAT reporting periods in Section 2 of the VAT methodology article. The number of firms contributing towards each of the diffusion indices is published in the dataset.
Nôl i'r tabl cynnwys6. Company incorporations and voluntary dissolution applications Incorporations
Figure 4: In the week ending Friday 9 October 2020, there was a total of 18,420 company incorporations, which remains higher than the same week the previous year (13,259)
Total weekly company incorporations, UK, from week ending Friday 4 January 2019 to Friday 9 October 2020
Source: Companies House and Office for National Statistics
Notes:
- The dip in December 2019 is explained by two bank holidays in the week ending Friday 27 December 2019.
- Weekly data are for week commencing Saturday to Friday, as incorporation requests received on Saturdays and Sundays are typically processed on subsequent weekdays. For more information, see the accompanying Companies House methodology page.
Download this chart Figure 4: In the week ending Friday 9 October 2020, there was a total of 18,420 company incorporations, which remains higher than the same week the previous year (13,259)
Image .csv .xlsThe latest experimental estimates of new Value Added Tax (VAT) reporters in Section 5 of this release, and Experimental Statistics of business demography from the Inter-Departmental Business Register (IDBR) published today also cover business creation. This has increased in Quarter 3 (July to September) 2020 compared with Quarter 2 (Apr to June) 2020.
However, there are differences between the methodologies and definitions. Some types of company are present with Companies House but not on the IDBR or in VAT returns, such as single-person limited companies. For more details, see the Companies House methodology page.
Voluntary dissolution applications
Figure 5: In the week ending Friday 9 October 2020, there was a total of 4,993 voluntary dissolution applications, lower than the same week the previous year (5,697)
Total weekly company voluntary dissolution applications, UK, from week ending Friday 4 January 2019 to week ending Friday 9 October 2020
Source: Companies House and Office for National Statistics
Notes:
- The dip in December 2019 is explained by two bank holidays in the week ending Friday 27 December 2019.
- Weekly data are weeks from Saturday to Friday, as voluntary dissolution requests received on Saturdays and Sundays are typically processed on subsequent weekdays. For more information, see the accompanying Companies House methodology page.
Download this chart Figure 5: In the week ending Friday 9 October 2020, there was a total of 4,993 voluntary dissolution applications, lower than the same week the previous year (5,697)
Image .csv .xlsFor more information on other measures of company closures not presented here, see Weekly indicators of company creations and closures from Companies House methodology: August 2020.
Nôl i'r tabl cynnwys7. Online job adverts
These figures use job adverts provided by Adzuna, an online job search engine, and include experimental estimates of online job adverts by Adzuna category and by UK country and NUTS1 region.
The number of job adverts over time is an indicator of the demand for labour. The Adzuna categories used do not correspond to Standard Industrial Classification (SIC) categories, so these values are not directly comparable with the Office for National Statistics (ONS) Vacancy Survey.
Figure 6: Between 2 and 9 October 2020, total online job adverts increased from 61% to 63% of their 2019 average, their highest recorded level since 3 April 2020
Total weekly job adverts on Adzuna, UK, 4 January 2019 to 9 October 2020: index 2019 average = 100
Embed code
Notes:
- The observations were collected on a roughly weekly basis; however, before June 2020 they were not all observed at the same point in each week, leading to slightly irregular gaps between some observations.
- These series have a small number of missing weeks, mostly in late 2019, and the latest is in January 2020. These values have been imputed using linear interpolation. The data points that have been imputed are clearly marked in the accompanying dataset.
- Further category breakdowns are included in the Online job advert estimates dataset, and more details on the methodology can be found in Using Adzuna data to derive an indicator of weekly vacancies.
In the latest week, the total volume of online job adverts increased by two percentage points to 63% of its 2019 average, reaching above 60% for the second consecutive week. Note there may be a seasonal component to this increase, as it is consistent with the previous year’s trend. Online job adverts increased in 20 of the 28 Adzuna categories, excluding the “unknown” category, and decreased in seven categories.
Of the categories featured above, online job adverts in healthcare and education each saw the largest increase by four percentage points, to 95% and 80% of their 2019 averages respectively. Healthcare also had the highest volume of online job adverts compared with their 2019 average.
However, online job adverts did not increase in all categories. Catering and hospitality saw a decrease of five percentage points to 32% of its 2019 average, which is the second consecutive week that it has decreased.
Figure 7: The volume of job adverts increased in nearly every country and English region of the UK
Total weekly job adverts on Adzuna, UK, 4 January 2019 to 9 October 2020, index 2019 average = 100, percentage points
Embed code
Notes:
- There is a level shift in the Northern Ireland series from 17 October 2019 due to a large source of Northern Ireland job adverts being removed, and another level shift from 7 August 2020 because of a new source being included.
The volume of job adverts increased in nearly every country and English region (NUTS1) of the UK. The East Midlands and West Midlands each saw the largest increase by three percentage points. Job adverts declined in both Wales and Northern Ireland, with the latter having the largest decrease by two percentage points to 67% of their 2019 average.
The two regions with the highest volume of online job adverts compared with the 2019 average were the East Midlands (at 83% of their 2019 average) followed by the North East (76% of their 2019 average). London remained the region with the lowest volume of job adverts at 51% of their 2019 average.
Nôl i'r tabl cynnwys8. Online price change in the food and drink basket
A timely indication of weekly online price change for a selection of food and drink products from several large UK retailers has been developed, covering the period 1 June to 11 October 2020. Details of the methodology used for these indicators can be found in Online price changes methodology. This analysis is experimental and should not be compared with our regular consumer price statistics.
The time series, weekly growth rates and contributions to the weekly change for all individual food and drink items along with sample sizes are published in a dataset alongside this release.
Online prices of items in the food and drink basket increased overall by 0.1% between Week 18 and Week 19. Figure 8 presents the contributions to this weekly change from each of the main categories of items.
The largest contribution to the weekly change was identified in the category of spirits (0.08 percentage points), followed by mineral waters, soft drinks and juices (0.04 percentage points) and sugar, jam, syrup, chocolate and confectionery (0.03 percentage points). Meat had a negative contribution of 0.03 percentage points.
Figure 8: Prices of items in the food and drink basket increased by 0.1% in the latest week, with spirits being the main driver of the weekly change
Contributions to online price change of a selection of food and drink products, UK, percentage point contributions to the percentage change between Week 18 (28 September to 4 October) and Week 19 (5 October to 11 October)
Source: Office for National Statistics – Online price collection
Notes:
- Contributions may not always sum to the weekly change, as a result of rounding.
Download this chart Figure 8: Prices of items in the food and drink basket increased by 0.1% in the latest week, with spirits being the main driver of the weekly change
Image .csv .xlsSpirits prices increased by 1.5% in the latest week, primarily driven by price increases for whisky, which contributed 0.69 percentage points towards the weekly change, and gin, which contributed 0.41 percentage points to the weekly change.
Prices for mineral waters, soft drinks and juices increased by 0.7% in the latest week, with the largest combined contribution of 0.44 percentage points coming from fizzy drinks and energy drinks.
Prices for sugar, jam, syrup, chocolate and confectionary increased by 0.4% in the latest week, with the largest combined contribution of 0.43 percentage points coming from ice cream and chocolate.
Meat had the largest offsetting effect against the overall weekly growth, with prices decreasing by 0.2%. The largest combined contribution came from bacon, ham and continental deli meat (negative 0.24 percentage points), partially offset by price increases for a few products, the largest being meat snacks, which alone contributed 0.05 percentage points.
Figure 9, with the time series for the all-item index and for the leading categories of growth in Week 19, shows that while prices have been falling across much of the period, over the last three weeks they have started to rise again, partly led by the large price increases for the categories shown in Figure 9. However, prices overall remain below their starting point at the beginning of June.
Figure 9: The all item index has remained below its Week 1 level (1 June) for the entire time series, but has been rising in the latest 3 weeks
Online price change of selected food and drink products 1 June to 11 October 2020
Source: Office for National Statistics – Online price collection
Notes:
- Week 1 refers to the period 1 to 7 June 2020, and Week 19 refers to the period 5 October to 11 October.
- The time series for all individual food and drink items are published in a dataset alongside this release.
Download this chart Figure 9: The all item index has remained below its Week 1 level (1 June) for the entire time series, but has been rising in the latest 3 weeks
Image .csv .xls9. Footfall
These figures are provided by Springboard, a provider of data on customer activity. They measure the volume of footfall compared with the same day the previous year at the overall level and across the categories of high streets, retail parks and shopping centres. For example, Tuesday 14 July 2020 was compared with Tuesday 16 July 2019.
Figure 10: In the week ending 11 October, overall footfall increased to around 70% of its level in the same period of the previous year, with high streets showing the largest weekly increase
Volume of footfall, year-on-year percentage change between footfall on the same day, UK, 1 March to 11 October 2020
Source: Springboard and the Department for Business, Energy and Industrial Strategy
Notes:
- “PM announcement” refers to the advisory announcement on 16 March 2020 to avoid non-essential travel, bars, restaurants and other indoor leisure venues, and to work from home if possible.
- Many non-essential shops were allowed to open on 15 June 2020 in England, 12 June 2020 in Northern Ireland and 22 June 2020 in Wales. In Scotland, some non-essential shops were allowed to reopen from 29 June 2020 and more from 13 to 15 July 2020.
- The spike on Monday 24 August was caused by the comparison with 26 August 2019 last year, which was bank holiday Monday with good weather. The bank holiday this year was a week later on 31 August.
- Pubs were allowed to reopen on 4 July in both England and Northern Ireland, with beer gardens allowed to reopen on 6 July in Scotland and 13 July in Wales. Pubs were also allowed to reopen indoors in Scotland on 15 July.
- Hospitality venues are required to close by 10pm from 24 September in England and Wales, and 25 September in Scotland. In Northern Ireland they are required to close by 11pm from 30 September.
Download this image Figure 10: In the week ending 11 October, overall footfall increased to around 70% of its level in the same period of the previous year, with high streets showing the largest weekly increase
.PNG (101.7 kB)
Figure 11: In the week ending 11 October, footfall increased in seven of the ten featured countries and regions, with the largest increase in the South West
Overall volume of daily footfall, percentage change from the same day the previous year, UK, 1 March to 11 October 2020

Source: Springboard and the Department for Business, Energy and Industrial Strategy
Notes:
- The spike in England and Wales on 24 August was caused by comparing 24 August 2020 with 26 August 2019, which was a bank holiday.
Download this image Figure 11: In the week ending 11 October, footfall increased in seven of the ten featured countries and regions, with the largest increase in the South West
.png (186.6 kB)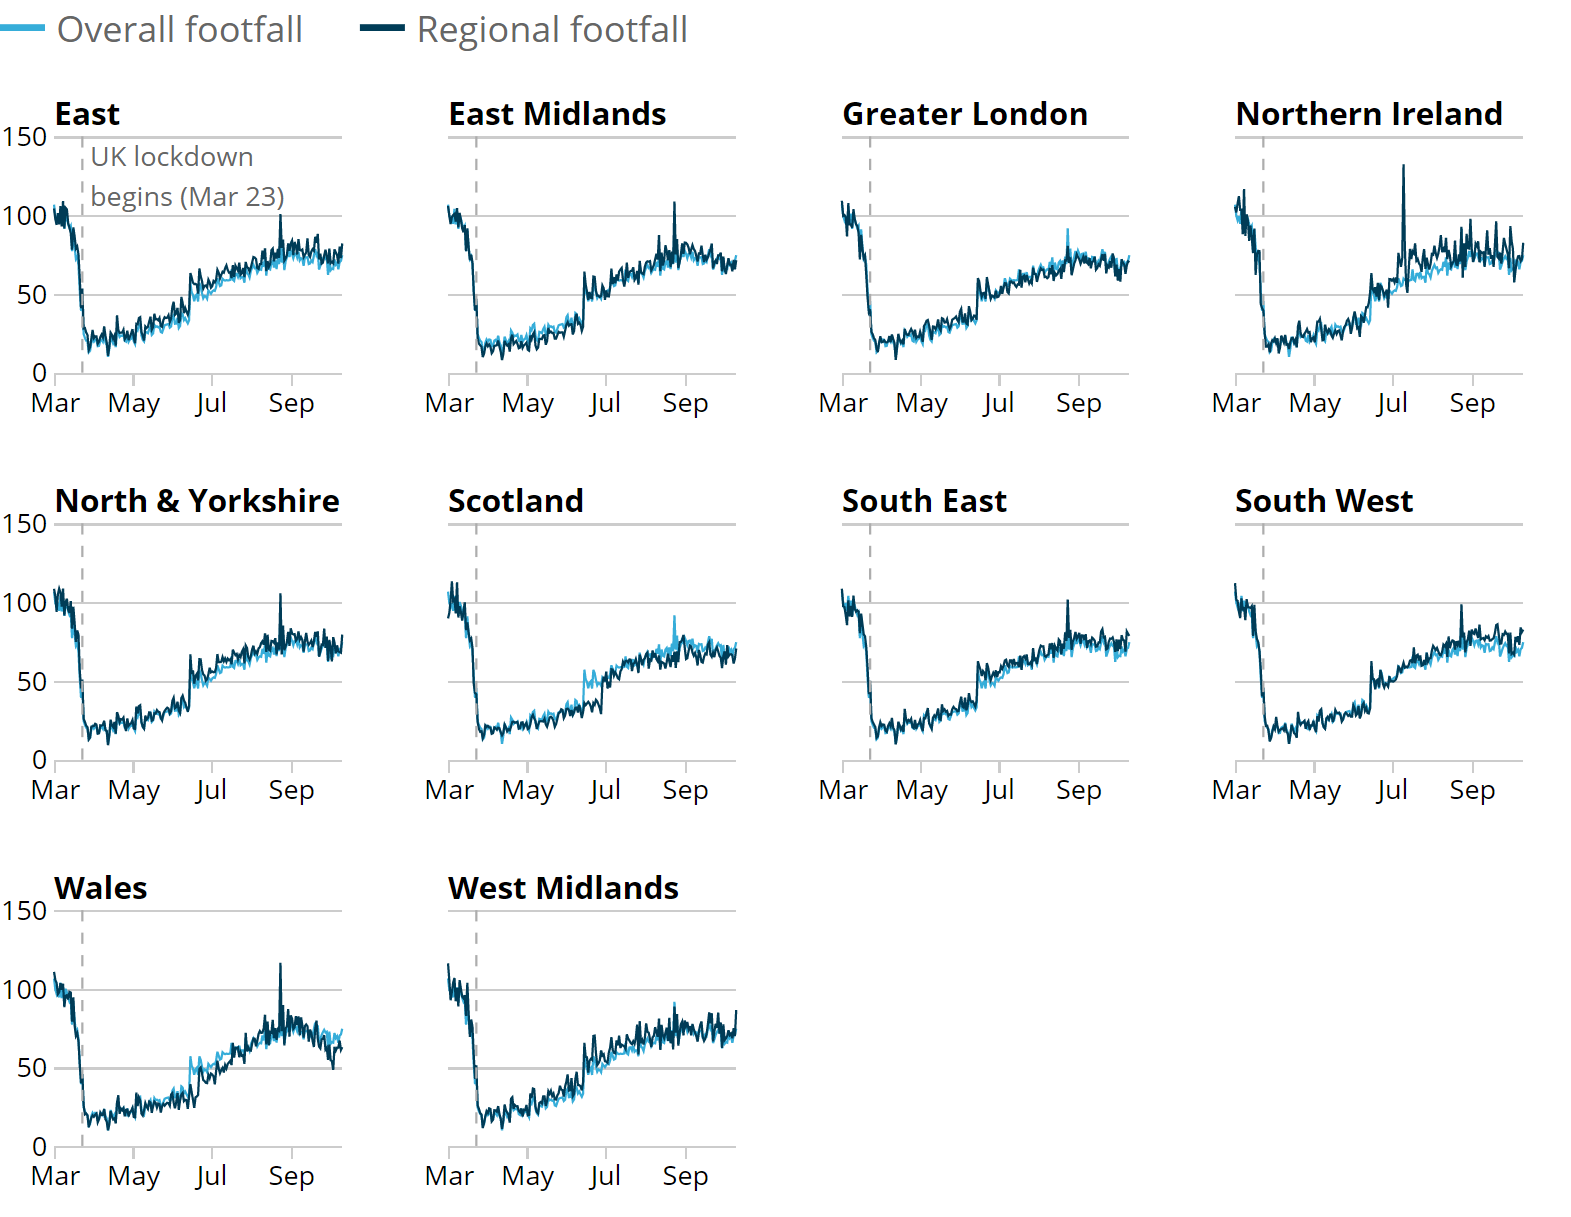
Figure 11 shows the volume of footfall in each English region and UK country compared with the same day the previous year. In the most recent week, most countries and regions saw an increase in this measure, compared with the previous week. The largest increase was in the South West followed by Wales. However, there was a moderate decrease in footfall in Northern Ireland.
In the latest week, the highest level of footfall in comparison with the same period the previous year was also in the South West, followed by the South East. The lowest levels of footfall were seen in Wales, Scotland and Greater London, unchanged from the previous week.
At the time of publication, local lockdowns were in force in several of the affected regions. A full list of local lockdowns is available from the Department of Health and Social Care for England, from the Scottish Government for Scotland, the Welsh Government for Wales and from nidirect for Northern Ireland. Note that other factors may influence footfall including poor weather.
Nôl i'r tabl cynnwys10. Roads and traffic camera data
Road traffic in Great Britain
The Department for Transport (DfT) produces daily road traffic estimates using data from around 275 automatic traffic count sites across Great Britain covering all road types, which are published weekly.
The daily DfT estimates are indexed to the first week of February 2020 and the comparison is to the same day of the week. The data provided are useful as an indication of traffic change rather than actual traffic volumes. More information on the methods, quality and economic analysis for these indicators can be found in the transport data methodology article.
Figure 12: On Monday 12 October, the volume of all motor vehicle traffic was eleven percentage points below the levels seen on the first Monday of February. It has now fallen for the fourth consecutive week
Daily road traffic index: 100 = same traffic as the equivalent day of the week in the first week of February, 1 March 2020 to 12 October 2020, non-seasonally adjusted
Source: Department for Transport – Road traffic statistics: management information
Notes:
- Vertical lines indicate bank holidays.
- The initial large decline in road traffic coincided with the introduction of the national lockdown on 23 March 2020.
Download this chart Figure 12: On Monday 12 October, the volume of all motor vehicle traffic was eleven percentage points below the levels seen on the first Monday of February. It has now fallen for the fourth consecutive week
Image .csv .xlsFigure 12 shows road traffic across total motor vehicles has fallen slightly in recent weeks. It remains below levels seen in the first week of February 2020.
On Monday 12 October 2020, car traffic had fallen to 15 percentage points lower than the equivalent Monday in the first week of February 2020.
However, heavy vehicle and light commercial vehicle traffic have both remained stable and are slightly above traffic seen on the equivalent Monday in the first week of February 2020.
Traffic camera activity
Traffic cameras are a valuable source for understanding the level of activity in towns and cities as well as changing patterns of mobility. The UK has thousands of publicly accessible traffic cameras with providers ranging from national agencies to local authorities. Further information on the methodology used to produce these data is available in our methodology article and Data Science Campus blog.
In the accompanying dataset, the following categories are available as non-seasonally adjusted, seasonally adjusted and trend data: cars, motorbikes (only available for London and the North East), buses, trucks, vans, pedestrians and cyclists.
The categories are available for the following regions, which gives a broad coverage across the UK and represents a range of different-sized settlements in urban and rural settings:
Figure 13: In the week ending 11 October, counts of cars, pedestrians and cyclists in London increased on the previous week to around the same average level seen pre-lockdown
Activity in selected areas, daily counts of cars, buses, pedestrians and cyclists, seasonally and non-seasonally adjusted, UK, March to October 2020
Embed code
Source: Transport for London, North East Traffic, TrafficWatchNI
Notes:
- The regions shown here were selected to be representative of the regions available (see list in the previous text).
- 31 August was a bank holiday.
- Traffic camera images capture the appearance of buses, but they give no indication of the number of passengers using public transport.
- Pre-lockdown averages calculated from when the series started (11 March for London, 1 March for the North East) to 22 March.
In the latest week ending 11 October 2020, counts of buses in London increased on the previous week to around 94% of the average level seen pre-lockdown. Please note this gives no indication of the number of passengers onboard. Counts of pedestrians and cyclists, trucks and vans have all returned to around the same average level of counts seen pre-lockdown.
In the North East of England, counts of cars have also increased to 94% of the average level seen pre-lockdown, while pedestrian and cyclist traffic remains around 80%.
In Northern Ireland, although data collection did not start until 15 May 2020, counts of buses continue to show a gradual increase, whereas cars, and pedestrians and cyclists show a decline when compared with the previous week.
Nôl i'r tabl cynnwys11. Shipping
These shipping indicators are based on counts of all vessels and cargo and tanker vessels. As discussed in Faster indicators of UK economic activity: shipping, we expect the shipping indicators to be related to the import and export of goods.
Figure 14: In the week ending 11 October 2020, the average number of daily ship visits remains stable when compared with the previous week, at 292 visits
Daily movements in shipping visits, UK, seasonally adjusted, 1 January 2020 to 11 October 2020
Source: exactEarth
Download this chart Figure 14: In the week ending 11 October 2020, the average number of daily ship visits remains stable when compared with the previous week, at 292 visits
Image .csv .xls
Figure 15: In the week ending 11 October, the average daily number of visits for cargo ships was relatively stable when compared with the previous week, at 95 visits
Daily movements in shipping visits, UK, seasonally adjusted, 1 January 2020 to 11 October 2020
Source: exactEarth
Notes:
- The vertical lines indicate key events. In order, the events are: Storm Ciara; FCO advises against all non-essential international travel; Lockdown begins; UK international travel quarantine begins; travel corridors to 59 countries come into force; Storm Ellen; Storm Francis; Storm Alex.
- The number of visits for Hull are included in these data from 1 June 2020 onwards.
- The seasonally adjusted and trend estimates are estimated using a modified version of the seasonal adjustment method TRAMO-SEATS. More information is available in the Coronavirus and the latest indicators for the UK economy and society methodology.
- The seasonal adjustment method may be limited as this is a short time series.
- Daily and weekly shipping visits and unique visits are available by port in the dataset, along with non-seasonally adjusted aggregate series.
Download this chart Figure 15: In the week ending 11 October, the average daily number of visits for cargo ships was relatively stable when compared with the previous week, at 95 visits
Image .csv .xls12. Data
Weekly and daily shipping indicators
Dataset | Released 15 October 2020
The weekly and daily shipping indicators dataset associated with the faster indicators of UK economic activity.
Online job advert estimates
Dataset | Released 15 October 2020
Experimental job advert indices covering the UK job market.
Traffic camera activity
Dataset | Released 15 October 2020
Experimental dataset for busyness indices covering the UK.
Online weekly price changes
Dataset | Released 15 October 2020
The online price changes for a selection of food and drink products from several large UK retailers. These data are experimental estimates developed to deliver timely indicators to help understand the impact of the coronavirus (COVID-19) pandemic.
Economic activity, faster indicators, UK
Dataset | Released 15 October 2020
Data on road traffic and Value Added Tax (VAT) data from HM Revenue and Customs (HMRC).
13. Glossary
Company incorporations
Incorporations are when a company is added to the Companies House register of limited companies. This can also include where an existing business applies to become a limited company, where it was not one before.
Diffusion index
The diffusion index tracks the growth in turnover and expenditure of firms. It is constructed to lie between negative one and one. For example, if 65% of firms have increasing turnover, 30% have decreasing turnover and 5% turnover remains unchanged, then the diffusion index is 0.35.
Faster indicator
A faster indicator provides insights into economic activity using close-to-real-time big data, administrative data sources, rapid response surveys or Experimental Statistics, which represent useful economic and social concepts.
New reporter
A new reporter is defined as a firm with a VAT reference (that is, firm identification number) which has not previously reported its VAT returns. New reporters are published within one month of the end of the reporting period.
The new reporting behaviour measure is classified by the month the data were received by HMRC, known as the receipt date, which is not necessarily the same as the reference period (the period for which the VAT return is made).
A business must register for VAT with HM Revenue and Customs (HMRC) if its VAT taxable turnover, that is the total value of everything it sells that is not exempt from VAT, is more than £85,000 in a rolling 12-month period. As such, the number of new reporters detailed here are not directly comparable with the number of company incorporations shown in our section on Companies House data, which shows when a company is added to the Companies House register of limited companies.
For more information please see the methodology article on Value Added Tax returns
Voluntary dissolution applications
A voluntary dissolution application is when a company applies to begin dissolution proceedings. As such, they effectively chose to be removed from the Companies House register. For a company to be eligible to voluntarily dissolve, it should not have completed any trading activity for a period of three months.
Nôl i'r tabl cynnwys14. Measuring the data
Detailed information on the data sources, quality and methodology of the different indicators included in this bulletin is available in the Coronavirus and the latest indicators of the UK economy and society methodology.
We will summarise any crucial updates to the quality or methodology in this section in the future.
Nôl i'r tabl cynnwys15. Strengths and limitations
Detailed information on the strengths and limitations of the different indicators included in this bulletin is available in the Coronavirus and the latest indicators of the UK economy and society methodology.
We will summarise any crucial updates or warnings in this section in the future.
Nôl i'r tabl cynnwys
4. Social impacts of the coronavirus on Great Britain
This section includes some headline results from Wave 28 of the Opinions and Lifestyle Survey (OPN) covering the period 7 to 11 October 2020.
Figure 1 shows that the proportion of adults who travelled to work was 65%, the highest since the series began and an increase of four percentage points from the previous period. Conversely, the proportion of people who had not worked from home or travelled to work decreased by five percentage points, to 12%, the lowest since the series began.
The proportion of adults who had used a face covering in the previous week when leaving home remained at 98% for the second consecutive week. Further breakdowns such as the situations when a face covering was worn (for example while shopping) and by the different countries of Great Britain, will be available in Coronavirus and the social impacts on Great Britain published on 16 October 2020.
Figure 1: The proportion of adults who travelled to work was 65%, the highest since the series began
Proportion of adults, Great Britain, 14 May to 11 October 2020
Source: Office for National Statistics - Opinions and Lifestyle Survey
Notes:
Download this chart Figure 1: The proportion of adults who travelled to work was 65%, the highest since the series began
Image .csv .xls