Cynnwys
- Introduction
- How is the UK population changing?
- How do changes in the UK population compare with the rest of the world?
- What has caused population ageing?
- What are the implications of an ageing population?
- How many older people work and has this changed?
- How do incomes of older people compare with younger ages?
- What does an ageing population mean for public spending?
- What are the implications of living longer for services?
- What are the implications of living longer for health services?
- What are the implications of living longer for social care services?
- What are the implications of living longer for society and the individual?
- How well connected are older people?
- How do older people feel about their risk of crime?
- How diverse are older people?
- How do we understand all the implications of living longer?
- Sources
1. Introduction
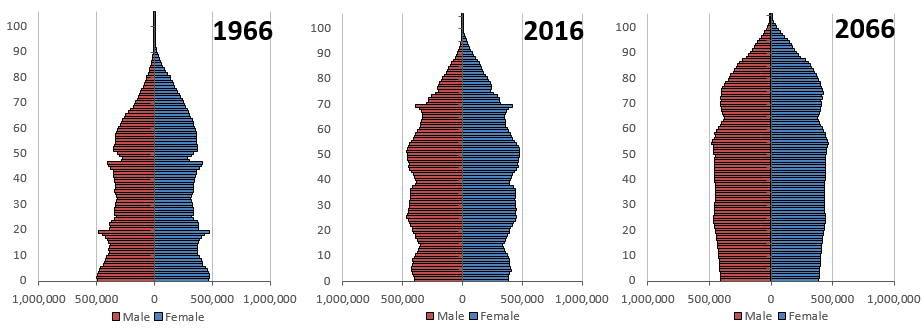
Statistics and projections produced by Office for National Statistics (ONS) have long shown that the UK’s population is ageing. Our latest projections show that in 50 years’ time, there are likely to be an additional 8.6 million people aged 65 years and over (Figure 1) – a population roughly the size of London.
The changing and ageing structure of our population is driven primarily by two factors. Firstly, improvements in life expectancy mean that people are living longer and reaching older ages. Along with this, there has been a decrease in fertility, people are having fewer children and are having children later in life.
The ageing population and changing structure of the population will bring both opportunities and challenges for the economy, services and society at national and local levels. This report sets out some of the data and analyses relevant to these three policy domains. It aims to give a resource for policy-makers, commentators, think-tanks, academics, charities and the public to use when considering how the UK should adapt to the opportunities and challenges that our changing population brings. It is supported by a complementary slide pack that provides additional evidence on the themes covered.
Figure 1: Population pyramids, 1966, 2016 and 2066 (principal projection), UK
Source: Population estimates, Principal population projections, 2016-based, Office for National Statistics
Notes:
- 2016 mid-year estimates are shown. This is because population estimates by single year of age for the age 90 and over group are produced by a different methodology and not published until the autumn of the reporting year.
Download this image Figure 1: Population pyramids, 1966, 2016 and 2066 (principal projection), UK
.PNG (22.3 kB) .xls (43.5 kB)
2. How is the UK population changing?
Through the latter half of the 20th Century, the UK population has been steadily getting older and this trend is projected to continue in the future. In 2016, there were 11.8 million UK residents aged 65 years and over, representing 18% of the total population – 25 years before, there were 9.1 million, accounting for 15.8% of the population.
Looking ahead 25 years to 2041, the 1960s baby boomers (aged in their 50s now) will have moved into older age and by 2066 there will be a further 8.6 million projected UK residents aged 65 years and over, taking the total number in this group to 20.4 million and making up 26% of the total population. This increase in numbers is broadly equivalent to the size of the population of London today.
The fastest increase will be seen in the 85 years and over age group. In mid-2016, there were 1.6 million people aged 85 years and over (2% of the total population); by mid-2041 this is projected to double to 3.2 million (4% of the population) and by 2066 to treble, by which time there will be 5.1 million people aged 85 years and over making up 7% of the total UK population. In contrast, the population aged 16 to 64 years is projected to increase by only 2% over the next 25 years and by 5% by 2066 (Figure 2).
Figure 2: Population by age group, selected years, UK
Source: Population estimates, Principal population projections, 2016-based, Office for National Statistics
Download this chart Figure 2: Population by age group, selected years, UK
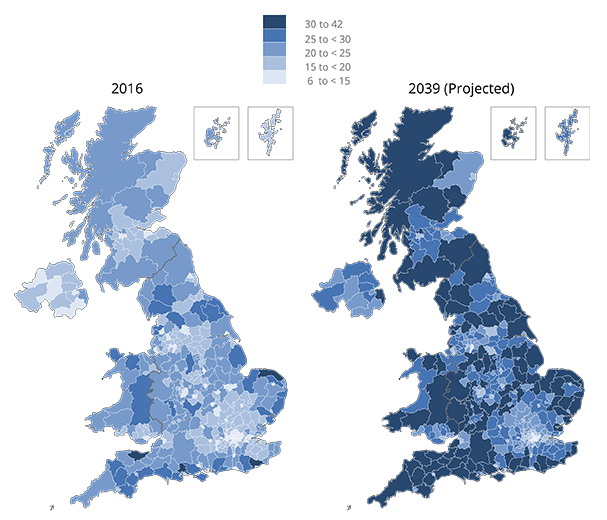
Image .csv .xlsWithin the UK, the older population is not equally spread across local areas, with older people making up higher proportions of the populations of rural and coastal areas than urban areas. The 10 local authorities with the highest percentage of the population aged 65 years and over are on the coast, with five being in the South West region of England (where more than 21.6% of the population are aged 65 years and over) (Figure 3).
Of the 10 local authorities with the lowest percentage of the population aged 65 years and over, nine of these are in the Greater London region (where less than 11.6% of the population are aged 65 years and over). Similar trends are also seen for those aged 85 years and over.
Figure 3: Proportion of the population aged 65 years and over, 2016 and 2039, UK
Source: 2016 mid-year population estimates for UK, Office for National Statistics, 2014-based subnational population projections for UK, Office for National Statistics, Welsh Government, National Records Scotland and Northern Ireland Statistics and Research Authority, contains OS data © Crown copyright 2018
Download this image Figure 3: Proportion of the population aged 65 years and over, 2016 and 2039, UK
.png (195.9 kB) .xls (67.1 kB)
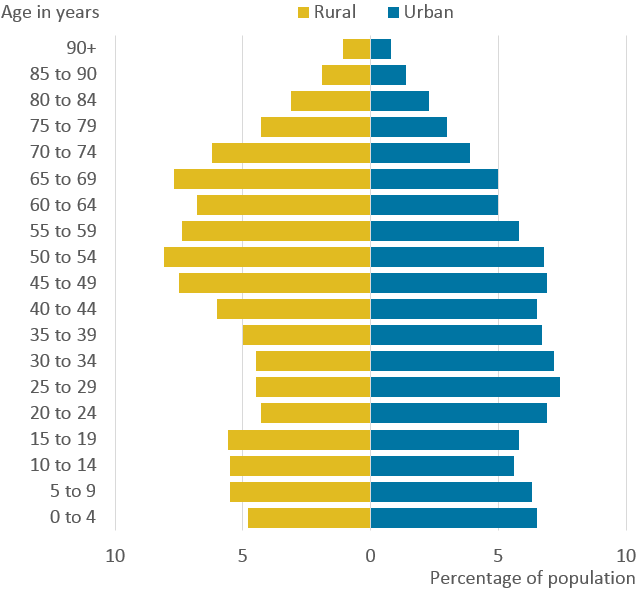
Figure 4: Percentage of population within age bands by rural-urban classification (LSOA) in England, 2016
Source: Statistical Digest of Rural England, 2018, Department for Environment, Food and Rural Affairs
Notes:
- LSOA stands for Lower Layer Super Output Area.
Download this image Figure 4: Percentage of population within age bands by rural-urban classification (LSOA) in England, 2016
.png (23.7 kB)
Over the last several decades, rural areas have seen larger increases in average age than urban areas (Figure 4). Looking ahead, the population aged 65 years and over is projected to grow by around 50% in both urban and rural areas between 2016 and 2039. In comparison, the younger population (aged under 65 years) is only projected to grow by 8% in urban areas, with virtually no increase in the younger population in rural areas (Figure 5). This will result in an increase in the ratio of older to younger people, particularly in rural areas.
Figure 5: Percentage increase in population between 2016 and 2039 (projected) by rural-urban classification (LSOA), England
Source: 2014-based subnational population projections for England and Rural Urban Classification (2011) of Lower Layer Super Output Areas in England and Wales, Office for National Statistics
Download this chart Figure 5: Percentage increase in population between 2016 and 2039 (projected) by rural-urban classification (LSOA), England
Image .csv .xls3. How do changes in the UK population compare with the rest of the world?
Population ageing is a global phenomenon. In 2015, there were around 901 million people aged 60 years and over worldwide, representing 12.3% of the global population. By 2030, this will have increased to 1.4 billion or 16.4% and by 2050, it will have increased to 2.1 billion or 21.3% of the global population.
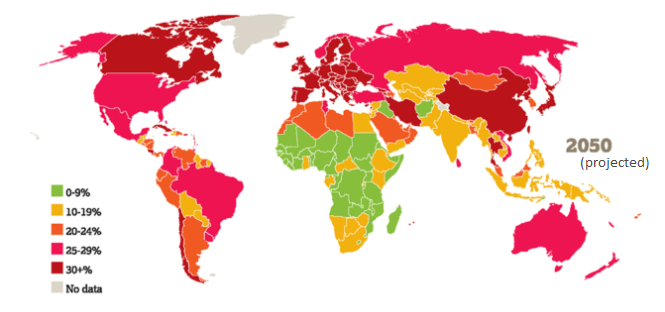
The populations of “more developed” countries have aged most rapidly, however, the proportion of older people is projected to grow in all regions of the world. By 2050, the developed nations of Europe, Japan and North America will still be amongst the countries with the oldest populations, but China and Latin America notably will also have experienced considerable population ageing (Figures 6 and 7).
Figure 6: Global population aged 60 years and over, 2015

Source: Global AgeWatch Index, 2015, HelpAge International
Download this image Figure 6: Global population aged 60 years and over, 2015
.png (147.0 kB)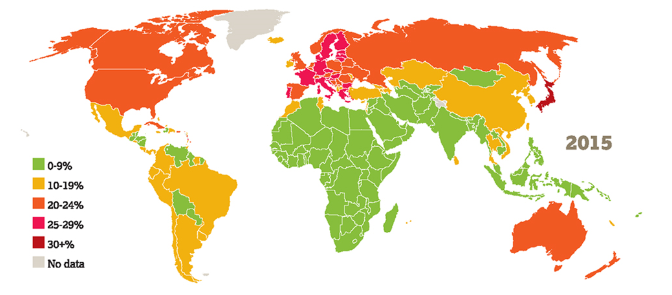
Figure 7: Projected global population aged 60 years and over, 2050
Source: Global AgeWatch Index, 2015, HelpAge International
Download this image Figure 7: Projected global population aged 60 years and over, 2050
.PNG (133.0 kB)
Compared with other EU countries, the UK ranks around the middle in terms of the proportion of older people in its population (those aged 65 years and over and aged 85 years and over) (Figures 8 and 10), but by 2035, it is projected to fall a few places down the rankings as other European countries such as Switzerland, the Netherlands and Poland age more rapidly (Figures 9 and 11).
Figures 8 and 9: Percentage of population aged 65 years and over, EU countries, 2015 and 2035 (projected)
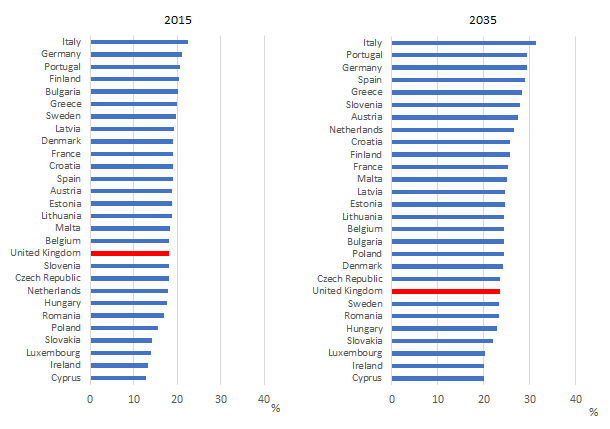
Source: World Population Prospects the 2017 revision, custom data acquired from website, United Nations Department of Economic and Social Affairs Population Division
Notes:
- Medium variant projection is used.
Download this image Figures 8 and 9: Percentage of population aged 65 years and over, EU countries, 2015 and 2035 (projected)
.png (19.0 kB) .xls (56.8 kB)
Figures 10 and 11: Percentage of population aged 85 years and over, EU countries, 2015 and 2035 (projected)

Source: World Population Prospects the 2017 revision, custom data acquired from website, United Nations Department of Economic and Social Affairs Population Division
Notes:
- Medium variant projection is used.
Download this image Figures 10 and 11: Percentage of population aged 85 years and over, EU countries, 2015 and 2035 (projected)
.png (23.7 kB) .xls (38.9 kB)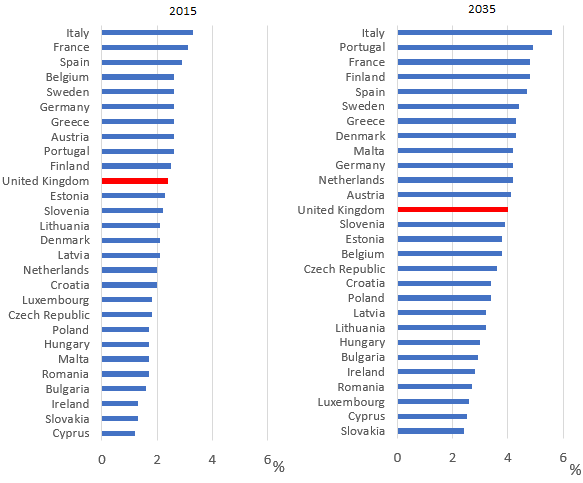
4. What has caused population ageing?
Fertility and mortality
Today’s population age-structure is determined by historical and recent patterns of fertility and mortality. Over the last 50 years, mortality rates have decreased both globally and in the UK (Figure 12). Since the 1960s, fertility rates have also declined, now averaging about 2.5 births per woman of childbearing age globally. In the UK, there has been some stabilisation in fertility rates since the mid-1970s with fertility rates now averaging about 1.9 births per woman (Figure 13).
Figure 12: Age standardised mortality rates, between 1960 to 1965 and 2015 to 2020 inclusive, UK and globally
Source: United Nations, Department of Economic and Social Affairs, Population Division (2017). World Population Prospects the 2017 revision, custom data acquired via website, UNDESA Population Division
Notes:
- Standardised to 1950 global population age structure.
Download this chart Figure 12: Age standardised mortality rates, between 1960 to 1965 and 2015 to 2020 inclusive, UK and globally
Image .csv .xls
Figure 13: Total fertility rate, between 1960 to 1965 and 2015 to 2020 inclusive, UK and globally
Source: United Nations, Department of Economic and Social Affairs, Population Division (2017). World Population Prospects the 2017 revision, custom data acquired via website, UNDESA Population Division
Download this chart Figure 13: Total fertility rate, between 1960 to 1965 and 2015 to 2020 inclusive, UK and globally
Image .csv .xlsImmigration
Immigration is often assumed to offset the effects of a country’s ageing population since immigrants tend to be of younger, working ages. However, this only presents a short-term solution since firstly, immigrants also age and although immigrants from high-fertility countries tend to have more children1, over time, second-generation migrant patterns of fertility tend to converge to those of the UK2. Also, because population ageing and falling fertility rates are occurring globally, migrant profiles may change in the future.
Life expectancy
Declining mortality rates mean higher life expectancies. A newborn male baby in the UK today can expect to live for 79.2 years and a girl to 82.9 years, with 22.6% of newborn boys and 28.3% of newborn girls projected to live to 100 years old3. Life expectancy is projected to continue to increase, however, recent trends suggest this may be at a slower rate than in the past4.
Looking 50 years ahead to 2066, life expectancy is projected to rise to 86.4 years for newborn baby boys and 88.9 years for newborn girls (Figure 14), with 44.2% of baby boys and 50% of baby girls expected to live to age 100 years (Figure 15).
Figure 14: Period and cohort life expectancy at birth, 1981 to 2066, UK
Source: Past and projected data from the period and cohort life tables, 2016-based, UK, Office for National Statistics
Notes:
Data from 1981 to 2016 are based on historical mortality rates, while data from 2017 to 2066 use projected mortality rates.
We have published an article explaining the difference between period and cohort life expectancy, see Period and cohort life expectancy explained: December 2017.
Download this chart Figure 14: Period and cohort life expectancy at birth, 1981 to 2066, UK
Image .csv .xls
Figure 15: Percentage of people expected to survive to age 100 by year of birth, 1981 to 2066, UK
Source: Past and projected data from the period and cohort life tables, 2016-based, UK, Office for National Statistics
Notes:
- Numbers of survivors are calculated from cohort life tables.
Download this chart Figure 15: Percentage of people expected to survive to age 100 by year of birth, 1981 to 2066, UK
Image .csv .xlsLife expectancy varies by area, with males and females born in the most deprived areas of England expected to live 9.4 years and 7.4 years less respectively than those born in the least deprived areas (Figure 16).
Figure 16: Life expectancy (period) at birth by index of multiple deprivation, 2014 to 2016, England
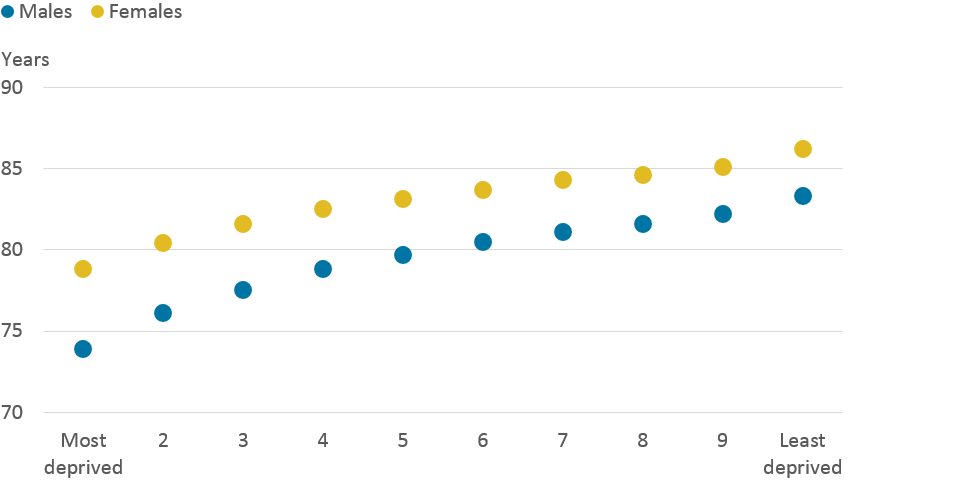
Source: Health state life expectancies by national deprivation deciles, England and Wales: 2014 to 2016, Office for National Statistics
Download this image Figure 16: Life expectancy (period) at birth by index of multiple deprivation, 2014 to 2016, England
.png (12.0 kB) .xls (60.9 kB)
Notes for: What has caused population ageing?
Births by parents' country of birth, England and Wales: 2016, Office for National Statistics.
Dubuc, Sylvie. (2016). Immigrants and ethnic fertility convergence in the UK: the role of global fertility transition and intergenerational social integration.
These are 2016-based period life expectancies.
We have undertaken research into the slowing of mortality improvements in the UK, see Changing trends in mortality: an international comparison: 2000 to 2016.
5. What are the implications of an ageing population?
Ageing is a cross-cutting issue with multiple economic, public service and societal impacts, for example, on pensions, social care, housing and well-being. It can also present opportunities both at a societal and individual level, for example, emergence of new markets, increased involvement in volunteering and community activism, longer working lives, spending more time with family and friends, and possibly providing care for family members.
In considering the implications of an ageing population it is important also to be mindful of the relationships and trade-offs between policy areas, for example, if people work for longer, does that mean that they will have less time to provide informal social care to elderly family members or to care for their grandchildren? How do older people contribute in other non-monetary ways, such as volunteering? If the availability of people to provide informal care declines, how might this impact on the demand for formal social care?
The following sections use available evidence to illustrate some of the implications of an older population across the three domains of the economy and finance, services and needs, and society and the individual.
What does an ageing population mean for the economy?
The old age dependency ratio (OADR) is the number of people of State Pension age (SPA) per 1,000 people of working age. Recent pension age reforms and those to be implemented over the next decade will keep the dependency ratio stable in the short-term, however, looking beyond 2030, the ratio will rise steeply without any further increases in SPA (Figure 17).
Figure 17: Old age dependency ratio, 1966 to 2066 (projected), UK
Source: Population estimates, State Pension Age Factors, Principal population projections, 2016-based, Office for National Statistics
Download this chart Figure 17: Old age dependency ratio, 1966 to 2066 (projected), UK
Image .csv .xls6. How many older people work and has this changed?
Male employment rates at older ages (age 50 years and over) declined steeply from the 1970s through to the late 1980s. This was due in part to the decline of traditional industries through the downturns of the 1970s and recession of the early 1980s, and economic restructuring that disproportionately affected men. Other factors included work exit incentives such as early retirement packages and more generous private pension provision at that time. Male employment rates then remained at relatively low levels before starting to increase from the mid- to late-1990s. Female employment rates at older ages were lower in the 1970s, but were less affected by downturn and restructuring. Employment rates for older women have steadily increased since the mid-1980s1.
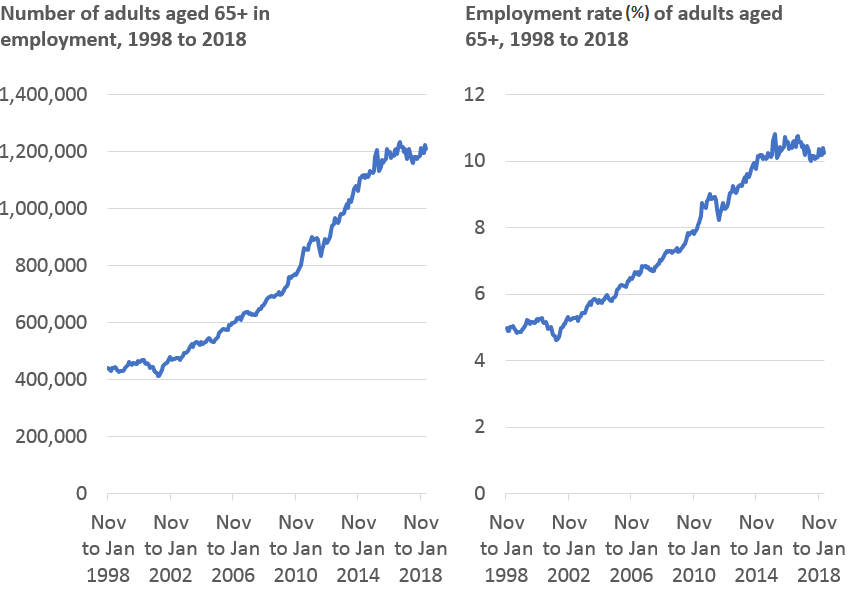
Figure 18: Persons aged 65 years and over in employment, UK, 1998 to 2018
Source: Labour Force Survey, Office for National Statistics
Download this image Figure 18: Persons aged 65 years and over in employment, UK, 1998 to 2018
.png (42.6 kB)
The number and proportion of both men and women aged 65 years and over who are working have generally risen across the past two decades, although older male rates of employment have not returned to the levels seen around 1970. Employment rates doubled for those aged 65 years and over between 1993 and 2018, and increased by almost one-third for those aged 50 to 64 years. The gap between men and women working at ages 50 to 64 years has narrowed since 20102. This is in line with the gradual rise of State Pension age (SPA) for women from age 60 years from 2010.
Over the past two years, employment rates for older workers appear to have stabilised. The numbers of older people, aged 65 years and over has remained around 1.2 million, whilst the employment rate has remained around 10% (Figure 18). It is too early to say whether it is a short- or possibly longer-term feature of the labour market.
Regarding the reasons why people work into later life, half of all people working past SPA in 2015 reported doing so because they were not ready to stop work. The second most common reason given for continuing to work was that they had to pay for essential items such as bills (15%). Only 7% of people working past SPA said they were doing so because they had to boost their pension pot (Figure 19). Further work is needed to explore whether reasons for working past SPA differ according to socio-economic status.
Figure 19: Reasons given for working beyond State Pension age, 2015, UK
Source: Annual Population Survey, Office for National Statistics
Download this chart Figure 19: Reasons given for working beyond State Pension age, 2015, UK
Image .csv .xlsOver two-thirds of people working past their SPA were working part-time and 36% were self-employed, compared with 15% of workers below SPA (Figure 20).
Figure 20: Employee and self-employed split of those working past State Pension age, 2014, UK
Source: Labour Force Survey, Office for National Statistics
Notes:
Based on a persons main job.
State Pension age takes into account the incremental increases in female State Pension age since 2010.
Datasets used are for April to June 2014.
This does not include those in "other employment".
"Other employment" includes government employment and training programmes, and unpaid family workers.
Download this chart Figure 20: Employee and self-employed split of those working past State Pension age, 2014, UK
Image .csv .xlsNotes for: How many older people work and has this changed?
IFS Report R98, Retirement in the 21st Century, 2014, Daniel Chandler and Gemma Tetlow.
Labour Force Survey, Office for National Statistics.
7. How do incomes of older people compare with younger ages?
Once retired, as might be expected, people on average have lower incomes than when they were working (Figure 21); however, older people have higher income satisfaction1 and report finding it easier to get by financially than younger people (Figure 22). Some retired households have private pensions and on average, disposable income is £10,000 higher for these households than for those without a private pension. Nevertheless, there is a lower level of income inequality among retired households than non-retired households2.
Figure 21: Median equivalised disposable household income by household type, UK, financial year ending 2017
Source: Household disposable income and inequality in the UK: financial year ending 2017, Office for National Statistics
Notes:
- Estimates have been adjusted to take account of inflation.
Download this chart Figure 21: Median equivalised disposable household income by household type, UK, financial year ending 2017
Image .csv .xls
Figure 22: People who report finding it quite or very difficult to get by financially: by age, 2015 to 2016, UK
Source: Measuring National Well-being: domains and Measures (data from Understanding Society, the UK Household Longitudinal Study, Office for National Statistics
Notes:
Respondents are asked to rate how they were coping financially from "finding it very difficult" to "living comfortably".
95% confidence intervals are displayed on the chart as error bars.
Download this chart Figure 22: People who report finding it quite or very difficult to get by financially: by age, 2015 to 2016, UK
Image .csv .xlsIt is difficult to predict how equal incomes of future generations of retirees will be. Auto-enrolment in workplace pensions, brought in during 2012, has boosted numbers with a private pension (Figure 23). Many of these are likely to be defined contribution pension schemes (where contributions are invested by the pension provider and the performance of the fund can go up and down depending on how the underlying investments perform). The value of these pensions is therefore less certain than the defined benefit pension schemes that many current retirees were able to join.
Figure 23: Proportion of employees with workplace pensions: by type of pension, 1997 to 2017, UK
Source: Annual Survey of Hours and Earnings pension tables, UK: 2017 provisional and 2016 revised results, Office for National Statistics
Notes:
Results for 2005 onwards are based on a new questionnaire and may not be comparable to earlier results.
The occupational defined contribution category includes employees who have pensions with the National Employer Savings Trust (NEST). The "group personal and group stakeholder" category includes group personal pensions, group stakeholder pensions and group self-invested personal pensions.
Download this chart Figure 23: Proportion of employees with workplace pensions: by type of pension, 1997 to 2017, UK
Image .csv .xlsNotes for: How do incomes of older people compare with younger ages?
Measuring National Well-being: Domains and Measures (data from Understanding Society, the UK Household Longitudinal Study), Office for National Statistics.
Household disposable income and inequality in the UK: financial year ending 2017, Office for National Statistics.
8. What does an ageing population mean for public spending?
At the macro-economic level, pensions are already the largest item of welfare expenditure in 20161, with State Pension provision accounting for 4.6% of gross domestic product (GDP) in the UK, a rise from 3.6% since 19972. Public spending on health has risen from 4.4% of GDP to 6.9% over the same period3.
Figure 24 shows representative profiles for public service spending items and for tax and welfare spending. It shows that people of working age contribute more in tax than they consume in terms of public spending. This switches in later life as people consume more welfare spending, reflecting spending on pensions, and more health and social care spending but pay less tax.
Figure 24: Representative profiles for tax, public services, and welfare spending, 2021 to 2022, UK
Source: Fiscal sustainability report, January 2017, Office for Budget Responsibility
Download this chart Figure 24: Representative profiles for tax, public services, and welfare spending, 2021 to 2022, UK
Image .csv .xlsHow does wealth compare between older and younger ages and how has this changed?
As might be expected, wealth increases with age (Figure 25), however, younger generations have less wealth at the same age than previous generations. A typical adult born during the early 1980s had half as much total net wealth at age 30 years compared with a typical adult born five years earlier when they turned 30 years old4. Much of this is related to the housing market, with property wealth of those in their early 30s having steadily decreased over the last decade5.
Figure 25: Median household wealth by age and wealth component by age of household reference person, July 2014 to June 2016, Great Britain
Source: Wealth and Assets Survey, Office for National Statistics
Notes:
- The Household Reference Person (HRP) is defined as the sole householder in one person households, the person with the highest income in joint person households and in households where householders have the same income, the oldest is taken as the HRP.
Download this chart Figure 25: Median household wealth by age and wealth component by age of household reference person, July 2014 to June 2016, Great Britain
Image .csv .xlsHow do older and younger ages compare in terms of home ownership and renting?
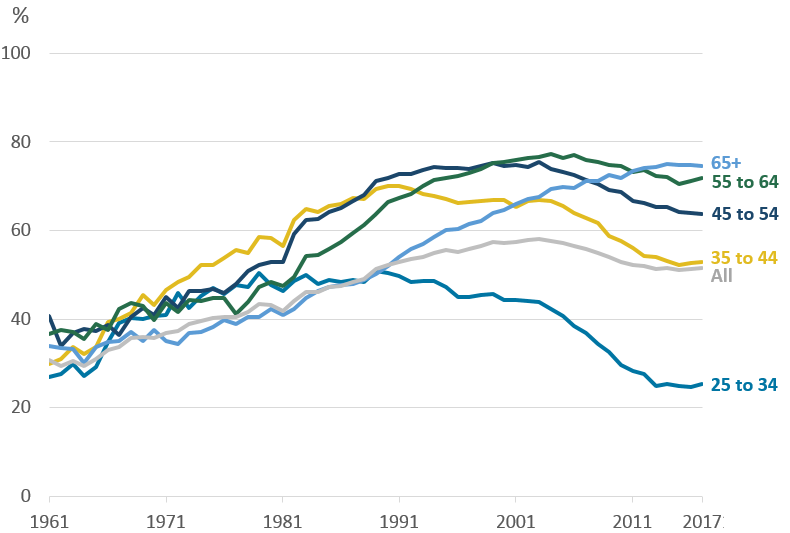
Over three-quarters of households where the household reference person is aged 65 years and over are owner-occupied, with the vast majority owned outright6. While the percentage of these households has increased since 2008 to 2009, the average age of first-time buyers has increased7 and home ownership rates have decreased among all generations below the age of 65 years and most sharply for those aged 25 to 34 and 35 to 44 years (Figure 26).
Figure 26: Families (singles or couples) owning their own home, by age group, 1961 to 2017, UK
Source: Housing data, Resolution Foundation (resolutionfoundation.org)
Notes:
There is a change of data source in 1984, resulting in small inconsistencies. Prior to 1980, housing association renters are included in the private rented sector. Prior to 1984, full-time students in parents’ homes are included as single adults in parents’ homes.
Data includes those owning outright, and those who own with a mortgage.
Download this image Figure 26: Families (singles or couples) owning their own home, by age group, 1961 to 2017, UK
.png (46.9 kB) .xls (36.4 kB)
As home ownership has declined, renting has increased for all but the oldest ages8. Over the last decade, the proportion of households where the household reference person is aged 25 to 34 and 35 to 44 years old, which are owner-occupied, decreased by 34% and 27% respectively; and for the same age groups, renting increased by 44% and 68%. This reflects an increase in house prices, which have doubled relative to average earnings in the last 20 years9.
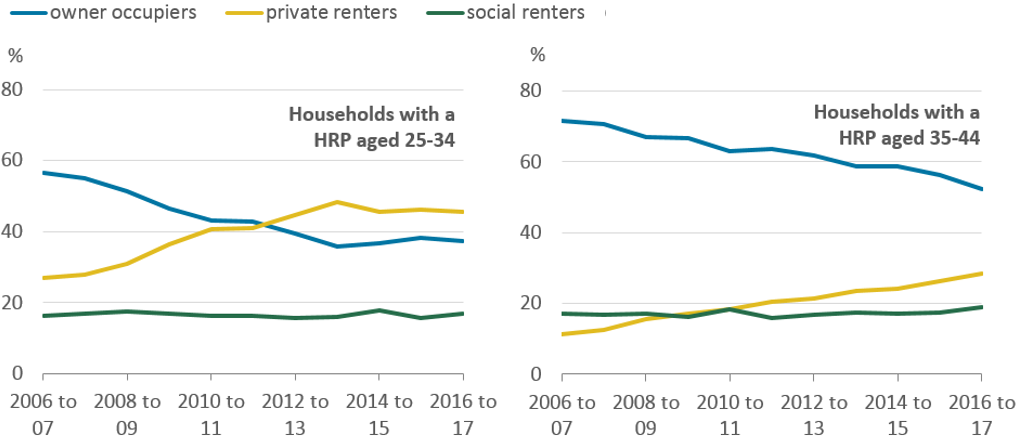
Households headed by someone aged 25 to 34 years in England are now more likely to be renting privately than buying with a mortgage (Figure 27).
Figure 27: Trends in tenure, households with a household reference person aged 25 to 34 years or 35 to 44 years, between 2006 to 2007 and 2016 to 2017 inclusive, England
Source: English Housing Survey, 2016 to 2017, Ministry of Housing, Communities and Local Government
Notes:
- Contains public sector information licensed under the Open Government Licence v3.0.
Download this image Figure 27: Trends in tenure, households with a household reference person aged 25 to 34 years or 35 to 44 years, between 2006 to 2007 and 2016 to 2017 inclusive, England
.png (83.5 kB)
Renting is split into the private and social sectors. Across England, the proportion of households renting privately has increased over the last 10 years, while the social rented sector has decreased (Figure 28)10.
The routes into private renting vary by income. Over the last two decades, increases in private renting amongst high-income and particularly middle-income households were associated with reductions in home ownership (as house prices increase relative to earnings). While among low-income groups, increases in private renting were mainly associated with reductions in social renting (due to shrinkage of the social rental sector).
Figure 28: Change in percentage of population in each housing tenure, between 1994 to 1996 and 2013 to 2015 inclusive by income quintile, Great Britain
Source: The cost of housing for low-income renters, Institute for Fiscal Studies. Robert Joyce, Matthew Mitchell, Agnes Norris Keiller © Institute for Fiscal Studies
Notes:
- Years refer to financial years. Incomes have been measured before housing costs have been deducted and equivalised using an after-housing-costs equivalence scale. Income quintiles are defined within each year and broad region.
Download this chart Figure 28: Change in percentage of population in each housing tenure, between 1994 to 1996 and 2013 to 2015 inclusive by income quintile, Great Britain
Image .csv .xlsDeclining levels of home ownership among all those aged under 65 years suggest that in the future, more retirees could still be paying off a mortgage or be renting. However, we do not know what will happen to the housing market in the future and younger generations may inherit property from today’s older generations that have enjoyed high levels of home ownership, although with the increase in life expectancy, this may occur later in their lives than for previous generations.
Notes for: What does an ageing population mean for public spending?
‘How is the welfare budget spent?’ Office for National Statistics, 2017.
Expenditure on State Pension and GDP, ONS. State Pension expenditure (also called social security benefits in cash) excluding other benefits. Seasonally adjusted GDP was used.
Expenditure on healthcare (Figure 17) and GDP, ONS. Figures refer to government healthcare expenditure only and exclude private spending. Seasonally adjusted GDP was used. Estimates from the “Expenditure on Healthcare in the UK” series are used here as the time series available stretches back to 1997. However, it should be noted that these estimates differ from the headline measure for healthcare expenditure as a percentage of GDP in the UK Health Accounts, which is produced to the latest internationally-standardised definitions.
Resolution Foundation, The Generation of Wealth, 2017, C. D'Arcy and L. Gardiner.
Economic well-being, UK: October to December 2017, Office for National Statistics.
English Housing Survey, Ministry of Housing, Communities and Local Government, 2015 to 2016.
English Housing Survey, Ministry of Housing, Communities and Local Government, 2016 to 2017.
English Housing Survey, Ministry of Housing, Communities and Local Government,2016 to 2017.
Housing affordability in England and Wales: 2017, Office for National Statistics.
English Housing Survey, Ministry of Housing, Communities and Local Government, 2016 to 2017.
9. What are the implications of living longer for services?
How easy is it for older people to access the services they need?
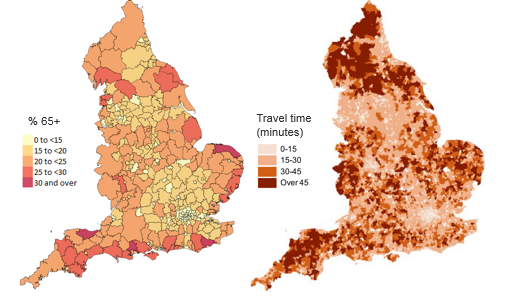
Older people are more likely to live in rural areas than younger people, where accessing services often means longer journeys (Figure 29).
Figure 29: Proportion of the population aged 65 years and over and average minimum travel time for eight key local services (minutes), 2014, England
Source: 2014 mid-year population estimates, Office for National Statistics; Journey time statistics: access to services, 2014, Department for Transport
Notes:
- Contains public sector information licensed under the Open Government Licence v3.0.
Download this image Figure 29: Proportion of the population aged 65 years and over and average minimum travel time for eight key local services (minutes), 2014, England
.PNG (171.3 kB)
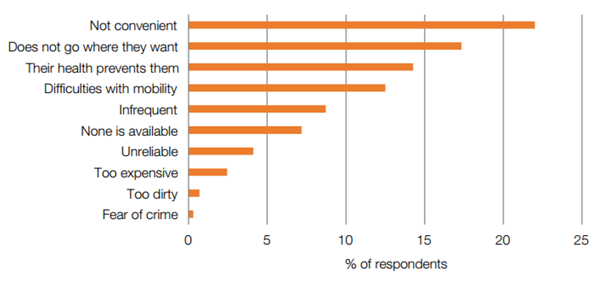
Public and private transport is less available in rural areas than in cities1, so people are more reliant on cars but driving rates decrease with age2. This can leave older people in rural areas isolated and struggling to access services, particularly those who cannot afford to pay for taxis or do not have family members or neighbours who can provide transport. Even in areas where public transport provision is good, difficulties with mobility or other health issues can be a barrier to accessing services for those without use of a car (Figure 30).
Figure 30: Reasons for not using public transport given by those aged 65 and over, 2012 to 2013, England
Source: Future of Transport in an Ageing Society, ILC-UK and Age UK, 2015. (Data from the English Longitudinal Study of Ageing.)
Download this image Figure 30: Reasons for not using public transport given by those aged 65 and over, 2012 to 2013, England
.png (42.1 kB)
Notes for: What are the implications of living longer for services?
Department for Transport, National Travel Survey.
Department for Transport, Driving licence holding and vehicle availability (NTS02).
10. What are the implications of living longer for health services?
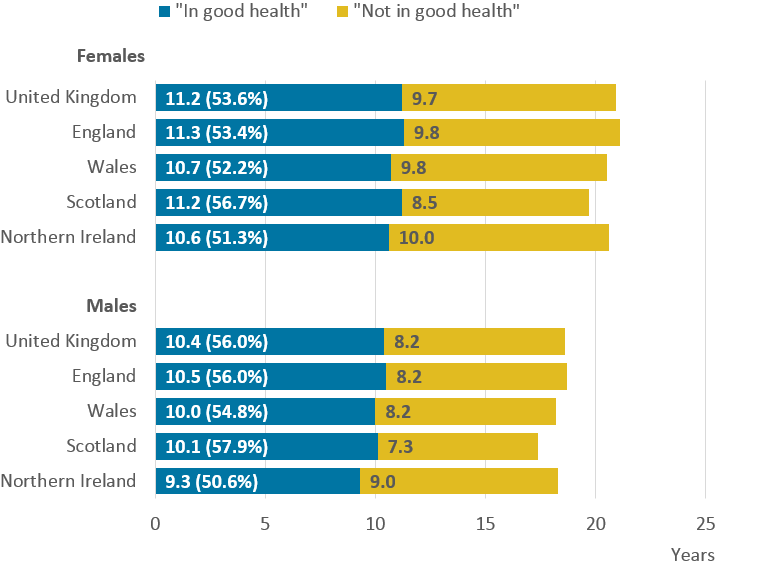
At age 65 years, both men and women can expect to spend around half of their remaining life expectancy in good health. However, the likelihood of being disabled and/or experiencing multiple chronic and complex health conditions among those aged 65 years and over increases with age1. As life expectancy increases, so does the amount of time spent in poor health (Figure 31).
Figure 31: Life expectancy and the proportion of life spent in good health at age 65 years, by sex, 2014 to 2016, UK and constituent countries
Source: Health state life expectancies, UK: 2014 to 2016, (Data from Annual Population Survey), Office for National Statistics
Download this image Figure 31: Life expectancy and the proportion of life spent in good health at age 65 years, by sex, 2014 to 2016, UK and constituent countries
.png (39.9 kB) .xls (36.9 kB)
Chronic conditions are those that persist and require on-going management over a period of years or decades. A person with multiple chronic conditions has more complex treatment needs than a person with one condition. The Health Survey for England shows that in 2016, of those aged 60 to 64 years, 29% had two or more chronic conditions. For those aged 75 years and over this rises to almost half. (Figure 32).
Figure 32: Number of grouped health conditions by age, 2016, England
Source: Health Survey for England, NHS Digital
Notes:
- Contains public sector information licensed under the Open Government Licence v3.0.
Download this chart Figure 32: Number of grouped health conditions by age, 2016, England
Image .csv .xlsThose in the lowest socio-economic groups are the most likely to experience multiple health problems and find it the hardest to access the health services they need2,3.
Dementia is one of the health conditions highly associated with ageing, particularly for people aged in their mid- to late-70s and above. It is estimated that 850,000 people in the UK have dementia but only around two-thirds of those have been diagnosed. By 2025, it is estimated that 1 million people in the UK could be living with dementia and by 2050 this could exceed 2 million4.
Healthcare requirements increase with age, with healthcare costs increasing steeply from around age 65 years (Figure 33). Hospital admissions have increased since financial year ending 2007, but with a steeper increase in admissions for the 66 and over age group (Figure 34). This has contributed to rising healthcare costs.
Figure 33: NHS general and acute care age-cost curve, 2013 to 2014, England
Source: Technical Guide to Allocation Formulae and Pace of Change, 2016 to 2017, NHS England
Notes:
- Contains public sector information licensed under the Open Government Licence v3.0.
Download this chart Figure 33: NHS general and acute care age-cost curve, 2013 to 2014, England
Image .csv .xls
Figure 34: Trends in number of NHS hospital admissions, between 2006 to 2007 and 2015 to 2016 inclusive, England
Source: Trends in the number of English NHS hospital admissions, The Health Foundation
Download this chart Figure 34: Trends in number of NHS hospital admissions, between 2006 to 2007 and 2015 to 2016 inclusive, England
Image .csv .xlsNotes for: What are the implications of living longer for health services?
Source: Health Survey for England, 2016, NHS Digital.
Future of Transport in an Ageing Society, (ELSA data), ILC-UK and Age UK.
Barnett K and others (2012) Lancet volume 380, pages 37 to 43.
Dementia: applying All Our Health, Public Health England and Diagnosis in the UK, Alzheimers Research UK and Dementia Statistics Hub.
11. What are the implications of living longer for social care services?
Social care can be provided in the home or in a residential setting and includes both paid (formal) care and care provided by family, friends and volunteers (informal care).
Social care requirements also increase with age. One in five men and women aged between 75 and 84 years have at least some problems washing or dressing. This rises to 34% of men and 42% of women at ages 85 years and over (Figure 35).
Figure 35: Percentage of males and females who reported "I have no problems washing or dressing myself", 2017, England
Source: NHS England and Ipsos MORI, GP Patient Survey
Download this chart Figure 35: Percentage of males and females who reported "I have no problems washing or dressing myself", 2017, England
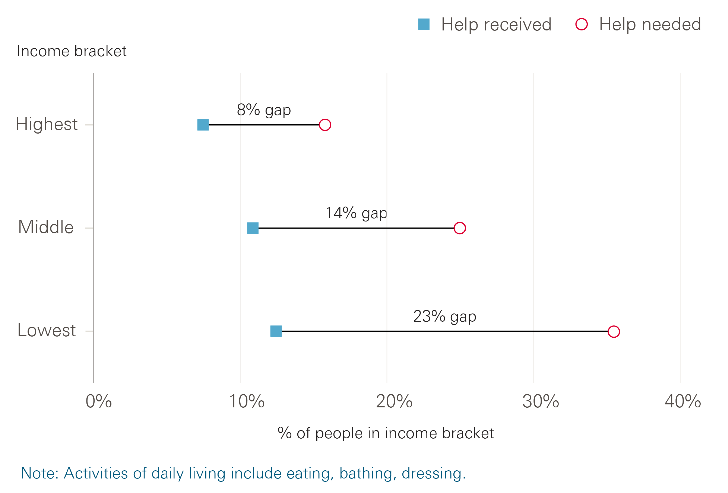
Image .csv .xlsPeople aged 65 years and over on low incomes are more likely to need help with daily activities. Although those on low incomes are more likely to receive help than those on higher incomes, the gap between the need for help and receipt of help is widest for those on low incomes, at 23 percentage points, compared with 8 percentage points for those on the highest incomes.
Figure 36: Gap in provision between receipt of and need for help with daily activities, by income bracket among those aged 65 years and over, 2014, England
Source: Health and Social Care Funding explained, The Health Foundation
Download this image Figure 36: Gap in provision between receipt of and need for help with daily activities, by income bracket among those aged 65 years and over, 2014, England
.PNG (25.3 kB)
While the need for social care services at older ages has increased as a consequence of increases in the number of older people, gross real-terms spending on adult social care by local authorities has been steadily declining in recent years1 while the number of older people receiving publicly-funded social care has declined2. There was a slight rise in spending on social care in the last year, but real-terms spending remains around 1% lower than 10 years ago3 (Figure 37).
The number of local authority adult social services jobs, particularly direct care jobs, has also declined4. However, these make up only 7% of all jobs in the adult social care sector and the overall number of adult social care jobs in England has risen in recent years5. These patterns suggest an increase in private provision of formal social care.
Figure 37: Change in gross current expenditure on adult social care by local authorities in cash and real terms, 2005 to 2006 and 2016 to 2017 inclusive, England
Source: Adult social care activity and finance report, England, 2016/17, NHS Digital
Notes:
- Contains public sector information licensed under the Open Government Licence v3.0.
Download this chart Figure 37: Change in gross current expenditure on adult social care by local authorities in cash and real terms, 2005 to 2006 and 2016 to 2017 inclusive, England
Image .csv .xlsWhile there has been an increase in the number of domiciliary (home) care agencies (Figure 38), the number of people receiving local authority or Health and Social Care Trust (HSCT) funded home care has decreased (Figure 39). Over the six years between 2009 and 2015, there was a 20% decrease in the number of people receiving domiciliary care funded by a local authority or HSCT in the UK; in England alone there was a 24% decrease. (These figures relate to people receiving domiciliary care of all ages, however, the majority of these are aged 65 years and over.)
Looking at types of residential care, the number of nursing home beds has increased since 2010, however, the number of residential home beds has decreased, resulting in the same overall number of beds available today (Figure 38). With an ageing population, this means a higher overall ratio of older people to care home beds although the situation will vary locally.
Figure 38: Adult social care market trends, 2010 to 2017, England

Source: The state of adult social care services, Care Quality Commission (CQC registration data, March 2017)
Notes:
- Contains public sector information licensed under the Open Government Licence v3.0.
Download this image Figure 38: Adult social care market trends, 2010 to 2017, England
.png (101.3 kB)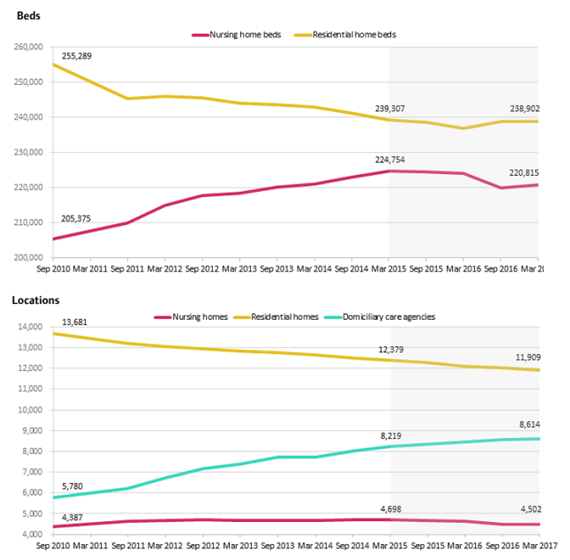
Figure 39: Total people receiving domiciliary care funded by a local authority or Health and Social Care Trusts (HSCT) across the UK in a sample week, 2009 to 2015
Source: An Overview of the Domiciliary Care Market in the United Kingdom, 2016, United Kingdom Homecare Association
Download this chart Figure 39: Total people receiving domiciliary care funded by a local authority or Health and Social Care Trusts (HSCT) across the UK in a sample week, 2009 to 2015
Image .csv .xlsAny decline in the accessibility of formal social care increases the need for informal social care and it is often adult children (and most often daughters) who provide this to an elderly parent (Figure 40). These women are likely to be aged in their 50s and 60s6. Many will be working and some will still have caring responsibilities for children – the “sandwich generation”.
Figure 40: Who informal carers care for, 2016 to 2017, UK
Source: Family Resource Survey, Department for Work and Pensions
Notes:
- Contains public sector information licensed under the Open Government Licence v3.0.
Download this chart Figure 40: Who informal carers care for, 2016 to 2017, UK
Image .csv .xlsWith the trends towards having children later and increased childlessness7 coupled with changes in State Pension age (SPA) necessitating women to work to later ages, there could be an impact on the availability of informal social care provision in the future, putting further pressure on formal social care services.
Many older people are themselves carers; 12% of those aged 65 to 74 years, 9% of those aged 75 to 84 years and 8% of those aged 85 years and over provide care to others. Women are more likely to provide informal care than men up to and including the 75 to 84 age group, while for the 85 and over age group this is reversed (Figure 41). This may reflect the fact that women aged 85 years and over are more likely to be widowed than men of this age group and are therefore less likely to have the opportunity to care for their spouse than men.
Figure 41: Percentage of people providing informal care by age and sex, 2016 to 2017, UK
Source: Family Resources Survey, Department for Work and Pensions
Notes:
- Contains public sector information licensed under the Open Government Licence v3.0.
Download this chart Figure 41: Percentage of people providing informal care by age and sex, 2016 to 2017, UK
Image .csv .xlsUnpaid caring is not without a cost. Being a carer may have a negative impact on the carer’s own health, with the proportion of people assessing themselves as “not in good health” rising in line with the number of hours of caring they provide8. This in turn will add to healthcare demand.
There is an interplay between health and social care demand (both formal and informal). Health care and social care are also linked by transfers of patients between these services. Delayed transfers of care occur when a patient is medically ready to depart from their current care setting but is unable to do so because of non-clinical reasons. A higher proportion of delays were attributable to the NHS than to social services in 2017 to 2018. Delays where the patient was awaiting a care package in their own home were the most common reason accounting for the largest number of delayed days (21%)9.
Awaiting a residential home placement or availability accounted for a further 11% of delayed days and awaiting a nursing home placement or availability a further 14%9.
Notes for: What are the implications of living longer on social care services?
Adult social care includes care provided to adults of all ages.
Approaches to social care funding, the Kings Health foundation working paper, February 2018.
Adult social care activity and finance report, England 2016 to 2017, NHS Digital.
Personal Social Services: Staff of Social Services Departments, England, 2017, NHS Digital.
The size and structure of the adult social care workforce in England, 2017, Skills for Care.
Family Resources Survey, Department for Work and Pensions.
Childbearing for women born in different years, England and Wales: 2016, Office for National Statistics.
Full story: The gender gap in unpaid care provision: is there an impact on health and economic position? Office for National Statistics.
Delayed Transfers of Care Statistics for England, 2017 to 2018, NHS England.
12. What are the implications of living longer for society and the individual?
How do older people compare with younger people in terms of well-being?
In terms of personal well-being (life satisfaction; how worthwhile life is; and happiness) levels vary across different ages. Ratings of personal well-being are lowest around mid-life but then start to rise around ages 60 to 64 years, peaking between the mid-60s and mid-70s before starting to decrease with age.
Similarly, anxiety levels are highest in mid-life and start to decline in people’s early- to mid-60s, dropping to their lowest levels in the mid- to late-60s after which they stay relatively stable (Figure 42). It seems feasible that the reported higher levels of well-being from the mid- to late-60s reflect the life stage change from working life to retirement and the decreases in well-being at the oldest ages reflect declines in health and increased risk of widowhood.
Figure 42: Average personal well-being ratings by age, 2012 to 2015, UK

Source: Annual Population Survey (APS), Office for National Statistics
Download this image Figure 42: Average personal well-being ratings by age, 2012 to 2015, UK
.png (52.0 kB)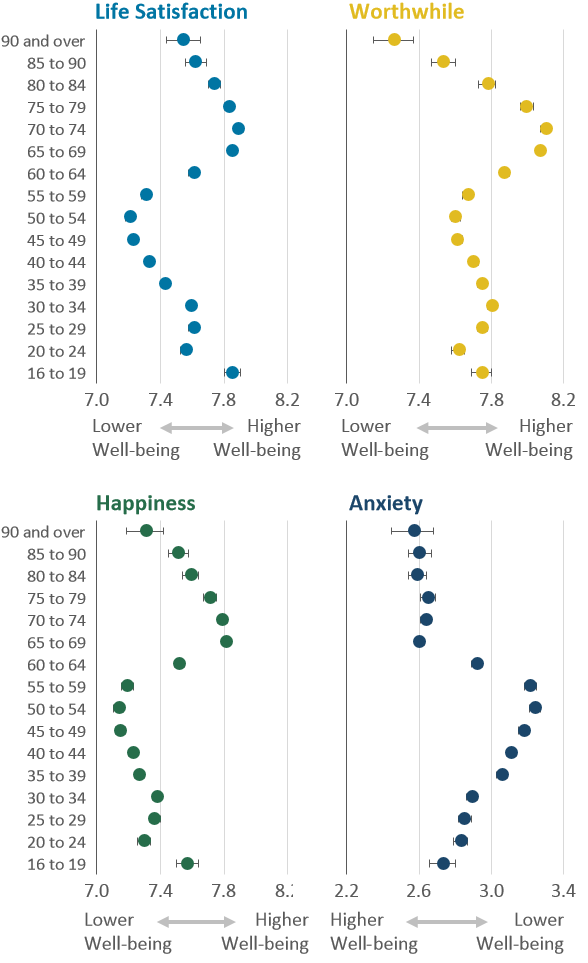
13. How well connected are older people?
How socially connected people feel is a factor in quality of life and living alone is a risk factor for social isolation. Older people are more likely to live alone than younger people and older women are more likely to live alone than older men, but with a small decrease for women over time (Figures 43 and 44). Older women are more likely to live alone than men mainly because they tend to marry men who are older than them1 and women have longer life expectancies than men, so they are more likely to be widowed.
Widowhood for women has decreased from 57% in 1986 to 42% in 2016, reflecting a narrowing of the gap in life expectancy between the sexes. While divorce rates at ages 70 years and over have fluctuated slightly, marriage rates at these ages have increased in recent years, with the majority of these marriages being remarriages2.
Figure 43: Women living alone, 1996 to 2016, UK
Source: Families and Households, 2017 and Annual mid-year population estimates 1996 to 2016, Office for National Statistics
Download this chart Figure 43: Women living alone, 1996 to 2016, UK
Image .csv .xls
Figure 44: Men living alone, 1996 to 2016, UK
Source: Families and Households, 2017 and Annual mid-year population estimates 1996 to 2016, Office for National Statistics
Download this chart Figure 44: Men living alone, 1996 to 2016, UK
Image .csv .xlsOlder people arguably experience more barriers to feeling connected to the world in which they live than younger people, potentially increasing their sense of isolation. Older people are more likely to have difficulties accessing services such as General Practitioners (GPs), hospitals, banks or post offices, particularly if they are reliant on public transport3. Distances to these services may have increased with the closure of local facilities (Figure 45).
Figure 45: UK bank, building society and post office branch numbers, 1997 to 2017, UK
Source: Commons Briefing papers SN00385, House of Commons Library
Notes:
- Contains public sector information licensed under the Open Government Licence v3.0.
Download this chart Figure 45: UK bank, building society and post office branch numbers, 1997 to 2017, UK
Image .csv .xlsAdditionally, many services have moved online and older people, particularly the very old, are much less likely to use the internet than younger people. However, in recent years, there are signs of this changing. More older people are becoming digitally literate, with the percentage of those aged 75 years and over who report using the internet increasing year-on-year. Between 2011 and 2017, the proportion of people aged 75 years and over who had used the internet during the previous three months doubled (from 20% to 41%), although people in this age group are still much less likely to use the internet than younger age groups (Figure 46).
Figure 46: Proportion of adults aged 45 years and over who used the internet in the last three months, 2011 to 2017, UK
Source: Internet users, 2017, UK. Annual Population Survey, Office for National Statistics
Notes:
Percentage changes sum to less than 100 due to "don't know" responses.
The years represent the period Quarter 1 (January to March) each year.
Download this chart Figure 46: Proportion of adults aged 45 years and over who used the internet in the last three months, 2011 to 2017, UK
Image .csv .xlsDigital exclusion among older people may become less of an issue in the future as those who have used the internet in their working and social lives continue to do so as they reach older ages; however, given the pace of technological advances it may still be the case that older people, particularly the very old who are most vulnerable to cognitive decline, experience some degree of digital exclusion.
While less likely to be socially connected online4, older people are more engaged with their communities, with those aged 65 years and over more likely to say they feel they belong to their local area, regularly stop and talk with people in their neighbourhoods, to trust their neighbours and be willing to help them than younger age groups (Figure 47).
Figure 47: Proportion of people who feel people in their local area can be trusted; are willing to help their neighbours; feel they belong to their local area and regularly stop and talk to people in their neighbourhood, by age, 2014 to 2015, UK
Source: Inequalities in Social Capital by Age and Sex, Office for National Statistics, July 2015 (data from Understanding Society)
Download this chart Figure 47: Proportion of people who feel people in their local area can be trusted; are willing to help their neighbours; feel they belong to their local area and regularly stop and talk to people in their neighbourhood, by age, 2014 to 2015, UK
Image .csv .xlsHowever, older people are more fearful about walking alone after dark than younger people, particularly at the oldest ages5, which in the winter, when it gets dark by 4pm, may increase feelings of isolation. This could be because of fear of falling, mobility limitations, uneven pavements, poor street lighting and a fear of crime.
Notes for: How well connected are older people?
Marriages in England and Wales: 2015, Office for National Statistics.
Population estimates by marital status and living arrangements, England and Wales: 2002 to 2016 Office for National Statistics. Marriages in England and Wales, Office for National Statistics.
Future of Transport in an Ageing Society, (ELSA data), ILC-UK and Age UK.
Internet access - households and individuals: 2017, Office for National Statistics.
Crime Survey for England and Wales, Office for National Statistics.
14. How do older people feel about their risk of crime?
Older people have a disproportionately high perception of their risk of crime compared with how often they are victims (Figure 48), with older people being less likely to be a victim of crime than the population as a whole. However, for some types of crime, older people are more likely to be targeted because of their perceived vulnerability, for instance, distraction burglary, where an offender gains entry to a house under false pretences to commit theft, and some types of fraud, particularly those where the victim is tricked into transferring money under false pretences (Figure 49).
Figure 48: Proportion who have been victim of crime and their perception of likelihood of being a victim, by age group, year ending March 2016, England and Wales
Source: Crime in England and Wales: Annual Trend and Demographic tables and Annual supplementary tables, Office for National Statistics
Download this chart Figure 48: Proportion who have been victim of crime and their perception of likelihood of being a victim, by age group, year ending March 2016, England and Wales
Image .csv .xls
Figure 49: Prevalence of crime by selected crime type and age group, 2017, England and Wales
Source: Crime Survey for England and Wales, 2017, Office for National Statistics
Notes:
- Burglary, vehicle related theft and criminal damage and arson refer to the age of the household reference person.
Download this chart Figure 49: Prevalence of crime by selected crime type and age group, 2017, England and Wales
Image .csv .xls15. How diverse are older people?
In considering the challenges of an ageing population it is important not to consider older people as a group who are all very similar. They are diverse in terms of age (65-year-olds will have very different requirements to 85-year-olds), life stage (working or retired), health status, income and wealth, marital status and living arrangements.
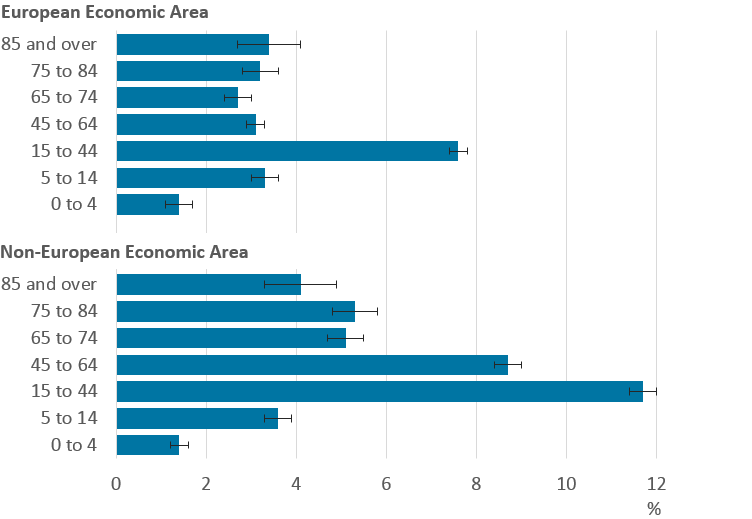
Past and current immigration patterns mean that the older population in the UK is also becoming, and will continue to become, more diverse in terms of ethnicity, religion and country of birth (8% of current UK residents aged 65 years and over were born outside the UK) (Figure 50). This could have implications for local cultural needs, language barriers, health and well-being.
Figure 50: UK residents not born in the UK, by age and country of birth, 2014
Source: UK population by country of birth and nationality grouping, by sex and age: 2014, Office for National Statistics
Download this image Figure 50: UK residents not born in the UK, by age and country of birth, 2014
.png (22.5 kB)
16. How do we understand all the implications of living longer?
Another important consideration is that the lives of older people today have been influenced by the choices, behaviours and experiences of their earlier lives. In thinking about evidence that will inform effective policy interventions to meet the challenges of a continuing ageing population, it is important that we take a life course approach and identify the early- and mid-life factors that have most impact on later lives.
Nôl i'r tabl cynnwys17. Sources
This article draws upon evidence shown in the linked slide pack, which references a number of different sources:
Care Quality Commission, The state of adult social care services, 2014 to 2017 (PDF, 2.4MB)
Cassell A, Edwards D, Harshfield A, Rhodes K, Brimicombe J, Payne R, Griffin S (2018) The epidemiology of multimorbidity in primary care: a retrospective cohort study. British Journal of General Practice. 2018 Apr; 6(669): e245–e251.
Department for Transport, Driving licence holding and vehicle availability (NTS02)
Department for Transport, Journey time statistics: access to services, 2014 (PDF, 7.7MB)
Department for Transport, National Travel Survey
Department for Work and Pensions, Family Resources Survey
Eurofound, European Quality of Life Survey
Health and Social Care Information Centre, Survey of Carers in Households, 2009 to 2010 (PDF, 1.4MB)
HelpAge, Global AgeWatch Index 2015
House of Commons Library, Briefing Paper 7007, Dementia: policy, services and statistics
House of Commons Library, Briefing Paper SN00385, Bank branch closures
Ministry of Housing, Communities and Local Government, English Housing Survey
National Records Scotland, Population Projections for Scottish Areas (2014-based)
NHS Digital, Adult social care activity and finance report, England, 2016 to 2017
NHS Digital, Health Survey for England
NHS Digital, Personal Social Services: Staff of Social Services Departments, England, 2017
NHS England, Delayed Transfers of Care Statistics for England, 2017 to 2018
NHS England, GP Patient Survey
NHS England, Technical Guide to Allocation Formulae and Pace of Change, 2016 to 2017 (PDF, 842KB)
Office for Budget Responsibility, Fiscal sustainability report, January 2017
Office for National Statistics, 2014-based subnational population projections for England
Office for National Statistics, 2016-based UK national population projections
Office for National Statistics, Annual Population Survey
Office for National Statistics, Annual Survey of Hours and Earnings
Office for National Statistics, Breakdown of total household wealth and its components by age band
Office for National Statistics, Calculating State Pension age: Pensions Act 2014
Office for National Statistics, Crime in England and Wales: Annual supplementary tables
Office for National Statistics, Crime Survey for England and Wales
Office for National Statistics, Divorces in England and Wales
Office for National Statistics, Economic well-being, UK: October to December 2017
Office for National Statistics, Expectation of life, principal projection, 2014-based
Office for National Statistics, Expenditure on GDP
Office for National Statistics, Expenditure on healthcare
Office for National Statistics, Expenditure on State Pension
Office for National Statistics, Families and households
Office for National Statistics, Healthy state life expectancies, UK: 2014 to 2016
Office for National Statistics, Housing affordability in England and Wales: 2017
Office for National Statistics, How is the welfare budget spent?
Office for National Statistics, Inequalities in social capital by age and sex, July 2015
Office for National Statistics, Internet access - households and individuals: 2017
Office for National Statistics, Internet users
Office for National Statistics, Labour Force Survey
Office for National Statistics, Marriages data
Office for National Statistics, Marriages in England and Wales
Office for National Statistics, National Life Tables
Office for National Statistics, Opinions and Lifestyle Survey
Office for National Statistics, Participation rates in the UK - 2014 - 3. Older people
Office for National Statistics, Population estimates by marital status
Office for National Statistics, Subnational population estimates for UK
Public Health England, Dementia: applying All Our Health
Resolution Foundation, Creative Commons Licence
Resolution Foundation, Home ownership in the UK
Resolution Foundation, The Generation of Wealth, 2017, D'Arcy C and Gardiner L (PDF, 1.8MB)
Resolution Foundation, The Million Dollar Be-Question, 2017, Gardiner L (PDF, 482KB)
The Health Foundation, Health and Social Care Funding explained
The Health Foundation, Trends in the number of English NHS hospital admissions, 2006 to 2016
United Nations Department of Economic and Social Affairs Population Division, (2017) World Population Prospects, the 2017 revision, custom data acquired via website
Nôl i'r tabl cynnwys